Free Statistics

of Irreproducible Research!

Author's title

Author*The author of this computation has been verified*
R Software Modulerwasp_autocorrelation.wasp
Title produced by software(Partial) Autocorrelation Function
Date of computationFri, 04 Dec 2009 08:37:37 -0700
Cite this page as followsStatistical Computations at FreeStatistics.org, Office for Research Development and Education, URL https://freestatistics.org/blog/index.php?v=date/2009/Dec/04/t12599410977mu2lc2x0bwlfak.htm/, Retrieved Sun, 28 Apr 2024 15:26:01 +0000
Statistical Computations at FreeStatistics.org, Office for Research Development and Education, URL https://freestatistics.org/blog/index.php?pk=63782, Retrieved Sun, 28 Apr 2024 15:26:01 +0000
QR Codes:

Original text written by user:
IsPrivate?No (this computation is public)
User-defined keywords
Estimated Impact122
Family? (F = Feedback message, R = changed R code, M = changed R Module, P = changed Parameters, D = changed Data)
-     [Univariate Data Series] [data set] [2008-12-01 19:54:57] [b98453cac15ba1066b407e146608df68]
- RMP   [(Partial) Autocorrelation Function] [] [2009-11-27 14:46:03] [b98453cac15ba1066b407e146608df68]
-    D      [(Partial) Autocorrelation Function] [] [2009-12-04 15:37:37] [c88a5f1b97e332c6387d668c465455af] [Current]
-    D        [(Partial) Autocorrelation Function] [] [2009-12-16 17:16:51] [73863f7f907331e734eff34b7de6fc83]
Feedback Forum

Post a new message
Dataseries X:
1258
1199
1158
1427
934
709
1186
986
1033
1257
1105
1179
1092
1092
1087
2028
2039
2010
754
760
715
855
971
815
915
843
761
1858
2968
4061
3661
3269
2857
2568
2274
1987
683
381
71
1772
3485
5181
4479
3782
3067
2489
1903
1330
736
483
242
1334
2423
3523
2986
2462
1908
1575
1237
904


Summary of computational transaction
Raw Inputview raw input (R code)
Raw Outputview raw output of R engine
Computing time1 seconds
R Server'Gwilym Jenkins' @ 72.249.127.135

\begin{tabular}{lllllllll}
\hline
Summary of computational transaction \tabularnewline
Raw Input & view raw input (R code)  \tabularnewline
Raw Output & view raw output of R engine  \tabularnewline
Computing time & 1 seconds \tabularnewline
R Server & 'Gwilym Jenkins' @ 72.249.127.135 \tabularnewline
\hline
\end{tabular}
%Source: https://freestatistics.org/blog/index.php?pk=63782&T=0

[TABLE]
[ROW][C]Summary of computational transaction[/C][/ROW]
[ROW][C]Raw Input[/C][C]view raw input (R code) [/C][/ROW]
[ROW][C]Raw Output[/C][C]view raw output of R engine [/C][/ROW]
[ROW][C]Computing time[/C][C]1 seconds[/C][/ROW]
[ROW][C]R Server[/C][C]'Gwilym Jenkins' @ 72.249.127.135[/C][/ROW]
[/TABLE]
Source: https://freestatistics.org/blog/index.php?pk=63782&T=0

Globally Unique Identifier (entire table): ba.freestatistics.org/blog/index.php?pk=63782&T=0

As an alternative you can also use a QR Code:  

The GUIDs for individual cells are displayed in the table below:

Summary of computational transaction
Raw Inputview raw input (R code)
Raw Outputview raw output of R engine
Computing time1 seconds
R Server'Gwilym Jenkins' @ 72.249.127.135


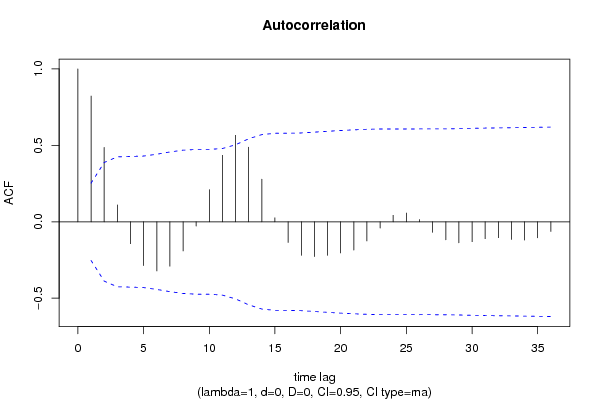
Autocorrelation Function
Time lag kACF(k)T-STATP-value
10.822786.37320
20.486323.7670.000189
30.1099870.8520.198813
4-0.14327-1.10980.135764
5-0.285914-2.21470.015296
6-0.321355-2.48920.007797
7-0.290273-2.24840.014117
8-0.190727-1.47740.072404
9-0.028052-0.21730.414359
100.2098661.62560.054636
110.4348853.36860.000662
120.5656684.38162.4e-05
130.4881153.78090.000181
140.2790392.16140.017331
150.0258630.20030.420949
16-0.135085-1.04640.149795
17-0.219219-1.69810.047339
18-0.227352-1.76110.041662
19-0.219335-1.6990.047253
20-0.203252-1.57440.060328
21-0.184554-1.42950.079017
22-0.124779-0.96650.168828
23-0.0412-0.31910.375368
240.0428330.33180.370604
250.0574920.44530.328841
260.014610.11320.455138
27-0.069027-0.53470.297422
28-0.118152-0.91520.181874
29-0.137285-1.06340.14593
30-0.130355-1.00970.158341
31-0.110507-0.8560.197707
32-0.103666-0.8030.212574
33-0.115273-0.89290.187739
34-0.119551-0.9260.179068
35-0.104537-0.80970.210644
36-0.063273-0.49010.31292

\begin{tabular}{lllllllll}
\hline
Autocorrelation Function \tabularnewline
Time lag k & ACF(k) & T-STAT & P-value \tabularnewline
1 & 0.82278 & 6.3732 & 0 \tabularnewline
2 & 0.48632 & 3.767 & 0.000189 \tabularnewline
3 & 0.109987 & 0.852 & 0.198813 \tabularnewline
4 & -0.14327 & -1.1098 & 0.135764 \tabularnewline
5 & -0.285914 & -2.2147 & 0.015296 \tabularnewline
6 & -0.321355 & -2.4892 & 0.007797 \tabularnewline
7 & -0.290273 & -2.2484 & 0.014117 \tabularnewline
8 & -0.190727 & -1.4774 & 0.072404 \tabularnewline
9 & -0.028052 & -0.2173 & 0.414359 \tabularnewline
10 & 0.209866 & 1.6256 & 0.054636 \tabularnewline
11 & 0.434885 & 3.3686 & 0.000662 \tabularnewline
12 & 0.565668 & 4.3816 & 2.4e-05 \tabularnewline
13 & 0.488115 & 3.7809 & 0.000181 \tabularnewline
14 & 0.279039 & 2.1614 & 0.017331 \tabularnewline
15 & 0.025863 & 0.2003 & 0.420949 \tabularnewline
16 & -0.135085 & -1.0464 & 0.149795 \tabularnewline
17 & -0.219219 & -1.6981 & 0.047339 \tabularnewline
18 & -0.227352 & -1.7611 & 0.041662 \tabularnewline
19 & -0.219335 & -1.699 & 0.047253 \tabularnewline
20 & -0.203252 & -1.5744 & 0.060328 \tabularnewline
21 & -0.184554 & -1.4295 & 0.079017 \tabularnewline
22 & -0.124779 & -0.9665 & 0.168828 \tabularnewline
23 & -0.0412 & -0.3191 & 0.375368 \tabularnewline
24 & 0.042833 & 0.3318 & 0.370604 \tabularnewline
25 & 0.057492 & 0.4453 & 0.328841 \tabularnewline
26 & 0.01461 & 0.1132 & 0.455138 \tabularnewline
27 & -0.069027 & -0.5347 & 0.297422 \tabularnewline
28 & -0.118152 & -0.9152 & 0.181874 \tabularnewline
29 & -0.137285 & -1.0634 & 0.14593 \tabularnewline
30 & -0.130355 & -1.0097 & 0.158341 \tabularnewline
31 & -0.110507 & -0.856 & 0.197707 \tabularnewline
32 & -0.103666 & -0.803 & 0.212574 \tabularnewline
33 & -0.115273 & -0.8929 & 0.187739 \tabularnewline
34 & -0.119551 & -0.926 & 0.179068 \tabularnewline
35 & -0.104537 & -0.8097 & 0.210644 \tabularnewline
36 & -0.063273 & -0.4901 & 0.31292 \tabularnewline
\hline
\end{tabular}
%Source: https://freestatistics.org/blog/index.php?pk=63782&T=1

[TABLE]
[ROW][C]Autocorrelation Function[/C][/ROW]
[ROW][C]Time lag k[/C][C]ACF(k)[/C][C]T-STAT[/C][C]P-value[/C][/ROW]
[ROW][C]1[/C][C]0.82278[/C][C]6.3732[/C][C]0[/C][/ROW]
[ROW][C]2[/C][C]0.48632[/C][C]3.767[/C][C]0.000189[/C][/ROW]
[ROW][C]3[/C][C]0.109987[/C][C]0.852[/C][C]0.198813[/C][/ROW]
[ROW][C]4[/C][C]-0.14327[/C][C]-1.1098[/C][C]0.135764[/C][/ROW]
[ROW][C]5[/C][C]-0.285914[/C][C]-2.2147[/C][C]0.015296[/C][/ROW]
[ROW][C]6[/C][C]-0.321355[/C][C]-2.4892[/C][C]0.007797[/C][/ROW]
[ROW][C]7[/C][C]-0.290273[/C][C]-2.2484[/C][C]0.014117[/C][/ROW]
[ROW][C]8[/C][C]-0.190727[/C][C]-1.4774[/C][C]0.072404[/C][/ROW]
[ROW][C]9[/C][C]-0.028052[/C][C]-0.2173[/C][C]0.414359[/C][/ROW]
[ROW][C]10[/C][C]0.209866[/C][C]1.6256[/C][C]0.054636[/C][/ROW]
[ROW][C]11[/C][C]0.434885[/C][C]3.3686[/C][C]0.000662[/C][/ROW]
[ROW][C]12[/C][C]0.565668[/C][C]4.3816[/C][C]2.4e-05[/C][/ROW]
[ROW][C]13[/C][C]0.488115[/C][C]3.7809[/C][C]0.000181[/C][/ROW]
[ROW][C]14[/C][C]0.279039[/C][C]2.1614[/C][C]0.017331[/C][/ROW]
[ROW][C]15[/C][C]0.025863[/C][C]0.2003[/C][C]0.420949[/C][/ROW]
[ROW][C]16[/C][C]-0.135085[/C][C]-1.0464[/C][C]0.149795[/C][/ROW]
[ROW][C]17[/C][C]-0.219219[/C][C]-1.6981[/C][C]0.047339[/C][/ROW]
[ROW][C]18[/C][C]-0.227352[/C][C]-1.7611[/C][C]0.041662[/C][/ROW]
[ROW][C]19[/C][C]-0.219335[/C][C]-1.699[/C][C]0.047253[/C][/ROW]
[ROW][C]20[/C][C]-0.203252[/C][C]-1.5744[/C][C]0.060328[/C][/ROW]
[ROW][C]21[/C][C]-0.184554[/C][C]-1.4295[/C][C]0.079017[/C][/ROW]
[ROW][C]22[/C][C]-0.124779[/C][C]-0.9665[/C][C]0.168828[/C][/ROW]
[ROW][C]23[/C][C]-0.0412[/C][C]-0.3191[/C][C]0.375368[/C][/ROW]
[ROW][C]24[/C][C]0.042833[/C][C]0.3318[/C][C]0.370604[/C][/ROW]
[ROW][C]25[/C][C]0.057492[/C][C]0.4453[/C][C]0.328841[/C][/ROW]
[ROW][C]26[/C][C]0.01461[/C][C]0.1132[/C][C]0.455138[/C][/ROW]
[ROW][C]27[/C][C]-0.069027[/C][C]-0.5347[/C][C]0.297422[/C][/ROW]
[ROW][C]28[/C][C]-0.118152[/C][C]-0.9152[/C][C]0.181874[/C][/ROW]
[ROW][C]29[/C][C]-0.137285[/C][C]-1.0634[/C][C]0.14593[/C][/ROW]
[ROW][C]30[/C][C]-0.130355[/C][C]-1.0097[/C][C]0.158341[/C][/ROW]
[ROW][C]31[/C][C]-0.110507[/C][C]-0.856[/C][C]0.197707[/C][/ROW]
[ROW][C]32[/C][C]-0.103666[/C][C]-0.803[/C][C]0.212574[/C][/ROW]
[ROW][C]33[/C][C]-0.115273[/C][C]-0.8929[/C][C]0.187739[/C][/ROW]
[ROW][C]34[/C][C]-0.119551[/C][C]-0.926[/C][C]0.179068[/C][/ROW]
[ROW][C]35[/C][C]-0.104537[/C][C]-0.8097[/C][C]0.210644[/C][/ROW]
[ROW][C]36[/C][C]-0.063273[/C][C]-0.4901[/C][C]0.31292[/C][/ROW]
[/TABLE]
Source: https://freestatistics.org/blog/index.php?pk=63782&T=1

Globally Unique Identifier (entire table): ba.freestatistics.org/blog/index.php?pk=63782&T=1

As an alternative you can also use a QR Code:  

The GUIDs for individual cells are displayed in the table below:

Autocorrelation Function
Time lag kACF(k)T-STATP-value
10.822786.37320
20.486323.7670.000189
30.1099870.8520.198813
4-0.14327-1.10980.135764
5-0.285914-2.21470.015296
6-0.321355-2.48920.007797
7-0.290273-2.24840.014117
8-0.190727-1.47740.072404
9-0.028052-0.21730.414359
100.2098661.62560.054636
110.4348853.36860.000662
120.5656684.38162.4e-05
130.4881153.78090.000181
140.2790392.16140.017331
150.0258630.20030.420949
16-0.135085-1.04640.149795
17-0.219219-1.69810.047339
18-0.227352-1.76110.041662
19-0.219335-1.6990.047253
20-0.203252-1.57440.060328
21-0.184554-1.42950.079017
22-0.124779-0.96650.168828
23-0.0412-0.31910.375368
240.0428330.33180.370604
250.0574920.44530.328841
260.014610.11320.455138
27-0.069027-0.53470.297422
28-0.118152-0.91520.181874
29-0.137285-1.06340.14593
30-0.130355-1.00970.158341
31-0.110507-0.8560.197707
32-0.103666-0.8030.212574
33-0.115273-0.89290.187739
34-0.119551-0.9260.179068
35-0.104537-0.80970.210644
36-0.063273-0.49010.31292


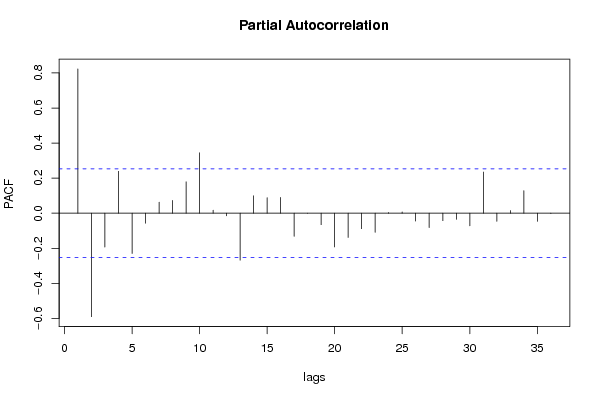
Partial Autocorrelation Function
Time lag kPACF(k)T-STATP-value
10.822786.37320
2-0.590174-4.57151.2e-05
3-0.193395-1.4980.069684
40.2391431.85240.034445
5-0.229244-1.77570.040425
6-0.057028-0.44170.330135
70.0628120.48650.314178
80.0727510.56350.287588
90.1792521.38850.085062
100.3446592.66970.004876
110.0173550.13440.446755
12-0.015017-0.11630.453894
13-0.268075-2.07650.021069
140.0994620.77040.222034
150.0882970.68390.248321
160.0897020.69480.244923
17-0.132019-1.02260.155297
180.0003260.00250.498998
19-0.065919-0.51060.305751
20-0.192616-1.4920.07047
21-0.13843-1.07230.143946
22-0.08813-0.68270.248727
23-0.108954-0.8440.201025
240.0035370.02740.489118
250.0073930.05730.477263
26-0.044949-0.34820.364463
27-0.082155-0.63640.263479
28-0.042717-0.33090.370944
29-0.034936-0.27060.393807
30-0.072343-0.56040.288659
310.2346311.81740.037072
32-0.046579-0.36080.359758
330.0151010.1170.453638
340.1282830.99370.162185
35-0.046333-0.35890.360467
36-0.001233-0.00960.496204

\begin{tabular}{lllllllll}
\hline
Partial Autocorrelation Function \tabularnewline
Time lag k & PACF(k) & T-STAT & P-value \tabularnewline
1 & 0.82278 & 6.3732 & 0 \tabularnewline
2 & -0.590174 & -4.5715 & 1.2e-05 \tabularnewline
3 & -0.193395 & -1.498 & 0.069684 \tabularnewline
4 & 0.239143 & 1.8524 & 0.034445 \tabularnewline
5 & -0.229244 & -1.7757 & 0.040425 \tabularnewline
6 & -0.057028 & -0.4417 & 0.330135 \tabularnewline
7 & 0.062812 & 0.4865 & 0.314178 \tabularnewline
8 & 0.072751 & 0.5635 & 0.287588 \tabularnewline
9 & 0.179252 & 1.3885 & 0.085062 \tabularnewline
10 & 0.344659 & 2.6697 & 0.004876 \tabularnewline
11 & 0.017355 & 0.1344 & 0.446755 \tabularnewline
12 & -0.015017 & -0.1163 & 0.453894 \tabularnewline
13 & -0.268075 & -2.0765 & 0.021069 \tabularnewline
14 & 0.099462 & 0.7704 & 0.222034 \tabularnewline
15 & 0.088297 & 0.6839 & 0.248321 \tabularnewline
16 & 0.089702 & 0.6948 & 0.244923 \tabularnewline
17 & -0.132019 & -1.0226 & 0.155297 \tabularnewline
18 & 0.000326 & 0.0025 & 0.498998 \tabularnewline
19 & -0.065919 & -0.5106 & 0.305751 \tabularnewline
20 & -0.192616 & -1.492 & 0.07047 \tabularnewline
21 & -0.13843 & -1.0723 & 0.143946 \tabularnewline
22 & -0.08813 & -0.6827 & 0.248727 \tabularnewline
23 & -0.108954 & -0.844 & 0.201025 \tabularnewline
24 & 0.003537 & 0.0274 & 0.489118 \tabularnewline
25 & 0.007393 & 0.0573 & 0.477263 \tabularnewline
26 & -0.044949 & -0.3482 & 0.364463 \tabularnewline
27 & -0.082155 & -0.6364 & 0.263479 \tabularnewline
28 & -0.042717 & -0.3309 & 0.370944 \tabularnewline
29 & -0.034936 & -0.2706 & 0.393807 \tabularnewline
30 & -0.072343 & -0.5604 & 0.288659 \tabularnewline
31 & 0.234631 & 1.8174 & 0.037072 \tabularnewline
32 & -0.046579 & -0.3608 & 0.359758 \tabularnewline
33 & 0.015101 & 0.117 & 0.453638 \tabularnewline
34 & 0.128283 & 0.9937 & 0.162185 \tabularnewline
35 & -0.046333 & -0.3589 & 0.360467 \tabularnewline
36 & -0.001233 & -0.0096 & 0.496204 \tabularnewline
\hline
\end{tabular}
%Source: https://freestatistics.org/blog/index.php?pk=63782&T=2

[TABLE]
[ROW][C]Partial Autocorrelation Function[/C][/ROW]
[ROW][C]Time lag k[/C][C]PACF(k)[/C][C]T-STAT[/C][C]P-value[/C][/ROW]
[ROW][C]1[/C][C]0.82278[/C][C]6.3732[/C][C]0[/C][/ROW]
[ROW][C]2[/C][C]-0.590174[/C][C]-4.5715[/C][C]1.2e-05[/C][/ROW]
[ROW][C]3[/C][C]-0.193395[/C][C]-1.498[/C][C]0.069684[/C][/ROW]
[ROW][C]4[/C][C]0.239143[/C][C]1.8524[/C][C]0.034445[/C][/ROW]
[ROW][C]5[/C][C]-0.229244[/C][C]-1.7757[/C][C]0.040425[/C][/ROW]
[ROW][C]6[/C][C]-0.057028[/C][C]-0.4417[/C][C]0.330135[/C][/ROW]
[ROW][C]7[/C][C]0.062812[/C][C]0.4865[/C][C]0.314178[/C][/ROW]
[ROW][C]8[/C][C]0.072751[/C][C]0.5635[/C][C]0.287588[/C][/ROW]
[ROW][C]9[/C][C]0.179252[/C][C]1.3885[/C][C]0.085062[/C][/ROW]
[ROW][C]10[/C][C]0.344659[/C][C]2.6697[/C][C]0.004876[/C][/ROW]
[ROW][C]11[/C][C]0.017355[/C][C]0.1344[/C][C]0.446755[/C][/ROW]
[ROW][C]12[/C][C]-0.015017[/C][C]-0.1163[/C][C]0.453894[/C][/ROW]
[ROW][C]13[/C][C]-0.268075[/C][C]-2.0765[/C][C]0.021069[/C][/ROW]
[ROW][C]14[/C][C]0.099462[/C][C]0.7704[/C][C]0.222034[/C][/ROW]
[ROW][C]15[/C][C]0.088297[/C][C]0.6839[/C][C]0.248321[/C][/ROW]
[ROW][C]16[/C][C]0.089702[/C][C]0.6948[/C][C]0.244923[/C][/ROW]
[ROW][C]17[/C][C]-0.132019[/C][C]-1.0226[/C][C]0.155297[/C][/ROW]
[ROW][C]18[/C][C]0.000326[/C][C]0.0025[/C][C]0.498998[/C][/ROW]
[ROW][C]19[/C][C]-0.065919[/C][C]-0.5106[/C][C]0.305751[/C][/ROW]
[ROW][C]20[/C][C]-0.192616[/C][C]-1.492[/C][C]0.07047[/C][/ROW]
[ROW][C]21[/C][C]-0.13843[/C][C]-1.0723[/C][C]0.143946[/C][/ROW]
[ROW][C]22[/C][C]-0.08813[/C][C]-0.6827[/C][C]0.248727[/C][/ROW]
[ROW][C]23[/C][C]-0.108954[/C][C]-0.844[/C][C]0.201025[/C][/ROW]
[ROW][C]24[/C][C]0.003537[/C][C]0.0274[/C][C]0.489118[/C][/ROW]
[ROW][C]25[/C][C]0.007393[/C][C]0.0573[/C][C]0.477263[/C][/ROW]
[ROW][C]26[/C][C]-0.044949[/C][C]-0.3482[/C][C]0.364463[/C][/ROW]
[ROW][C]27[/C][C]-0.082155[/C][C]-0.6364[/C][C]0.263479[/C][/ROW]
[ROW][C]28[/C][C]-0.042717[/C][C]-0.3309[/C][C]0.370944[/C][/ROW]
[ROW][C]29[/C][C]-0.034936[/C][C]-0.2706[/C][C]0.393807[/C][/ROW]
[ROW][C]30[/C][C]-0.072343[/C][C]-0.5604[/C][C]0.288659[/C][/ROW]
[ROW][C]31[/C][C]0.234631[/C][C]1.8174[/C][C]0.037072[/C][/ROW]
[ROW][C]32[/C][C]-0.046579[/C][C]-0.3608[/C][C]0.359758[/C][/ROW]
[ROW][C]33[/C][C]0.015101[/C][C]0.117[/C][C]0.453638[/C][/ROW]
[ROW][C]34[/C][C]0.128283[/C][C]0.9937[/C][C]0.162185[/C][/ROW]
[ROW][C]35[/C][C]-0.046333[/C][C]-0.3589[/C][C]0.360467[/C][/ROW]
[ROW][C]36[/C][C]-0.001233[/C][C]-0.0096[/C][C]0.496204[/C][/ROW]
[/TABLE]
Source: https://freestatistics.org/blog/index.php?pk=63782&T=2

Globally Unique Identifier (entire table): ba.freestatistics.org/blog/index.php?pk=63782&T=2

As an alternative you can also use a QR Code:  

The GUIDs for individual cells are displayed in the table below:

Partial Autocorrelation Function
Time lag kPACF(k)T-STATP-value
10.822786.37320
2-0.590174-4.57151.2e-05
3-0.193395-1.4980.069684
40.2391431.85240.034445
5-0.229244-1.77570.040425
6-0.057028-0.44170.330135
70.0628120.48650.314178
80.0727510.56350.287588
90.1792521.38850.085062
100.3446592.66970.004876
110.0173550.13440.446755
12-0.015017-0.11630.453894
13-0.268075-2.07650.021069
140.0994620.77040.222034
150.0882970.68390.248321
160.0897020.69480.244923
17-0.132019-1.02260.155297
180.0003260.00250.498998
19-0.065919-0.51060.305751
20-0.192616-1.4920.07047
21-0.13843-1.07230.143946
22-0.08813-0.68270.248727
23-0.108954-0.8440.201025
240.0035370.02740.489118
250.0073930.05730.477263
26-0.044949-0.34820.364463
27-0.082155-0.63640.263479
28-0.042717-0.33090.370944
29-0.034936-0.27060.393807
30-0.072343-0.56040.288659
310.2346311.81740.037072
32-0.046579-0.36080.359758
330.0151010.1170.453638
340.1282830.99370.162185
35-0.046333-0.35890.360467
36-0.001233-0.00960.496204


Parameters (Session):
par1 = 36 ; par2 = 1 ; par3 = 0 ; par4 = 0 ; par5 = 12 ; par6 = MA ; par7 = 0.95 ;
Parameters (R input):
par1 = 36 ; par2 = 1 ; par3 = 0 ; par4 = 0 ; par5 = 12 ; par6 = MA ; par7 = 0.95 ;
R code (references can be found in the software module):
if (par1 == 'Default') {
par1 = 10*log10(length(x))
} else {
par1 <- as.numeric(par1)
}
par2 <- as.numeric(par2)
par3 <- as.numeric(par3)
par4 <- as.numeric(par4)
par5 <- as.numeric(par5)
if (par6 == 'White Noise') par6 <- 'white' else par6 <- 'ma'
par7 <- as.numeric(par7)
if (par2 == 0) {
x <- log(x)
} else {
x <- (x ^ par2 - 1) / par2
}
if (par3 > 0) x <- diff(x,lag=1,difference=par3)
if (par4 > 0) x <- diff(x,lag=par5,difference=par4)
bitmap(file='pic1.png')
racf <- acf(x, par1, main='Autocorrelation', xlab='time lag', ylab='ACF', ci.type=par6, ci=par7, sub=paste('(lambda=',par2,', d=',par3,', D=',par4,', CI=', par7, ', CI type=',par6,')',sep=''))
dev.off()
bitmap(file='pic2.png')
rpacf <- pacf(x,par1,main='Partial Autocorrelation',xlab='lags',ylab='PACF')
dev.off()
(myacf <- c(racf$acf))
(mypacf <- c(rpacf$acf))
lengthx <- length(x)
sqrtn <- sqrt(lengthx)
load(file='createtable')
a<-table.start()
a<-table.row.start(a)
a<-table.element(a,'Autocorrelation Function',4,TRUE)
a<-table.row.end(a)
a<-table.row.start(a)
a<-table.element(a,'Time lag k',header=TRUE)
a<-table.element(a,hyperlink('basics.htm','ACF(k)','click here for more information about the Autocorrelation Function'),header=TRUE)
a<-table.element(a,'T-STAT',header=TRUE)
a<-table.element(a,'P-value',header=TRUE)
a<-table.row.end(a)
for (i in 2:(par1+1)) {
a<-table.row.start(a)
a<-table.element(a,i-1,header=TRUE)
a<-table.element(a,round(myacf[i],6))
mytstat <- myacf[i]*sqrtn
a<-table.element(a,round(mytstat,4))
a<-table.element(a,round(1-pt(abs(mytstat),lengthx),6))
a<-table.row.end(a)
}
a<-table.end(a)
table.save(a,file='mytable.tab')
a<-table.start()
a<-table.row.start(a)
a<-table.element(a,'Partial Autocorrelation Function',4,TRUE)
a<-table.row.end(a)
a<-table.row.start(a)
a<-table.element(a,'Time lag k',header=TRUE)
a<-table.element(a,hyperlink('basics.htm','PACF(k)','click here for more information about the Partial Autocorrelation Function'),header=TRUE)
a<-table.element(a,'T-STAT',header=TRUE)
a<-table.element(a,'P-value',header=TRUE)
a<-table.row.end(a)
for (i in 1:par1) {
a<-table.row.start(a)
a<-table.element(a,i,header=TRUE)
a<-table.element(a,round(mypacf[i],6))
mytstat <- mypacf[i]*sqrtn
a<-table.element(a,round(mytstat,4))
a<-table.element(a,round(1-pt(abs(mytstat),lengthx),6))
a<-table.row.end(a)
}
a<-table.end(a)
table.save(a,file='mytable1.tab')