Free Statistics

of Irreproducible Research!

Author's title

Author*The author of this computation has been verified*
R Software Modulerwasp_autocorrelation.wasp
Title produced by software(Partial) Autocorrelation Function
Date of computationFri, 04 Dec 2009 08:39:29 -0700
Cite this page as followsStatistical Computations at FreeStatistics.org, Office for Research Development and Education, URL https://freestatistics.org/blog/index.php?v=date/2009/Dec/04/t1259941209u2y2ciq2wxu272b.htm/, Retrieved Sun, 28 Apr 2024 05:27:20 +0000
Statistical Computations at FreeStatistics.org, Office for Research Development and Education, URL https://freestatistics.org/blog/index.php?pk=63785, Retrieved Sun, 28 Apr 2024 05:27:20 +0000
QR Codes:

Original text written by user:
IsPrivate?No (this computation is public)
User-defined keywords
Estimated Impact117
Family? (F = Feedback message, R = changed R code, M = changed R Module, P = changed Parameters, D = changed Data)
-     [Univariate Data Series] [data set] [2008-12-01 19:54:57] [b98453cac15ba1066b407e146608df68]
- RMP   [(Partial) Autocorrelation Function] [] [2009-11-27 14:47:30] [b98453cac15ba1066b407e146608df68]
-    D      [(Partial) Autocorrelation Function] [] [2009-12-04 15:39:29] [c88a5f1b97e332c6387d668c465455af] [Current]
-    D        [(Partial) Autocorrelation Function] [] [2009-12-16 17:25:56] [73863f7f907331e734eff34b7de6fc83]
Feedback Forum

Post a new message
Dataseries X:
1258
1199
1158
1427
934
709
1186
986
1033
1257
1105
1179
1092
1092
1087
2028
2039
2010
754
760
715
855
971
815
915
843
761
1858
2968
4061
3661
3269
2857
2568
2274
1987
683
381
71
1772
3485
5181
4479
3782
3067
2489
1903
1330
736
483
242
1334
2423
3523
2986
2462
1908
1575
1237
904


Summary of computational transaction
Raw Inputview raw input (R code)
Raw Outputview raw output of R engine
Computing time2 seconds
R Server'Gwilym Jenkins' @ 72.249.127.135

\begin{tabular}{lllllllll}
\hline
Summary of computational transaction \tabularnewline
Raw Input & view raw input (R code)  \tabularnewline
Raw Output & view raw output of R engine  \tabularnewline
Computing time & 2 seconds \tabularnewline
R Server & 'Gwilym Jenkins' @ 72.249.127.135 \tabularnewline
\hline
\end{tabular}
%Source: https://freestatistics.org/blog/index.php?pk=63785&T=0

[TABLE]
[ROW][C]Summary of computational transaction[/C][/ROW]
[ROW][C]Raw Input[/C][C]view raw input (R code) [/C][/ROW]
[ROW][C]Raw Output[/C][C]view raw output of R engine [/C][/ROW]
[ROW][C]Computing time[/C][C]2 seconds[/C][/ROW]
[ROW][C]R Server[/C][C]'Gwilym Jenkins' @ 72.249.127.135[/C][/ROW]
[/TABLE]
Source: https://freestatistics.org/blog/index.php?pk=63785&T=0

Globally Unique Identifier (entire table): ba.freestatistics.org/blog/index.php?pk=63785&T=0

As an alternative you can also use a QR Code:  

The GUIDs for individual cells are displayed in the table below:

Summary of computational transaction
Raw Inputview raw input (R code)
Raw Outputview raw output of R engine
Computing time2 seconds
R Server'Gwilym Jenkins' @ 72.249.127.135


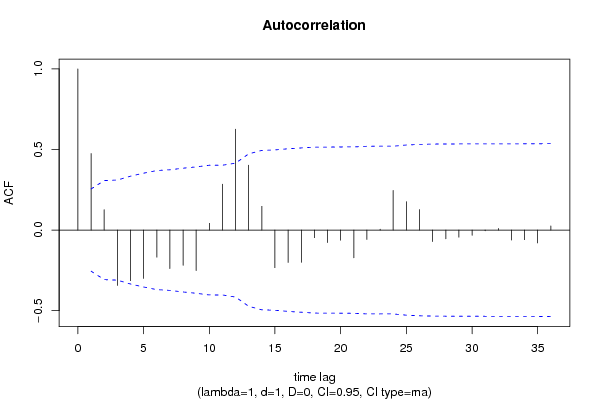
Autocorrelation Function
Time lag kACF(k)T-STATP-value
10.4747513.64660.000282
20.1266310.97270.167344
3-0.343845-2.64110.00528
4-0.31412-2.41280.009478
5-0.300024-2.30450.012365
6-0.167872-1.28950.101137
7-0.238525-1.83210.035989
8-0.218314-1.67690.049426
9-0.250857-1.92690.029408
100.0424410.3260.372791
110.2846192.18620.01639
120.6260384.80875e-06
130.4027043.09320.001512
140.1477761.13510.130465
15-0.23345-1.79320.039036
16-0.200949-1.54350.064026
17-0.199719-1.53410.065179
18-0.046789-0.35940.360291
19-0.077077-0.5920.278044
20-0.063025-0.48410.315052
21-0.172023-1.32130.095746
22-0.057666-0.44290.329714
230.0054070.04150.483506
240.2464031.89270.031656
250.1762451.35380.090487
260.1273310.97810.166021
27-0.07125-0.54730.293124
28-0.054036-0.41510.339802
29-0.043671-0.33540.369239
30-0.032239-0.24760.40264
31-0.004258-0.03270.48701
320.010560.08110.467814
33-0.062251-0.47820.317152
34-0.059509-0.45710.324641
35-0.079946-0.61410.270762
360.0258740.19870.421575

\begin{tabular}{lllllllll}
\hline
Autocorrelation Function \tabularnewline
Time lag k & ACF(k) & T-STAT & P-value \tabularnewline
1 & 0.474751 & 3.6466 & 0.000282 \tabularnewline
2 & 0.126631 & 0.9727 & 0.167344 \tabularnewline
3 & -0.343845 & -2.6411 & 0.00528 \tabularnewline
4 & -0.31412 & -2.4128 & 0.009478 \tabularnewline
5 & -0.300024 & -2.3045 & 0.012365 \tabularnewline
6 & -0.167872 & -1.2895 & 0.101137 \tabularnewline
7 & -0.238525 & -1.8321 & 0.035989 \tabularnewline
8 & -0.218314 & -1.6769 & 0.049426 \tabularnewline
9 & -0.250857 & -1.9269 & 0.029408 \tabularnewline
10 & 0.042441 & 0.326 & 0.372791 \tabularnewline
11 & 0.284619 & 2.1862 & 0.01639 \tabularnewline
12 & 0.626038 & 4.8087 & 5e-06 \tabularnewline
13 & 0.402704 & 3.0932 & 0.001512 \tabularnewline
14 & 0.147776 & 1.1351 & 0.130465 \tabularnewline
15 & -0.23345 & -1.7932 & 0.039036 \tabularnewline
16 & -0.200949 & -1.5435 & 0.064026 \tabularnewline
17 & -0.199719 & -1.5341 & 0.065179 \tabularnewline
18 & -0.046789 & -0.3594 & 0.360291 \tabularnewline
19 & -0.077077 & -0.592 & 0.278044 \tabularnewline
20 & -0.063025 & -0.4841 & 0.315052 \tabularnewline
21 & -0.172023 & -1.3213 & 0.095746 \tabularnewline
22 & -0.057666 & -0.4429 & 0.329714 \tabularnewline
23 & 0.005407 & 0.0415 & 0.483506 \tabularnewline
24 & 0.246403 & 1.8927 & 0.031656 \tabularnewline
25 & 0.176245 & 1.3538 & 0.090487 \tabularnewline
26 & 0.127331 & 0.9781 & 0.166021 \tabularnewline
27 & -0.07125 & -0.5473 & 0.293124 \tabularnewline
28 & -0.054036 & -0.4151 & 0.339802 \tabularnewline
29 & -0.043671 & -0.3354 & 0.369239 \tabularnewline
30 & -0.032239 & -0.2476 & 0.40264 \tabularnewline
31 & -0.004258 & -0.0327 & 0.48701 \tabularnewline
32 & 0.01056 & 0.0811 & 0.467814 \tabularnewline
33 & -0.062251 & -0.4782 & 0.317152 \tabularnewline
34 & -0.059509 & -0.4571 & 0.324641 \tabularnewline
35 & -0.079946 & -0.6141 & 0.270762 \tabularnewline
36 & 0.025874 & 0.1987 & 0.421575 \tabularnewline
\hline
\end{tabular}
%Source: https://freestatistics.org/blog/index.php?pk=63785&T=1

[TABLE]
[ROW][C]Autocorrelation Function[/C][/ROW]
[ROW][C]Time lag k[/C][C]ACF(k)[/C][C]T-STAT[/C][C]P-value[/C][/ROW]
[ROW][C]1[/C][C]0.474751[/C][C]3.6466[/C][C]0.000282[/C][/ROW]
[ROW][C]2[/C][C]0.126631[/C][C]0.9727[/C][C]0.167344[/C][/ROW]
[ROW][C]3[/C][C]-0.343845[/C][C]-2.6411[/C][C]0.00528[/C][/ROW]
[ROW][C]4[/C][C]-0.31412[/C][C]-2.4128[/C][C]0.009478[/C][/ROW]
[ROW][C]5[/C][C]-0.300024[/C][C]-2.3045[/C][C]0.012365[/C][/ROW]
[ROW][C]6[/C][C]-0.167872[/C][C]-1.2895[/C][C]0.101137[/C][/ROW]
[ROW][C]7[/C][C]-0.238525[/C][C]-1.8321[/C][C]0.035989[/C][/ROW]
[ROW][C]8[/C][C]-0.218314[/C][C]-1.6769[/C][C]0.049426[/C][/ROW]
[ROW][C]9[/C][C]-0.250857[/C][C]-1.9269[/C][C]0.029408[/C][/ROW]
[ROW][C]10[/C][C]0.042441[/C][C]0.326[/C][C]0.372791[/C][/ROW]
[ROW][C]11[/C][C]0.284619[/C][C]2.1862[/C][C]0.01639[/C][/ROW]
[ROW][C]12[/C][C]0.626038[/C][C]4.8087[/C][C]5e-06[/C][/ROW]
[ROW][C]13[/C][C]0.402704[/C][C]3.0932[/C][C]0.001512[/C][/ROW]
[ROW][C]14[/C][C]0.147776[/C][C]1.1351[/C][C]0.130465[/C][/ROW]
[ROW][C]15[/C][C]-0.23345[/C][C]-1.7932[/C][C]0.039036[/C][/ROW]
[ROW][C]16[/C][C]-0.200949[/C][C]-1.5435[/C][C]0.064026[/C][/ROW]
[ROW][C]17[/C][C]-0.199719[/C][C]-1.5341[/C][C]0.065179[/C][/ROW]
[ROW][C]18[/C][C]-0.046789[/C][C]-0.3594[/C][C]0.360291[/C][/ROW]
[ROW][C]19[/C][C]-0.077077[/C][C]-0.592[/C][C]0.278044[/C][/ROW]
[ROW][C]20[/C][C]-0.063025[/C][C]-0.4841[/C][C]0.315052[/C][/ROW]
[ROW][C]21[/C][C]-0.172023[/C][C]-1.3213[/C][C]0.095746[/C][/ROW]
[ROW][C]22[/C][C]-0.057666[/C][C]-0.4429[/C][C]0.329714[/C][/ROW]
[ROW][C]23[/C][C]0.005407[/C][C]0.0415[/C][C]0.483506[/C][/ROW]
[ROW][C]24[/C][C]0.246403[/C][C]1.8927[/C][C]0.031656[/C][/ROW]
[ROW][C]25[/C][C]0.176245[/C][C]1.3538[/C][C]0.090487[/C][/ROW]
[ROW][C]26[/C][C]0.127331[/C][C]0.9781[/C][C]0.166021[/C][/ROW]
[ROW][C]27[/C][C]-0.07125[/C][C]-0.5473[/C][C]0.293124[/C][/ROW]
[ROW][C]28[/C][C]-0.054036[/C][C]-0.4151[/C][C]0.339802[/C][/ROW]
[ROW][C]29[/C][C]-0.043671[/C][C]-0.3354[/C][C]0.369239[/C][/ROW]
[ROW][C]30[/C][C]-0.032239[/C][C]-0.2476[/C][C]0.40264[/C][/ROW]
[ROW][C]31[/C][C]-0.004258[/C][C]-0.0327[/C][C]0.48701[/C][/ROW]
[ROW][C]32[/C][C]0.01056[/C][C]0.0811[/C][C]0.467814[/C][/ROW]
[ROW][C]33[/C][C]-0.062251[/C][C]-0.4782[/C][C]0.317152[/C][/ROW]
[ROW][C]34[/C][C]-0.059509[/C][C]-0.4571[/C][C]0.324641[/C][/ROW]
[ROW][C]35[/C][C]-0.079946[/C][C]-0.6141[/C][C]0.270762[/C][/ROW]
[ROW][C]36[/C][C]0.025874[/C][C]0.1987[/C][C]0.421575[/C][/ROW]
[/TABLE]
Source: https://freestatistics.org/blog/index.php?pk=63785&T=1

Globally Unique Identifier (entire table): ba.freestatistics.org/blog/index.php?pk=63785&T=1

As an alternative you can also use a QR Code:  

The GUIDs for individual cells are displayed in the table below:

Autocorrelation Function
Time lag kACF(k)T-STATP-value
10.4747513.64660.000282
20.1266310.97270.167344
3-0.343845-2.64110.00528
4-0.31412-2.41280.009478
5-0.300024-2.30450.012365
6-0.167872-1.28950.101137
7-0.238525-1.83210.035989
8-0.218314-1.67690.049426
9-0.250857-1.92690.029408
100.0424410.3260.372791
110.2846192.18620.01639
120.6260384.80875e-06
130.4027043.09320.001512
140.1477761.13510.130465
15-0.23345-1.79320.039036
16-0.200949-1.54350.064026
17-0.199719-1.53410.065179
18-0.046789-0.35940.360291
19-0.077077-0.5920.278044
20-0.063025-0.48410.315052
21-0.172023-1.32130.095746
22-0.057666-0.44290.329714
230.0054070.04150.483506
240.2464031.89270.031656
250.1762451.35380.090487
260.1273310.97810.166021
27-0.07125-0.54730.293124
28-0.054036-0.41510.339802
29-0.043671-0.33540.369239
30-0.032239-0.24760.40264
31-0.004258-0.03270.48701
320.010560.08110.467814
33-0.062251-0.47820.317152
34-0.059509-0.45710.324641
35-0.079946-0.61410.270762
360.0258740.19870.421575


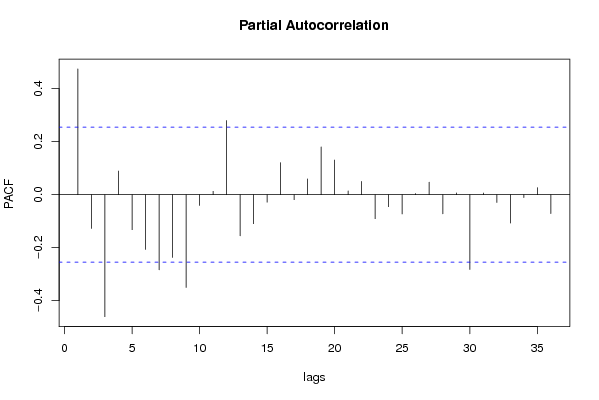
Partial Autocorrelation Function
Time lag kPACF(k)T-STATP-value
10.4747513.64660.000282
2-0.127493-0.97930.165717
3-0.460749-3.53910.000395
40.0889450.68320.248578
5-0.132081-1.01450.157235
6-0.207045-1.59030.058551
7-0.283866-2.18040.016614
8-0.236934-1.81990.036922
9-0.350231-2.69020.004637
10-0.040805-0.31340.377531
110.0124690.09580.462013
120.2799212.15010.017828
13-0.15567-1.19570.118294
14-0.109721-0.84280.201376
15-0.028652-0.22010.413283
160.1209240.92880.178379
17-0.019076-0.14650.442002
180.0595710.45760.324471
190.1802131.38420.085749
200.1305431.00270.160046
210.0138630.10650.45778
220.0496960.38170.352018
23-0.090874-0.6980.243953
24-0.045229-0.34740.36476
25-0.072828-0.55940.289002
260.0040380.0310.48768
270.0470550.36140.359533
28-0.072517-0.5570.289813
290.006410.04920.480448
30-0.282204-2.16760.017116
310.0059290.04550.481914
32-0.029335-0.22530.411252
33-0.107495-0.82570.206155
34-0.010839-0.08330.466964
350.0262360.20150.420493
36-0.071621-0.55010.292152

\begin{tabular}{lllllllll}
\hline
Partial Autocorrelation Function \tabularnewline
Time lag k & PACF(k) & T-STAT & P-value \tabularnewline
1 & 0.474751 & 3.6466 & 0.000282 \tabularnewline
2 & -0.127493 & -0.9793 & 0.165717 \tabularnewline
3 & -0.460749 & -3.5391 & 0.000395 \tabularnewline
4 & 0.088945 & 0.6832 & 0.248578 \tabularnewline
5 & -0.132081 & -1.0145 & 0.157235 \tabularnewline
6 & -0.207045 & -1.5903 & 0.058551 \tabularnewline
7 & -0.283866 & -2.1804 & 0.016614 \tabularnewline
8 & -0.236934 & -1.8199 & 0.036922 \tabularnewline
9 & -0.350231 & -2.6902 & 0.004637 \tabularnewline
10 & -0.040805 & -0.3134 & 0.377531 \tabularnewline
11 & 0.012469 & 0.0958 & 0.462013 \tabularnewline
12 & 0.279921 & 2.1501 & 0.017828 \tabularnewline
13 & -0.15567 & -1.1957 & 0.118294 \tabularnewline
14 & -0.109721 & -0.8428 & 0.201376 \tabularnewline
15 & -0.028652 & -0.2201 & 0.413283 \tabularnewline
16 & 0.120924 & 0.9288 & 0.178379 \tabularnewline
17 & -0.019076 & -0.1465 & 0.442002 \tabularnewline
18 & 0.059571 & 0.4576 & 0.324471 \tabularnewline
19 & 0.180213 & 1.3842 & 0.085749 \tabularnewline
20 & 0.130543 & 1.0027 & 0.160046 \tabularnewline
21 & 0.013863 & 0.1065 & 0.45778 \tabularnewline
22 & 0.049696 & 0.3817 & 0.352018 \tabularnewline
23 & -0.090874 & -0.698 & 0.243953 \tabularnewline
24 & -0.045229 & -0.3474 & 0.36476 \tabularnewline
25 & -0.072828 & -0.5594 & 0.289002 \tabularnewline
26 & 0.004038 & 0.031 & 0.48768 \tabularnewline
27 & 0.047055 & 0.3614 & 0.359533 \tabularnewline
28 & -0.072517 & -0.557 & 0.289813 \tabularnewline
29 & 0.00641 & 0.0492 & 0.480448 \tabularnewline
30 & -0.282204 & -2.1676 & 0.017116 \tabularnewline
31 & 0.005929 & 0.0455 & 0.481914 \tabularnewline
32 & -0.029335 & -0.2253 & 0.411252 \tabularnewline
33 & -0.107495 & -0.8257 & 0.206155 \tabularnewline
34 & -0.010839 & -0.0833 & 0.466964 \tabularnewline
35 & 0.026236 & 0.2015 & 0.420493 \tabularnewline
36 & -0.071621 & -0.5501 & 0.292152 \tabularnewline
\hline
\end{tabular}
%Source: https://freestatistics.org/blog/index.php?pk=63785&T=2

[TABLE]
[ROW][C]Partial Autocorrelation Function[/C][/ROW]
[ROW][C]Time lag k[/C][C]PACF(k)[/C][C]T-STAT[/C][C]P-value[/C][/ROW]
[ROW][C]1[/C][C]0.474751[/C][C]3.6466[/C][C]0.000282[/C][/ROW]
[ROW][C]2[/C][C]-0.127493[/C][C]-0.9793[/C][C]0.165717[/C][/ROW]
[ROW][C]3[/C][C]-0.460749[/C][C]-3.5391[/C][C]0.000395[/C][/ROW]
[ROW][C]4[/C][C]0.088945[/C][C]0.6832[/C][C]0.248578[/C][/ROW]
[ROW][C]5[/C][C]-0.132081[/C][C]-1.0145[/C][C]0.157235[/C][/ROW]
[ROW][C]6[/C][C]-0.207045[/C][C]-1.5903[/C][C]0.058551[/C][/ROW]
[ROW][C]7[/C][C]-0.283866[/C][C]-2.1804[/C][C]0.016614[/C][/ROW]
[ROW][C]8[/C][C]-0.236934[/C][C]-1.8199[/C][C]0.036922[/C][/ROW]
[ROW][C]9[/C][C]-0.350231[/C][C]-2.6902[/C][C]0.004637[/C][/ROW]
[ROW][C]10[/C][C]-0.040805[/C][C]-0.3134[/C][C]0.377531[/C][/ROW]
[ROW][C]11[/C][C]0.012469[/C][C]0.0958[/C][C]0.462013[/C][/ROW]
[ROW][C]12[/C][C]0.279921[/C][C]2.1501[/C][C]0.017828[/C][/ROW]
[ROW][C]13[/C][C]-0.15567[/C][C]-1.1957[/C][C]0.118294[/C][/ROW]
[ROW][C]14[/C][C]-0.109721[/C][C]-0.8428[/C][C]0.201376[/C][/ROW]
[ROW][C]15[/C][C]-0.028652[/C][C]-0.2201[/C][C]0.413283[/C][/ROW]
[ROW][C]16[/C][C]0.120924[/C][C]0.9288[/C][C]0.178379[/C][/ROW]
[ROW][C]17[/C][C]-0.019076[/C][C]-0.1465[/C][C]0.442002[/C][/ROW]
[ROW][C]18[/C][C]0.059571[/C][C]0.4576[/C][C]0.324471[/C][/ROW]
[ROW][C]19[/C][C]0.180213[/C][C]1.3842[/C][C]0.085749[/C][/ROW]
[ROW][C]20[/C][C]0.130543[/C][C]1.0027[/C][C]0.160046[/C][/ROW]
[ROW][C]21[/C][C]0.013863[/C][C]0.1065[/C][C]0.45778[/C][/ROW]
[ROW][C]22[/C][C]0.049696[/C][C]0.3817[/C][C]0.352018[/C][/ROW]
[ROW][C]23[/C][C]-0.090874[/C][C]-0.698[/C][C]0.243953[/C][/ROW]
[ROW][C]24[/C][C]-0.045229[/C][C]-0.3474[/C][C]0.36476[/C][/ROW]
[ROW][C]25[/C][C]-0.072828[/C][C]-0.5594[/C][C]0.289002[/C][/ROW]
[ROW][C]26[/C][C]0.004038[/C][C]0.031[/C][C]0.48768[/C][/ROW]
[ROW][C]27[/C][C]0.047055[/C][C]0.3614[/C][C]0.359533[/C][/ROW]
[ROW][C]28[/C][C]-0.072517[/C][C]-0.557[/C][C]0.289813[/C][/ROW]
[ROW][C]29[/C][C]0.00641[/C][C]0.0492[/C][C]0.480448[/C][/ROW]
[ROW][C]30[/C][C]-0.282204[/C][C]-2.1676[/C][C]0.017116[/C][/ROW]
[ROW][C]31[/C][C]0.005929[/C][C]0.0455[/C][C]0.481914[/C][/ROW]
[ROW][C]32[/C][C]-0.029335[/C][C]-0.2253[/C][C]0.411252[/C][/ROW]
[ROW][C]33[/C][C]-0.107495[/C][C]-0.8257[/C][C]0.206155[/C][/ROW]
[ROW][C]34[/C][C]-0.010839[/C][C]-0.0833[/C][C]0.466964[/C][/ROW]
[ROW][C]35[/C][C]0.026236[/C][C]0.2015[/C][C]0.420493[/C][/ROW]
[ROW][C]36[/C][C]-0.071621[/C][C]-0.5501[/C][C]0.292152[/C][/ROW]
[/TABLE]
Source: https://freestatistics.org/blog/index.php?pk=63785&T=2

Globally Unique Identifier (entire table): ba.freestatistics.org/blog/index.php?pk=63785&T=2

As an alternative you can also use a QR Code:  

The GUIDs for individual cells are displayed in the table below:

Partial Autocorrelation Function
Time lag kPACF(k)T-STATP-value
10.4747513.64660.000282
2-0.127493-0.97930.165717
3-0.460749-3.53910.000395
40.0889450.68320.248578
5-0.132081-1.01450.157235
6-0.207045-1.59030.058551
7-0.283866-2.18040.016614
8-0.236934-1.81990.036922
9-0.350231-2.69020.004637
10-0.040805-0.31340.377531
110.0124690.09580.462013
120.2799212.15010.017828
13-0.15567-1.19570.118294
14-0.109721-0.84280.201376
15-0.028652-0.22010.413283
160.1209240.92880.178379
17-0.019076-0.14650.442002
180.0595710.45760.324471
190.1802131.38420.085749
200.1305431.00270.160046
210.0138630.10650.45778
220.0496960.38170.352018
23-0.090874-0.6980.243953
24-0.045229-0.34740.36476
25-0.072828-0.55940.289002
260.0040380.0310.48768
270.0470550.36140.359533
28-0.072517-0.5570.289813
290.006410.04920.480448
30-0.282204-2.16760.017116
310.0059290.04550.481914
32-0.029335-0.22530.411252
33-0.107495-0.82570.206155
34-0.010839-0.08330.466964
350.0262360.20150.420493
36-0.071621-0.55010.292152


Parameters (Session):
par1 = 36 ; par2 = 1 ; par3 = 1 ; par4 = 0 ; par5 = 12 ; par6 = MA ; par7 = 0.95 ;
Parameters (R input):
par1 = 36 ; par2 = 1 ; par3 = 1 ; par4 = 0 ; par5 = 12 ; par6 = MA ; par7 = 0.95 ;
R code (references can be found in the software module):
if (par1 == 'Default') {
par1 = 10*log10(length(x))
} else {
par1 <- as.numeric(par1)
}
par2 <- as.numeric(par2)
par3 <- as.numeric(par3)
par4 <- as.numeric(par4)
par5 <- as.numeric(par5)
if (par6 == 'White Noise') par6 <- 'white' else par6 <- 'ma'
par7 <- as.numeric(par7)
if (par2 == 0) {
x <- log(x)
} else {
x <- (x ^ par2 - 1) / par2
}
if (par3 > 0) x <- diff(x,lag=1,difference=par3)
if (par4 > 0) x <- diff(x,lag=par5,difference=par4)
bitmap(file='pic1.png')
racf <- acf(x, par1, main='Autocorrelation', xlab='time lag', ylab='ACF', ci.type=par6, ci=par7, sub=paste('(lambda=',par2,', d=',par3,', D=',par4,', CI=', par7, ', CI type=',par6,')',sep=''))
dev.off()
bitmap(file='pic2.png')
rpacf <- pacf(x,par1,main='Partial Autocorrelation',xlab='lags',ylab='PACF')
dev.off()
(myacf <- c(racf$acf))
(mypacf <- c(rpacf$acf))
lengthx <- length(x)
sqrtn <- sqrt(lengthx)
load(file='createtable')
a<-table.start()
a<-table.row.start(a)
a<-table.element(a,'Autocorrelation Function',4,TRUE)
a<-table.row.end(a)
a<-table.row.start(a)
a<-table.element(a,'Time lag k',header=TRUE)
a<-table.element(a,hyperlink('basics.htm','ACF(k)','click here for more information about the Autocorrelation Function'),header=TRUE)
a<-table.element(a,'T-STAT',header=TRUE)
a<-table.element(a,'P-value',header=TRUE)
a<-table.row.end(a)
for (i in 2:(par1+1)) {
a<-table.row.start(a)
a<-table.element(a,i-1,header=TRUE)
a<-table.element(a,round(myacf[i],6))
mytstat <- myacf[i]*sqrtn
a<-table.element(a,round(mytstat,4))
a<-table.element(a,round(1-pt(abs(mytstat),lengthx),6))
a<-table.row.end(a)
}
a<-table.end(a)
table.save(a,file='mytable.tab')
a<-table.start()
a<-table.row.start(a)
a<-table.element(a,'Partial Autocorrelation Function',4,TRUE)
a<-table.row.end(a)
a<-table.row.start(a)
a<-table.element(a,'Time lag k',header=TRUE)
a<-table.element(a,hyperlink('basics.htm','PACF(k)','click here for more information about the Partial Autocorrelation Function'),header=TRUE)
a<-table.element(a,'T-STAT',header=TRUE)
a<-table.element(a,'P-value',header=TRUE)
a<-table.row.end(a)
for (i in 1:par1) {
a<-table.row.start(a)
a<-table.element(a,i,header=TRUE)
a<-table.element(a,round(mypacf[i],6))
mytstat <- mypacf[i]*sqrtn
a<-table.element(a,round(mytstat,4))
a<-table.element(a,round(1-pt(abs(mytstat),lengthx),6))
a<-table.row.end(a)
}
a<-table.end(a)
table.save(a,file='mytable1.tab')