Free Statistics

of Irreproducible Research!

Author's title

Author*The author of this computation has been verified*
R Software Modulerwasp_autocorrelation.wasp
Title produced by software(Partial) Autocorrelation Function
Date of computationFri, 04 Dec 2009 08:41:11 -0700
Cite this page as followsStatistical Computations at FreeStatistics.org, Office for Research Development and Education, URL https://freestatistics.org/blog/index.php?v=date/2009/Dec/04/t1259941321b5izr5rv9ir64lb.htm/, Retrieved Sun, 28 Apr 2024 00:07:01 +0000
Statistical Computations at FreeStatistics.org, Office for Research Development and Education, URL https://freestatistics.org/blog/index.php?pk=63787, Retrieved Sun, 28 Apr 2024 00:07:01 +0000
QR Codes:

Original text written by user:
IsPrivate?No (this computation is public)
User-defined keywords
Estimated Impact133
Family? (F = Feedback message, R = changed R code, M = changed R Module, P = changed Parameters, D = changed Data)
-     [Univariate Data Series] [data set] [2008-12-01 19:54:57] [b98453cac15ba1066b407e146608df68]
- RMP   [(Partial) Autocorrelation Function] [] [2009-11-27 14:48:46] [b98453cac15ba1066b407e146608df68]
-    D      [(Partial) Autocorrelation Function] [] [2009-12-04 15:41:11] [c88a5f1b97e332c6387d668c465455af] [Current]
-    D        [(Partial) Autocorrelation Function] [] [2009-12-16 17:36:11] [73863f7f907331e734eff34b7de6fc83]
Feedback Forum

Post a new message
Dataseries X:
1258
1199
1158
1427
934
709
1186
986
1033
1257
1105
1179
1092
1092
1087
2028
2039
2010
754
760
715
855
971
815
915
843
761
1858
2968
4061
3661
3269
2857
2568
2274
1987
683
381
71
1772
3485
5181
4479
3782
3067
2489
1903
1330
736
483
242
1334
2423
3523
2986
2462
1908
1575
1237
904


Summary of computational transaction
Raw Inputview raw input (R code)
Raw Outputview raw output of R engine
Computing time1 seconds
R Server'Gwilym Jenkins' @ 72.249.127.135

\begin{tabular}{lllllllll}
\hline
Summary of computational transaction \tabularnewline
Raw Input & view raw input (R code)  \tabularnewline
Raw Output & view raw output of R engine  \tabularnewline
Computing time & 1 seconds \tabularnewline
R Server & 'Gwilym Jenkins' @ 72.249.127.135 \tabularnewline
\hline
\end{tabular}
%Source: https://freestatistics.org/blog/index.php?pk=63787&T=0

[TABLE]
[ROW][C]Summary of computational transaction[/C][/ROW]
[ROW][C]Raw Input[/C][C]view raw input (R code) [/C][/ROW]
[ROW][C]Raw Output[/C][C]view raw output of R engine [/C][/ROW]
[ROW][C]Computing time[/C][C]1 seconds[/C][/ROW]
[ROW][C]R Server[/C][C]'Gwilym Jenkins' @ 72.249.127.135[/C][/ROW]
[/TABLE]
Source: https://freestatistics.org/blog/index.php?pk=63787&T=0

Globally Unique Identifier (entire table): ba.freestatistics.org/blog/index.php?pk=63787&T=0

As an alternative you can also use a QR Code:  

The GUIDs for individual cells are displayed in the table below:

Summary of computational transaction
Raw Inputview raw input (R code)
Raw Outputview raw output of R engine
Computing time1 seconds
R Server'Gwilym Jenkins' @ 72.249.127.135


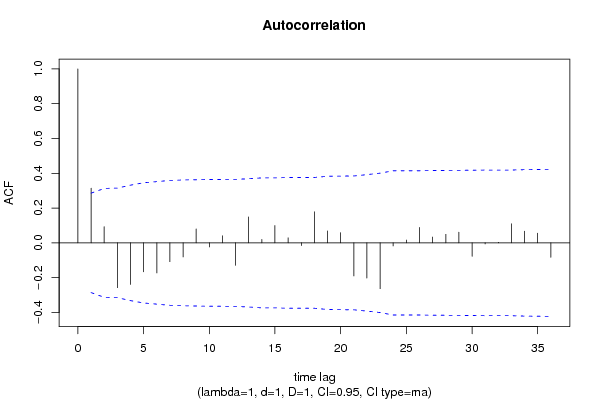
Autocorrelation Function
Time lag kACF(k)T-STATP-value
10.3147482.15780.018043
20.0933290.63980.262695
3-0.257607-1.76610.04194
4-0.239008-1.63860.053992
5-0.166732-1.14310.129402
6-0.172813-1.18470.121037
7-0.108032-0.74060.231302
8-0.081022-0.55550.290608
90.0800440.54880.292885
10-0.02305-0.1580.437557
110.040850.28010.390333
12-0.129157-0.88550.190209
130.1492741.02340.155686
140.0198480.13610.446174
150.0998890.68480.248416
160.0288520.19780.422029
17-0.015592-0.10690.457665
180.1788431.22610.113137
190.0685530.470.320273
200.0585930.40170.344866
21-0.18985-1.30150.099707
22-0.202511-1.38830.085789
23-0.263176-1.80420.038802
24-0.017624-0.12080.452172
250.0161880.1110.456053
260.0886390.60770.273163
270.0337370.23130.409048
280.0495120.33940.367896
290.0614910.42160.337633
30-0.077332-0.53020.299248
31-0.006226-0.04270.483068
320.0031440.02160.491446
330.1094540.75040.228383
340.0670270.45950.323993
350.0560090.3840.351362
36-0.082758-0.56740.286586

\begin{tabular}{lllllllll}
\hline
Autocorrelation Function \tabularnewline
Time lag k & ACF(k) & T-STAT & P-value \tabularnewline
1 & 0.314748 & 2.1578 & 0.018043 \tabularnewline
2 & 0.093329 & 0.6398 & 0.262695 \tabularnewline
3 & -0.257607 & -1.7661 & 0.04194 \tabularnewline
4 & -0.239008 & -1.6386 & 0.053992 \tabularnewline
5 & -0.166732 & -1.1431 & 0.129402 \tabularnewline
6 & -0.172813 & -1.1847 & 0.121037 \tabularnewline
7 & -0.108032 & -0.7406 & 0.231302 \tabularnewline
8 & -0.081022 & -0.5555 & 0.290608 \tabularnewline
9 & 0.080044 & 0.5488 & 0.292885 \tabularnewline
10 & -0.02305 & -0.158 & 0.437557 \tabularnewline
11 & 0.04085 & 0.2801 & 0.390333 \tabularnewline
12 & -0.129157 & -0.8855 & 0.190209 \tabularnewline
13 & 0.149274 & 1.0234 & 0.155686 \tabularnewline
14 & 0.019848 & 0.1361 & 0.446174 \tabularnewline
15 & 0.099889 & 0.6848 & 0.248416 \tabularnewline
16 & 0.028852 & 0.1978 & 0.422029 \tabularnewline
17 & -0.015592 & -0.1069 & 0.457665 \tabularnewline
18 & 0.178843 & 1.2261 & 0.113137 \tabularnewline
19 & 0.068553 & 0.47 & 0.320273 \tabularnewline
20 & 0.058593 & 0.4017 & 0.344866 \tabularnewline
21 & -0.18985 & -1.3015 & 0.099707 \tabularnewline
22 & -0.202511 & -1.3883 & 0.085789 \tabularnewline
23 & -0.263176 & -1.8042 & 0.038802 \tabularnewline
24 & -0.017624 & -0.1208 & 0.452172 \tabularnewline
25 & 0.016188 & 0.111 & 0.456053 \tabularnewline
26 & 0.088639 & 0.6077 & 0.273163 \tabularnewline
27 & 0.033737 & 0.2313 & 0.409048 \tabularnewline
28 & 0.049512 & 0.3394 & 0.367896 \tabularnewline
29 & 0.061491 & 0.4216 & 0.337633 \tabularnewline
30 & -0.077332 & -0.5302 & 0.299248 \tabularnewline
31 & -0.006226 & -0.0427 & 0.483068 \tabularnewline
32 & 0.003144 & 0.0216 & 0.491446 \tabularnewline
33 & 0.109454 & 0.7504 & 0.228383 \tabularnewline
34 & 0.067027 & 0.4595 & 0.323993 \tabularnewline
35 & 0.056009 & 0.384 & 0.351362 \tabularnewline
36 & -0.082758 & -0.5674 & 0.286586 \tabularnewline
\hline
\end{tabular}
%Source: https://freestatistics.org/blog/index.php?pk=63787&T=1

[TABLE]
[ROW][C]Autocorrelation Function[/C][/ROW]
[ROW][C]Time lag k[/C][C]ACF(k)[/C][C]T-STAT[/C][C]P-value[/C][/ROW]
[ROW][C]1[/C][C]0.314748[/C][C]2.1578[/C][C]0.018043[/C][/ROW]
[ROW][C]2[/C][C]0.093329[/C][C]0.6398[/C][C]0.262695[/C][/ROW]
[ROW][C]3[/C][C]-0.257607[/C][C]-1.7661[/C][C]0.04194[/C][/ROW]
[ROW][C]4[/C][C]-0.239008[/C][C]-1.6386[/C][C]0.053992[/C][/ROW]
[ROW][C]5[/C][C]-0.166732[/C][C]-1.1431[/C][C]0.129402[/C][/ROW]
[ROW][C]6[/C][C]-0.172813[/C][C]-1.1847[/C][C]0.121037[/C][/ROW]
[ROW][C]7[/C][C]-0.108032[/C][C]-0.7406[/C][C]0.231302[/C][/ROW]
[ROW][C]8[/C][C]-0.081022[/C][C]-0.5555[/C][C]0.290608[/C][/ROW]
[ROW][C]9[/C][C]0.080044[/C][C]0.5488[/C][C]0.292885[/C][/ROW]
[ROW][C]10[/C][C]-0.02305[/C][C]-0.158[/C][C]0.437557[/C][/ROW]
[ROW][C]11[/C][C]0.04085[/C][C]0.2801[/C][C]0.390333[/C][/ROW]
[ROW][C]12[/C][C]-0.129157[/C][C]-0.8855[/C][C]0.190209[/C][/ROW]
[ROW][C]13[/C][C]0.149274[/C][C]1.0234[/C][C]0.155686[/C][/ROW]
[ROW][C]14[/C][C]0.019848[/C][C]0.1361[/C][C]0.446174[/C][/ROW]
[ROW][C]15[/C][C]0.099889[/C][C]0.6848[/C][C]0.248416[/C][/ROW]
[ROW][C]16[/C][C]0.028852[/C][C]0.1978[/C][C]0.422029[/C][/ROW]
[ROW][C]17[/C][C]-0.015592[/C][C]-0.1069[/C][C]0.457665[/C][/ROW]
[ROW][C]18[/C][C]0.178843[/C][C]1.2261[/C][C]0.113137[/C][/ROW]
[ROW][C]19[/C][C]0.068553[/C][C]0.47[/C][C]0.320273[/C][/ROW]
[ROW][C]20[/C][C]0.058593[/C][C]0.4017[/C][C]0.344866[/C][/ROW]
[ROW][C]21[/C][C]-0.18985[/C][C]-1.3015[/C][C]0.099707[/C][/ROW]
[ROW][C]22[/C][C]-0.202511[/C][C]-1.3883[/C][C]0.085789[/C][/ROW]
[ROW][C]23[/C][C]-0.263176[/C][C]-1.8042[/C][C]0.038802[/C][/ROW]
[ROW][C]24[/C][C]-0.017624[/C][C]-0.1208[/C][C]0.452172[/C][/ROW]
[ROW][C]25[/C][C]0.016188[/C][C]0.111[/C][C]0.456053[/C][/ROW]
[ROW][C]26[/C][C]0.088639[/C][C]0.6077[/C][C]0.273163[/C][/ROW]
[ROW][C]27[/C][C]0.033737[/C][C]0.2313[/C][C]0.409048[/C][/ROW]
[ROW][C]28[/C][C]0.049512[/C][C]0.3394[/C][C]0.367896[/C][/ROW]
[ROW][C]29[/C][C]0.061491[/C][C]0.4216[/C][C]0.337633[/C][/ROW]
[ROW][C]30[/C][C]-0.077332[/C][C]-0.5302[/C][C]0.299248[/C][/ROW]
[ROW][C]31[/C][C]-0.006226[/C][C]-0.0427[/C][C]0.483068[/C][/ROW]
[ROW][C]32[/C][C]0.003144[/C][C]0.0216[/C][C]0.491446[/C][/ROW]
[ROW][C]33[/C][C]0.109454[/C][C]0.7504[/C][C]0.228383[/C][/ROW]
[ROW][C]34[/C][C]0.067027[/C][C]0.4595[/C][C]0.323993[/C][/ROW]
[ROW][C]35[/C][C]0.056009[/C][C]0.384[/C][C]0.351362[/C][/ROW]
[ROW][C]36[/C][C]-0.082758[/C][C]-0.5674[/C][C]0.286586[/C][/ROW]
[/TABLE]
Source: https://freestatistics.org/blog/index.php?pk=63787&T=1

Globally Unique Identifier (entire table): ba.freestatistics.org/blog/index.php?pk=63787&T=1

As an alternative you can also use a QR Code:  

The GUIDs for individual cells are displayed in the table below:

Autocorrelation Function
Time lag kACF(k)T-STATP-value
10.3147482.15780.018043
20.0933290.63980.262695
3-0.257607-1.76610.04194
4-0.239008-1.63860.053992
5-0.166732-1.14310.129402
6-0.172813-1.18470.121037
7-0.108032-0.74060.231302
8-0.081022-0.55550.290608
90.0800440.54880.292885
10-0.02305-0.1580.437557
110.040850.28010.390333
12-0.129157-0.88550.190209
130.1492741.02340.155686
140.0198480.13610.446174
150.0998890.68480.248416
160.0288520.19780.422029
17-0.015592-0.10690.457665
180.1788431.22610.113137
190.0685530.470.320273
200.0585930.40170.344866
21-0.18985-1.30150.099707
22-0.202511-1.38830.085789
23-0.263176-1.80420.038802
24-0.017624-0.12080.452172
250.0161880.1110.456053
260.0886390.60770.273163
270.0337370.23130.409048
280.0495120.33940.367896
290.0614910.42160.337633
30-0.077332-0.53020.299248
31-0.006226-0.04270.483068
320.0031440.02160.491446
330.1094540.75040.228383
340.0670270.45950.323993
350.0560090.3840.351362
36-0.082758-0.56740.286586


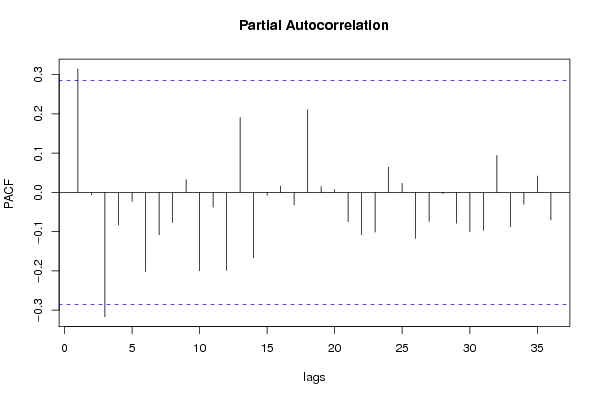
Partial Autocorrelation Function
Time lag kPACF(k)T-STATP-value
10.3147482.15780.018043
2-0.006368-0.04370.48268
3-0.316534-2.170.017545
4-0.082731-0.56720.286648
5-0.022887-0.15690.437996
6-0.201618-1.38220.086718
7-0.107836-0.73930.231704
8-0.07688-0.52710.300314
90.0325150.22290.412286
10-0.199517-1.36780.088937
11-0.037422-0.25660.399322
12-0.198397-1.36010.090137
130.1908731.30860.098523
14-0.166528-1.14170.129689
15-0.007156-0.04910.48054
160.0163830.11230.455526
17-0.031783-0.21790.414228
180.2105281.44330.077783
190.015150.10390.458861
200.0076530.05250.479191
21-0.074379-0.50990.306249
22-0.107756-0.73870.231871
23-0.100831-0.69130.2464
240.0643150.44090.330645
250.0230740.15820.437493
26-0.116784-0.80060.213687
27-0.073749-0.50560.307751
28-0.003107-0.02130.491548
29-0.078473-0.5380.296563
30-0.100001-0.68560.248176
31-0.096591-0.66220.255541
320.0942760.64630.260606
33-0.087146-0.59740.276541
34-0.030146-0.20670.418579
350.0416370.28550.388276
36-0.07018-0.48110.316328

\begin{tabular}{lllllllll}
\hline
Partial Autocorrelation Function \tabularnewline
Time lag k & PACF(k) & T-STAT & P-value \tabularnewline
1 & 0.314748 & 2.1578 & 0.018043 \tabularnewline
2 & -0.006368 & -0.0437 & 0.48268 \tabularnewline
3 & -0.316534 & -2.17 & 0.017545 \tabularnewline
4 & -0.082731 & -0.5672 & 0.286648 \tabularnewline
5 & -0.022887 & -0.1569 & 0.437996 \tabularnewline
6 & -0.201618 & -1.3822 & 0.086718 \tabularnewline
7 & -0.107836 & -0.7393 & 0.231704 \tabularnewline
8 & -0.07688 & -0.5271 & 0.300314 \tabularnewline
9 & 0.032515 & 0.2229 & 0.412286 \tabularnewline
10 & -0.199517 & -1.3678 & 0.088937 \tabularnewline
11 & -0.037422 & -0.2566 & 0.399322 \tabularnewline
12 & -0.198397 & -1.3601 & 0.090137 \tabularnewline
13 & 0.190873 & 1.3086 & 0.098523 \tabularnewline
14 & -0.166528 & -1.1417 & 0.129689 \tabularnewline
15 & -0.007156 & -0.0491 & 0.48054 \tabularnewline
16 & 0.016383 & 0.1123 & 0.455526 \tabularnewline
17 & -0.031783 & -0.2179 & 0.414228 \tabularnewline
18 & 0.210528 & 1.4433 & 0.077783 \tabularnewline
19 & 0.01515 & 0.1039 & 0.458861 \tabularnewline
20 & 0.007653 & 0.0525 & 0.479191 \tabularnewline
21 & -0.074379 & -0.5099 & 0.306249 \tabularnewline
22 & -0.107756 & -0.7387 & 0.231871 \tabularnewline
23 & -0.100831 & -0.6913 & 0.2464 \tabularnewline
24 & 0.064315 & 0.4409 & 0.330645 \tabularnewline
25 & 0.023074 & 0.1582 & 0.437493 \tabularnewline
26 & -0.116784 & -0.8006 & 0.213687 \tabularnewline
27 & -0.073749 & -0.5056 & 0.307751 \tabularnewline
28 & -0.003107 & -0.0213 & 0.491548 \tabularnewline
29 & -0.078473 & -0.538 & 0.296563 \tabularnewline
30 & -0.100001 & -0.6856 & 0.248176 \tabularnewline
31 & -0.096591 & -0.6622 & 0.255541 \tabularnewline
32 & 0.094276 & 0.6463 & 0.260606 \tabularnewline
33 & -0.087146 & -0.5974 & 0.276541 \tabularnewline
34 & -0.030146 & -0.2067 & 0.418579 \tabularnewline
35 & 0.041637 & 0.2855 & 0.388276 \tabularnewline
36 & -0.07018 & -0.4811 & 0.316328 \tabularnewline
\hline
\end{tabular}
%Source: https://freestatistics.org/blog/index.php?pk=63787&T=2

[TABLE]
[ROW][C]Partial Autocorrelation Function[/C][/ROW]
[ROW][C]Time lag k[/C][C]PACF(k)[/C][C]T-STAT[/C][C]P-value[/C][/ROW]
[ROW][C]1[/C][C]0.314748[/C][C]2.1578[/C][C]0.018043[/C][/ROW]
[ROW][C]2[/C][C]-0.006368[/C][C]-0.0437[/C][C]0.48268[/C][/ROW]
[ROW][C]3[/C][C]-0.316534[/C][C]-2.17[/C][C]0.017545[/C][/ROW]
[ROW][C]4[/C][C]-0.082731[/C][C]-0.5672[/C][C]0.286648[/C][/ROW]
[ROW][C]5[/C][C]-0.022887[/C][C]-0.1569[/C][C]0.437996[/C][/ROW]
[ROW][C]6[/C][C]-0.201618[/C][C]-1.3822[/C][C]0.086718[/C][/ROW]
[ROW][C]7[/C][C]-0.107836[/C][C]-0.7393[/C][C]0.231704[/C][/ROW]
[ROW][C]8[/C][C]-0.07688[/C][C]-0.5271[/C][C]0.300314[/C][/ROW]
[ROW][C]9[/C][C]0.032515[/C][C]0.2229[/C][C]0.412286[/C][/ROW]
[ROW][C]10[/C][C]-0.199517[/C][C]-1.3678[/C][C]0.088937[/C][/ROW]
[ROW][C]11[/C][C]-0.037422[/C][C]-0.2566[/C][C]0.399322[/C][/ROW]
[ROW][C]12[/C][C]-0.198397[/C][C]-1.3601[/C][C]0.090137[/C][/ROW]
[ROW][C]13[/C][C]0.190873[/C][C]1.3086[/C][C]0.098523[/C][/ROW]
[ROW][C]14[/C][C]-0.166528[/C][C]-1.1417[/C][C]0.129689[/C][/ROW]
[ROW][C]15[/C][C]-0.007156[/C][C]-0.0491[/C][C]0.48054[/C][/ROW]
[ROW][C]16[/C][C]0.016383[/C][C]0.1123[/C][C]0.455526[/C][/ROW]
[ROW][C]17[/C][C]-0.031783[/C][C]-0.2179[/C][C]0.414228[/C][/ROW]
[ROW][C]18[/C][C]0.210528[/C][C]1.4433[/C][C]0.077783[/C][/ROW]
[ROW][C]19[/C][C]0.01515[/C][C]0.1039[/C][C]0.458861[/C][/ROW]
[ROW][C]20[/C][C]0.007653[/C][C]0.0525[/C][C]0.479191[/C][/ROW]
[ROW][C]21[/C][C]-0.074379[/C][C]-0.5099[/C][C]0.306249[/C][/ROW]
[ROW][C]22[/C][C]-0.107756[/C][C]-0.7387[/C][C]0.231871[/C][/ROW]
[ROW][C]23[/C][C]-0.100831[/C][C]-0.6913[/C][C]0.2464[/C][/ROW]
[ROW][C]24[/C][C]0.064315[/C][C]0.4409[/C][C]0.330645[/C][/ROW]
[ROW][C]25[/C][C]0.023074[/C][C]0.1582[/C][C]0.437493[/C][/ROW]
[ROW][C]26[/C][C]-0.116784[/C][C]-0.8006[/C][C]0.213687[/C][/ROW]
[ROW][C]27[/C][C]-0.073749[/C][C]-0.5056[/C][C]0.307751[/C][/ROW]
[ROW][C]28[/C][C]-0.003107[/C][C]-0.0213[/C][C]0.491548[/C][/ROW]
[ROW][C]29[/C][C]-0.078473[/C][C]-0.538[/C][C]0.296563[/C][/ROW]
[ROW][C]30[/C][C]-0.100001[/C][C]-0.6856[/C][C]0.248176[/C][/ROW]
[ROW][C]31[/C][C]-0.096591[/C][C]-0.6622[/C][C]0.255541[/C][/ROW]
[ROW][C]32[/C][C]0.094276[/C][C]0.6463[/C][C]0.260606[/C][/ROW]
[ROW][C]33[/C][C]-0.087146[/C][C]-0.5974[/C][C]0.276541[/C][/ROW]
[ROW][C]34[/C][C]-0.030146[/C][C]-0.2067[/C][C]0.418579[/C][/ROW]
[ROW][C]35[/C][C]0.041637[/C][C]0.2855[/C][C]0.388276[/C][/ROW]
[ROW][C]36[/C][C]-0.07018[/C][C]-0.4811[/C][C]0.316328[/C][/ROW]
[/TABLE]
Source: https://freestatistics.org/blog/index.php?pk=63787&T=2

Globally Unique Identifier (entire table): ba.freestatistics.org/blog/index.php?pk=63787&T=2

As an alternative you can also use a QR Code:  

The GUIDs for individual cells are displayed in the table below:

Partial Autocorrelation Function
Time lag kPACF(k)T-STATP-value
10.3147482.15780.018043
2-0.006368-0.04370.48268
3-0.316534-2.170.017545
4-0.082731-0.56720.286648
5-0.022887-0.15690.437996
6-0.201618-1.38220.086718
7-0.107836-0.73930.231704
8-0.07688-0.52710.300314
90.0325150.22290.412286
10-0.199517-1.36780.088937
11-0.037422-0.25660.399322
12-0.198397-1.36010.090137
130.1908731.30860.098523
14-0.166528-1.14170.129689
15-0.007156-0.04910.48054
160.0163830.11230.455526
17-0.031783-0.21790.414228
180.2105281.44330.077783
190.015150.10390.458861
200.0076530.05250.479191
21-0.074379-0.50990.306249
22-0.107756-0.73870.231871
23-0.100831-0.69130.2464
240.0643150.44090.330645
250.0230740.15820.437493
26-0.116784-0.80060.213687
27-0.073749-0.50560.307751
28-0.003107-0.02130.491548
29-0.078473-0.5380.296563
30-0.100001-0.68560.248176
31-0.096591-0.66220.255541
320.0942760.64630.260606
33-0.087146-0.59740.276541
34-0.030146-0.20670.418579
350.0416370.28550.388276
36-0.07018-0.48110.316328


Parameters (Session):
par1 = 36 ; par2 = 1 ; par3 = 1 ; par4 = 1 ; par5 = 12 ; par6 = MA ; par7 = 0.95 ;
Parameters (R input):
par1 = 36 ; par2 = 1 ; par3 = 1 ; par4 = 1 ; par5 = 12 ; par6 = MA ; par7 = 0.95 ;
R code (references can be found in the software module):
if (par1 == 'Default') {
par1 = 10*log10(length(x))
} else {
par1 <- as.numeric(par1)
}
par2 <- as.numeric(par2)
par3 <- as.numeric(par3)
par4 <- as.numeric(par4)
par5 <- as.numeric(par5)
if (par6 == 'White Noise') par6 <- 'white' else par6 <- 'ma'
par7 <- as.numeric(par7)
if (par2 == 0) {
x <- log(x)
} else {
x <- (x ^ par2 - 1) / par2
}
if (par3 > 0) x <- diff(x,lag=1,difference=par3)
if (par4 > 0) x <- diff(x,lag=par5,difference=par4)
bitmap(file='pic1.png')
racf <- acf(x, par1, main='Autocorrelation', xlab='time lag', ylab='ACF', ci.type=par6, ci=par7, sub=paste('(lambda=',par2,', d=',par3,', D=',par4,', CI=', par7, ', CI type=',par6,')',sep=''))
dev.off()
bitmap(file='pic2.png')
rpacf <- pacf(x,par1,main='Partial Autocorrelation',xlab='lags',ylab='PACF')
dev.off()
(myacf <- c(racf$acf))
(mypacf <- c(rpacf$acf))
lengthx <- length(x)
sqrtn <- sqrt(lengthx)
load(file='createtable')
a<-table.start()
a<-table.row.start(a)
a<-table.element(a,'Autocorrelation Function',4,TRUE)
a<-table.row.end(a)
a<-table.row.start(a)
a<-table.element(a,'Time lag k',header=TRUE)
a<-table.element(a,hyperlink('basics.htm','ACF(k)','click here for more information about the Autocorrelation Function'),header=TRUE)
a<-table.element(a,'T-STAT',header=TRUE)
a<-table.element(a,'P-value',header=TRUE)
a<-table.row.end(a)
for (i in 2:(par1+1)) {
a<-table.row.start(a)
a<-table.element(a,i-1,header=TRUE)
a<-table.element(a,round(myacf[i],6))
mytstat <- myacf[i]*sqrtn
a<-table.element(a,round(mytstat,4))
a<-table.element(a,round(1-pt(abs(mytstat),lengthx),6))
a<-table.row.end(a)
}
a<-table.end(a)
table.save(a,file='mytable.tab')
a<-table.start()
a<-table.row.start(a)
a<-table.element(a,'Partial Autocorrelation Function',4,TRUE)
a<-table.row.end(a)
a<-table.row.start(a)
a<-table.element(a,'Time lag k',header=TRUE)
a<-table.element(a,hyperlink('basics.htm','PACF(k)','click here for more information about the Partial Autocorrelation Function'),header=TRUE)
a<-table.element(a,'T-STAT',header=TRUE)
a<-table.element(a,'P-value',header=TRUE)
a<-table.row.end(a)
for (i in 1:par1) {
a<-table.row.start(a)
a<-table.element(a,i,header=TRUE)
a<-table.element(a,round(mypacf[i],6))
mytstat <- mypacf[i]*sqrtn
a<-table.element(a,round(mytstat,4))
a<-table.element(a,round(1-pt(abs(mytstat),lengthx),6))
a<-table.row.end(a)
}
a<-table.end(a)
table.save(a,file='mytable1.tab')