Free Statistics

of Irreproducible Research!

Author's title

Author*The author of this computation has been verified*
R Software Modulerwasp_autocorrelation.wasp
Title produced by software(Partial) Autocorrelation Function
Date of computationFri, 04 Dec 2009 08:42:01 -0700
Cite this page as followsStatistical Computations at FreeStatistics.org, Office for Research Development and Education, URL https://freestatistics.org/blog/index.php?v=date/2009/Dec/04/t12599413710ls3kscpncle110.htm/, Retrieved Sat, 27 Apr 2024 13:36:19 +0000
Statistical Computations at FreeStatistics.org, Office for Research Development and Education, URL https://freestatistics.org/blog/index.php?pk=63791, Retrieved Sat, 27 Apr 2024 13:36:19 +0000
QR Codes:

Original text written by user:
IsPrivate?No (this computation is public)
User-defined keywords
Estimated Impact90
Family? (F = Feedback message, R = changed R code, M = changed R Module, P = changed Parameters, D = changed Data)
-     [Univariate Data Series] [data set] [2008-12-01 19:54:57] [b98453cac15ba1066b407e146608df68]
- RMP   [(Partial) Autocorrelation Function] [] [2009-11-27 14:48:46] [b98453cac15ba1066b407e146608df68]
-    D      [(Partial) Autocorrelation Function] [] [2009-12-04 15:42:01] [a1151e037da67acc5ce4bbcb8804d7f1] [Current]
Feedback Forum

Post a new message
Dataseries X:
392
394
392
396
392
396
419
421
420
418
410
418
426
428
430
424
423
427
441
449
452
462
455
461
461
463
462
456
455
456
472
472
471
465
459
465
468
467
463
460
462
461
476
476
471
453
443
442
444
438
427
424
416
406
431
434
418
412
404
409
412


Summary of computational transaction
Raw Inputview raw input (R code)
Raw Outputview raw output of R engine
Computing time1 seconds
R Server'Gwilym Jenkins' @ 72.249.127.135

\begin{tabular}{lllllllll}
\hline
Summary of computational transaction \tabularnewline
Raw Input & view raw input (R code)  \tabularnewline
Raw Output & view raw output of R engine  \tabularnewline
Computing time & 1 seconds \tabularnewline
R Server & 'Gwilym Jenkins' @ 72.249.127.135 \tabularnewline
\hline
\end{tabular}
%Source: https://freestatistics.org/blog/index.php?pk=63791&T=0

[TABLE]
[ROW][C]Summary of computational transaction[/C][/ROW]
[ROW][C]Raw Input[/C][C]view raw input (R code) [/C][/ROW]
[ROW][C]Raw Output[/C][C]view raw output of R engine [/C][/ROW]
[ROW][C]Computing time[/C][C]1 seconds[/C][/ROW]
[ROW][C]R Server[/C][C]'Gwilym Jenkins' @ 72.249.127.135[/C][/ROW]
[/TABLE]
Source: https://freestatistics.org/blog/index.php?pk=63791&T=0

Globally Unique Identifier (entire table): ba.freestatistics.org/blog/index.php?pk=63791&T=0

As an alternative you can also use a QR Code:  

The GUIDs for individual cells are displayed in the table below:

Summary of computational transaction
Raw Inputview raw input (R code)
Raw Outputview raw output of R engine
Computing time1 seconds
R Server'Gwilym Jenkins' @ 72.249.127.135


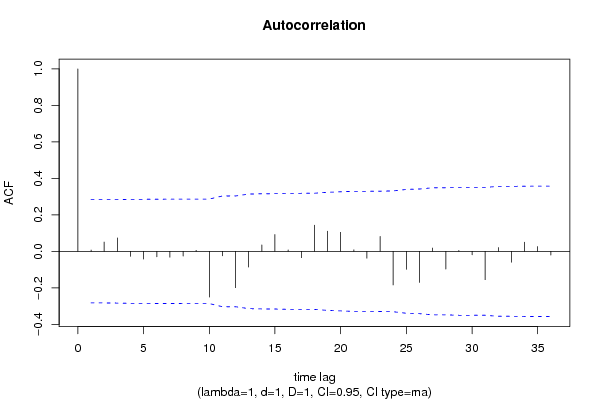
Autocorrelation Function
Time lag kACF(k)T-STATP-value
10.0071110.04930.480455
20.0506420.35090.363616
30.0732550.50750.307055
4-0.027333-0.18940.425302
5-0.042028-0.29120.386084
6-0.029947-0.20750.418256
7-0.032256-0.22350.412057
8-0.025738-0.17830.429612
90.0059250.0410.483715
10-0.250575-1.7360.044487
11-0.024208-0.16770.433754
12-0.199266-1.38060.086906
13-0.086235-0.59750.276506
140.0353250.24470.403851
150.0920580.63780.263319
160.0075660.05240.479207
17-0.034722-0.24060.405459
180.1435060.99420.162546
190.1105640.7660.22371
200.104250.72230.236818
210.0081130.05620.477705
22-0.037216-0.25780.398816
230.08160.56530.287238
24-0.184171-1.2760.104052
25-0.098659-0.68350.248779
26-0.17032-1.180.121906
270.0181450.12570.450244
28-0.096981-0.67190.252433
290.0047010.03260.487077
30-0.018747-0.12990.4486
31-0.155606-1.07810.143196
320.0210650.14590.442289
33-0.059273-0.41070.341575
340.0502710.34830.364574
350.0264520.18330.427681
36-0.020731-0.14360.443197

\begin{tabular}{lllllllll}
\hline
Autocorrelation Function \tabularnewline
Time lag k & ACF(k) & T-STAT & P-value \tabularnewline
1 & 0.007111 & 0.0493 & 0.480455 \tabularnewline
2 & 0.050642 & 0.3509 & 0.363616 \tabularnewline
3 & 0.073255 & 0.5075 & 0.307055 \tabularnewline
4 & -0.027333 & -0.1894 & 0.425302 \tabularnewline
5 & -0.042028 & -0.2912 & 0.386084 \tabularnewline
6 & -0.029947 & -0.2075 & 0.418256 \tabularnewline
7 & -0.032256 & -0.2235 & 0.412057 \tabularnewline
8 & -0.025738 & -0.1783 & 0.429612 \tabularnewline
9 & 0.005925 & 0.041 & 0.483715 \tabularnewline
10 & -0.250575 & -1.736 & 0.044487 \tabularnewline
11 & -0.024208 & -0.1677 & 0.433754 \tabularnewline
12 & -0.199266 & -1.3806 & 0.086906 \tabularnewline
13 & -0.086235 & -0.5975 & 0.276506 \tabularnewline
14 & 0.035325 & 0.2447 & 0.403851 \tabularnewline
15 & 0.092058 & 0.6378 & 0.263319 \tabularnewline
16 & 0.007566 & 0.0524 & 0.479207 \tabularnewline
17 & -0.034722 & -0.2406 & 0.405459 \tabularnewline
18 & 0.143506 & 0.9942 & 0.162546 \tabularnewline
19 & 0.110564 & 0.766 & 0.22371 \tabularnewline
20 & 0.10425 & 0.7223 & 0.236818 \tabularnewline
21 & 0.008113 & 0.0562 & 0.477705 \tabularnewline
22 & -0.037216 & -0.2578 & 0.398816 \tabularnewline
23 & 0.0816 & 0.5653 & 0.287238 \tabularnewline
24 & -0.184171 & -1.276 & 0.104052 \tabularnewline
25 & -0.098659 & -0.6835 & 0.248779 \tabularnewline
26 & -0.17032 & -1.18 & 0.121906 \tabularnewline
27 & 0.018145 & 0.1257 & 0.450244 \tabularnewline
28 & -0.096981 & -0.6719 & 0.252433 \tabularnewline
29 & 0.004701 & 0.0326 & 0.487077 \tabularnewline
30 & -0.018747 & -0.1299 & 0.4486 \tabularnewline
31 & -0.155606 & -1.0781 & 0.143196 \tabularnewline
32 & 0.021065 & 0.1459 & 0.442289 \tabularnewline
33 & -0.059273 & -0.4107 & 0.341575 \tabularnewline
34 & 0.050271 & 0.3483 & 0.364574 \tabularnewline
35 & 0.026452 & 0.1833 & 0.427681 \tabularnewline
36 & -0.020731 & -0.1436 & 0.443197 \tabularnewline
\hline
\end{tabular}
%Source: https://freestatistics.org/blog/index.php?pk=63791&T=1

[TABLE]
[ROW][C]Autocorrelation Function[/C][/ROW]
[ROW][C]Time lag k[/C][C]ACF(k)[/C][C]T-STAT[/C][C]P-value[/C][/ROW]
[ROW][C]1[/C][C]0.007111[/C][C]0.0493[/C][C]0.480455[/C][/ROW]
[ROW][C]2[/C][C]0.050642[/C][C]0.3509[/C][C]0.363616[/C][/ROW]
[ROW][C]3[/C][C]0.073255[/C][C]0.5075[/C][C]0.307055[/C][/ROW]
[ROW][C]4[/C][C]-0.027333[/C][C]-0.1894[/C][C]0.425302[/C][/ROW]
[ROW][C]5[/C][C]-0.042028[/C][C]-0.2912[/C][C]0.386084[/C][/ROW]
[ROW][C]6[/C][C]-0.029947[/C][C]-0.2075[/C][C]0.418256[/C][/ROW]
[ROW][C]7[/C][C]-0.032256[/C][C]-0.2235[/C][C]0.412057[/C][/ROW]
[ROW][C]8[/C][C]-0.025738[/C][C]-0.1783[/C][C]0.429612[/C][/ROW]
[ROW][C]9[/C][C]0.005925[/C][C]0.041[/C][C]0.483715[/C][/ROW]
[ROW][C]10[/C][C]-0.250575[/C][C]-1.736[/C][C]0.044487[/C][/ROW]
[ROW][C]11[/C][C]-0.024208[/C][C]-0.1677[/C][C]0.433754[/C][/ROW]
[ROW][C]12[/C][C]-0.199266[/C][C]-1.3806[/C][C]0.086906[/C][/ROW]
[ROW][C]13[/C][C]-0.086235[/C][C]-0.5975[/C][C]0.276506[/C][/ROW]
[ROW][C]14[/C][C]0.035325[/C][C]0.2447[/C][C]0.403851[/C][/ROW]
[ROW][C]15[/C][C]0.092058[/C][C]0.6378[/C][C]0.263319[/C][/ROW]
[ROW][C]16[/C][C]0.007566[/C][C]0.0524[/C][C]0.479207[/C][/ROW]
[ROW][C]17[/C][C]-0.034722[/C][C]-0.2406[/C][C]0.405459[/C][/ROW]
[ROW][C]18[/C][C]0.143506[/C][C]0.9942[/C][C]0.162546[/C][/ROW]
[ROW][C]19[/C][C]0.110564[/C][C]0.766[/C][C]0.22371[/C][/ROW]
[ROW][C]20[/C][C]0.10425[/C][C]0.7223[/C][C]0.236818[/C][/ROW]
[ROW][C]21[/C][C]0.008113[/C][C]0.0562[/C][C]0.477705[/C][/ROW]
[ROW][C]22[/C][C]-0.037216[/C][C]-0.2578[/C][C]0.398816[/C][/ROW]
[ROW][C]23[/C][C]0.0816[/C][C]0.5653[/C][C]0.287238[/C][/ROW]
[ROW][C]24[/C][C]-0.184171[/C][C]-1.276[/C][C]0.104052[/C][/ROW]
[ROW][C]25[/C][C]-0.098659[/C][C]-0.6835[/C][C]0.248779[/C][/ROW]
[ROW][C]26[/C][C]-0.17032[/C][C]-1.18[/C][C]0.121906[/C][/ROW]
[ROW][C]27[/C][C]0.018145[/C][C]0.1257[/C][C]0.450244[/C][/ROW]
[ROW][C]28[/C][C]-0.096981[/C][C]-0.6719[/C][C]0.252433[/C][/ROW]
[ROW][C]29[/C][C]0.004701[/C][C]0.0326[/C][C]0.487077[/C][/ROW]
[ROW][C]30[/C][C]-0.018747[/C][C]-0.1299[/C][C]0.4486[/C][/ROW]
[ROW][C]31[/C][C]-0.155606[/C][C]-1.0781[/C][C]0.143196[/C][/ROW]
[ROW][C]32[/C][C]0.021065[/C][C]0.1459[/C][C]0.442289[/C][/ROW]
[ROW][C]33[/C][C]-0.059273[/C][C]-0.4107[/C][C]0.341575[/C][/ROW]
[ROW][C]34[/C][C]0.050271[/C][C]0.3483[/C][C]0.364574[/C][/ROW]
[ROW][C]35[/C][C]0.026452[/C][C]0.1833[/C][C]0.427681[/C][/ROW]
[ROW][C]36[/C][C]-0.020731[/C][C]-0.1436[/C][C]0.443197[/C][/ROW]
[/TABLE]
Source: https://freestatistics.org/blog/index.php?pk=63791&T=1

Globally Unique Identifier (entire table): ba.freestatistics.org/blog/index.php?pk=63791&T=1

As an alternative you can also use a QR Code:  

The GUIDs for individual cells are displayed in the table below:

Autocorrelation Function
Time lag kACF(k)T-STATP-value
10.0071110.04930.480455
20.0506420.35090.363616
30.0732550.50750.307055
4-0.027333-0.18940.425302
5-0.042028-0.29120.386084
6-0.029947-0.20750.418256
7-0.032256-0.22350.412057
8-0.025738-0.17830.429612
90.0059250.0410.483715
10-0.250575-1.7360.044487
11-0.024208-0.16770.433754
12-0.199266-1.38060.086906
13-0.086235-0.59750.276506
140.0353250.24470.403851
150.0920580.63780.263319
160.0075660.05240.479207
17-0.034722-0.24060.405459
180.1435060.99420.162546
190.1105640.7660.22371
200.104250.72230.236818
210.0081130.05620.477705
22-0.037216-0.25780.398816
230.08160.56530.287238
24-0.184171-1.2760.104052
25-0.098659-0.68350.248779
26-0.17032-1.180.121906
270.0181450.12570.450244
28-0.096981-0.67190.252433
290.0047010.03260.487077
30-0.018747-0.12990.4486
31-0.155606-1.07810.143196
320.0210650.14590.442289
33-0.059273-0.41070.341575
340.0502710.34830.364574
350.0264520.18330.427681
36-0.020731-0.14360.443197


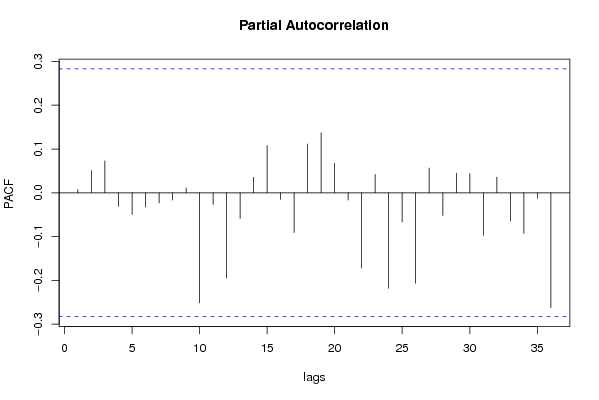
Partial Autocorrelation Function
Time lag kPACF(k)T-STATP-value
10.0071110.04930.480455
20.0505940.35050.36374
30.0727430.5040.30829
4-0.030856-0.21380.415814
5-0.049574-0.34350.366378
6-0.032263-0.22350.412038
7-0.023224-0.16090.436425
8-0.016481-0.11420.454785
90.0112340.07780.469143
10-0.251216-1.74050.044092
11-0.026887-0.18630.426505
12-0.194622-1.34840.091932
13-0.058552-0.40570.343398
140.0353010.24460.403916
150.1079560.74790.229073
16-0.01506-0.10430.458668
17-0.09069-0.62830.266386
180.1112350.77070.222342
190.136950.94880.173732
200.0673490.46660.321447
21-0.016639-0.11530.454354
22-0.171892-1.19090.119775
230.0418970.29030.386429
24-0.218079-1.51090.068685
25-0.066676-0.46190.323105
26-0.206473-1.43050.079528
270.056450.39110.348728
28-0.051825-0.35910.360564
290.044650.30930.379199
300.0436390.30230.381849
31-0.097041-0.67230.252302
320.0360640.24990.401881
33-0.064475-0.44670.328552
34-0.092586-0.64150.262139
35-0.01241-0.0860.465919
36-0.262054-1.81560.037843

\begin{tabular}{lllllllll}
\hline
Partial Autocorrelation Function \tabularnewline
Time lag k & PACF(k) & T-STAT & P-value \tabularnewline
1 & 0.007111 & 0.0493 & 0.480455 \tabularnewline
2 & 0.050594 & 0.3505 & 0.36374 \tabularnewline
3 & 0.072743 & 0.504 & 0.30829 \tabularnewline
4 & -0.030856 & -0.2138 & 0.415814 \tabularnewline
5 & -0.049574 & -0.3435 & 0.366378 \tabularnewline
6 & -0.032263 & -0.2235 & 0.412038 \tabularnewline
7 & -0.023224 & -0.1609 & 0.436425 \tabularnewline
8 & -0.016481 & -0.1142 & 0.454785 \tabularnewline
9 & 0.011234 & 0.0778 & 0.469143 \tabularnewline
10 & -0.251216 & -1.7405 & 0.044092 \tabularnewline
11 & -0.026887 & -0.1863 & 0.426505 \tabularnewline
12 & -0.194622 & -1.3484 & 0.091932 \tabularnewline
13 & -0.058552 & -0.4057 & 0.343398 \tabularnewline
14 & 0.035301 & 0.2446 & 0.403916 \tabularnewline
15 & 0.107956 & 0.7479 & 0.229073 \tabularnewline
16 & -0.01506 & -0.1043 & 0.458668 \tabularnewline
17 & -0.09069 & -0.6283 & 0.266386 \tabularnewline
18 & 0.111235 & 0.7707 & 0.222342 \tabularnewline
19 & 0.13695 & 0.9488 & 0.173732 \tabularnewline
20 & 0.067349 & 0.4666 & 0.321447 \tabularnewline
21 & -0.016639 & -0.1153 & 0.454354 \tabularnewline
22 & -0.171892 & -1.1909 & 0.119775 \tabularnewline
23 & 0.041897 & 0.2903 & 0.386429 \tabularnewline
24 & -0.218079 & -1.5109 & 0.068685 \tabularnewline
25 & -0.066676 & -0.4619 & 0.323105 \tabularnewline
26 & -0.206473 & -1.4305 & 0.079528 \tabularnewline
27 & 0.05645 & 0.3911 & 0.348728 \tabularnewline
28 & -0.051825 & -0.3591 & 0.360564 \tabularnewline
29 & 0.04465 & 0.3093 & 0.379199 \tabularnewline
30 & 0.043639 & 0.3023 & 0.381849 \tabularnewline
31 & -0.097041 & -0.6723 & 0.252302 \tabularnewline
32 & 0.036064 & 0.2499 & 0.401881 \tabularnewline
33 & -0.064475 & -0.4467 & 0.328552 \tabularnewline
34 & -0.092586 & -0.6415 & 0.262139 \tabularnewline
35 & -0.01241 & -0.086 & 0.465919 \tabularnewline
36 & -0.262054 & -1.8156 & 0.037843 \tabularnewline
\hline
\end{tabular}
%Source: https://freestatistics.org/blog/index.php?pk=63791&T=2

[TABLE]
[ROW][C]Partial Autocorrelation Function[/C][/ROW]
[ROW][C]Time lag k[/C][C]PACF(k)[/C][C]T-STAT[/C][C]P-value[/C][/ROW]
[ROW][C]1[/C][C]0.007111[/C][C]0.0493[/C][C]0.480455[/C][/ROW]
[ROW][C]2[/C][C]0.050594[/C][C]0.3505[/C][C]0.36374[/C][/ROW]
[ROW][C]3[/C][C]0.072743[/C][C]0.504[/C][C]0.30829[/C][/ROW]
[ROW][C]4[/C][C]-0.030856[/C][C]-0.2138[/C][C]0.415814[/C][/ROW]
[ROW][C]5[/C][C]-0.049574[/C][C]-0.3435[/C][C]0.366378[/C][/ROW]
[ROW][C]6[/C][C]-0.032263[/C][C]-0.2235[/C][C]0.412038[/C][/ROW]
[ROW][C]7[/C][C]-0.023224[/C][C]-0.1609[/C][C]0.436425[/C][/ROW]
[ROW][C]8[/C][C]-0.016481[/C][C]-0.1142[/C][C]0.454785[/C][/ROW]
[ROW][C]9[/C][C]0.011234[/C][C]0.0778[/C][C]0.469143[/C][/ROW]
[ROW][C]10[/C][C]-0.251216[/C][C]-1.7405[/C][C]0.044092[/C][/ROW]
[ROW][C]11[/C][C]-0.026887[/C][C]-0.1863[/C][C]0.426505[/C][/ROW]
[ROW][C]12[/C][C]-0.194622[/C][C]-1.3484[/C][C]0.091932[/C][/ROW]
[ROW][C]13[/C][C]-0.058552[/C][C]-0.4057[/C][C]0.343398[/C][/ROW]
[ROW][C]14[/C][C]0.035301[/C][C]0.2446[/C][C]0.403916[/C][/ROW]
[ROW][C]15[/C][C]0.107956[/C][C]0.7479[/C][C]0.229073[/C][/ROW]
[ROW][C]16[/C][C]-0.01506[/C][C]-0.1043[/C][C]0.458668[/C][/ROW]
[ROW][C]17[/C][C]-0.09069[/C][C]-0.6283[/C][C]0.266386[/C][/ROW]
[ROW][C]18[/C][C]0.111235[/C][C]0.7707[/C][C]0.222342[/C][/ROW]
[ROW][C]19[/C][C]0.13695[/C][C]0.9488[/C][C]0.173732[/C][/ROW]
[ROW][C]20[/C][C]0.067349[/C][C]0.4666[/C][C]0.321447[/C][/ROW]
[ROW][C]21[/C][C]-0.016639[/C][C]-0.1153[/C][C]0.454354[/C][/ROW]
[ROW][C]22[/C][C]-0.171892[/C][C]-1.1909[/C][C]0.119775[/C][/ROW]
[ROW][C]23[/C][C]0.041897[/C][C]0.2903[/C][C]0.386429[/C][/ROW]
[ROW][C]24[/C][C]-0.218079[/C][C]-1.5109[/C][C]0.068685[/C][/ROW]
[ROW][C]25[/C][C]-0.066676[/C][C]-0.4619[/C][C]0.323105[/C][/ROW]
[ROW][C]26[/C][C]-0.206473[/C][C]-1.4305[/C][C]0.079528[/C][/ROW]
[ROW][C]27[/C][C]0.05645[/C][C]0.3911[/C][C]0.348728[/C][/ROW]
[ROW][C]28[/C][C]-0.051825[/C][C]-0.3591[/C][C]0.360564[/C][/ROW]
[ROW][C]29[/C][C]0.04465[/C][C]0.3093[/C][C]0.379199[/C][/ROW]
[ROW][C]30[/C][C]0.043639[/C][C]0.3023[/C][C]0.381849[/C][/ROW]
[ROW][C]31[/C][C]-0.097041[/C][C]-0.6723[/C][C]0.252302[/C][/ROW]
[ROW][C]32[/C][C]0.036064[/C][C]0.2499[/C][C]0.401881[/C][/ROW]
[ROW][C]33[/C][C]-0.064475[/C][C]-0.4467[/C][C]0.328552[/C][/ROW]
[ROW][C]34[/C][C]-0.092586[/C][C]-0.6415[/C][C]0.262139[/C][/ROW]
[ROW][C]35[/C][C]-0.01241[/C][C]-0.086[/C][C]0.465919[/C][/ROW]
[ROW][C]36[/C][C]-0.262054[/C][C]-1.8156[/C][C]0.037843[/C][/ROW]
[/TABLE]
Source: https://freestatistics.org/blog/index.php?pk=63791&T=2

Globally Unique Identifier (entire table): ba.freestatistics.org/blog/index.php?pk=63791&T=2

As an alternative you can also use a QR Code:  

The GUIDs for individual cells are displayed in the table below:

Partial Autocorrelation Function
Time lag kPACF(k)T-STATP-value
10.0071110.04930.480455
20.0505940.35050.36374
30.0727430.5040.30829
4-0.030856-0.21380.415814
5-0.049574-0.34350.366378
6-0.032263-0.22350.412038
7-0.023224-0.16090.436425
8-0.016481-0.11420.454785
90.0112340.07780.469143
10-0.251216-1.74050.044092
11-0.026887-0.18630.426505
12-0.194622-1.34840.091932
13-0.058552-0.40570.343398
140.0353010.24460.403916
150.1079560.74790.229073
16-0.01506-0.10430.458668
17-0.09069-0.62830.266386
180.1112350.77070.222342
190.136950.94880.173732
200.0673490.46660.321447
21-0.016639-0.11530.454354
22-0.171892-1.19090.119775
230.0418970.29030.386429
24-0.218079-1.51090.068685
25-0.066676-0.46190.323105
26-0.206473-1.43050.079528
270.056450.39110.348728
28-0.051825-0.35910.360564
290.044650.30930.379199
300.0436390.30230.381849
31-0.097041-0.67230.252302
320.0360640.24990.401881
33-0.064475-0.44670.328552
34-0.092586-0.64150.262139
35-0.01241-0.0860.465919
36-0.262054-1.81560.037843


Parameters (Session):
par1 = 36 ; par2 = 1 ; par3 = 1 ; par4 = 1 ; par5 = 12 ; par6 = MA ; par7 = 0.95 ;
Parameters (R input):
par1 = 36 ; par2 = 1 ; par3 = 1 ; par4 = 1 ; par5 = 12 ; par6 = MA ; par7 = 0.95 ;
R code (references can be found in the software module):
if (par1 == 'Default') {
par1 = 10*log10(length(x))
} else {
par1 <- as.numeric(par1)
}
par2 <- as.numeric(par2)
par3 <- as.numeric(par3)
par4 <- as.numeric(par4)
par5 <- as.numeric(par5)
if (par6 == 'White Noise') par6 <- 'white' else par6 <- 'ma'
par7 <- as.numeric(par7)
if (par2 == 0) {
x <- log(x)
} else {
x <- (x ^ par2 - 1) / par2
}
if (par3 > 0) x <- diff(x,lag=1,difference=par3)
if (par4 > 0) x <- diff(x,lag=par5,difference=par4)
bitmap(file='pic1.png')
racf <- acf(x, par1, main='Autocorrelation', xlab='time lag', ylab='ACF', ci.type=par6, ci=par7, sub=paste('(lambda=',par2,', d=',par3,', D=',par4,', CI=', par7, ', CI type=',par6,')',sep=''))
dev.off()
bitmap(file='pic2.png')
rpacf <- pacf(x,par1,main='Partial Autocorrelation',xlab='lags',ylab='PACF')
dev.off()
(myacf <- c(racf$acf))
(mypacf <- c(rpacf$acf))
lengthx <- length(x)
sqrtn <- sqrt(lengthx)
load(file='createtable')
a<-table.start()
a<-table.row.start(a)
a<-table.element(a,'Autocorrelation Function',4,TRUE)
a<-table.row.end(a)
a<-table.row.start(a)
a<-table.element(a,'Time lag k',header=TRUE)
a<-table.element(a,hyperlink('basics.htm','ACF(k)','click here for more information about the Autocorrelation Function'),header=TRUE)
a<-table.element(a,'T-STAT',header=TRUE)
a<-table.element(a,'P-value',header=TRUE)
a<-table.row.end(a)
for (i in 2:(par1+1)) {
a<-table.row.start(a)
a<-table.element(a,i-1,header=TRUE)
a<-table.element(a,round(myacf[i],6))
mytstat <- myacf[i]*sqrtn
a<-table.element(a,round(mytstat,4))
a<-table.element(a,round(1-pt(abs(mytstat),lengthx),6))
a<-table.row.end(a)
}
a<-table.end(a)
table.save(a,file='mytable.tab')
a<-table.start()
a<-table.row.start(a)
a<-table.element(a,'Partial Autocorrelation Function',4,TRUE)
a<-table.row.end(a)
a<-table.row.start(a)
a<-table.element(a,'Time lag k',header=TRUE)
a<-table.element(a,hyperlink('basics.htm','PACF(k)','click here for more information about the Partial Autocorrelation Function'),header=TRUE)
a<-table.element(a,'T-STAT',header=TRUE)
a<-table.element(a,'P-value',header=TRUE)
a<-table.row.end(a)
for (i in 1:par1) {
a<-table.row.start(a)
a<-table.element(a,i,header=TRUE)
a<-table.element(a,round(mypacf[i],6))
mytstat <- mypacf[i]*sqrtn
a<-table.element(a,round(mytstat,4))
a<-table.element(a,round(1-pt(abs(mytstat),lengthx),6))
a<-table.row.end(a)
}
a<-table.end(a)
table.save(a,file='mytable1.tab')