Free Statistics

of Irreproducible Research!

Author's title

Author*The author of this computation has been verified*
R Software Modulerwasp_exponentialsmoothing.wasp
Title produced by softwareExponential Smoothing
Date of computationFri, 04 Dec 2009 08:54:01 -0700
Cite this page as followsStatistical Computations at FreeStatistics.org, Office for Research Development and Education, URL https://freestatistics.org/blog/index.php?v=date/2009/Dec/04/t12599420750cwz9m4lwwcefql.htm/, Retrieved Sat, 27 Apr 2024 19:22:37 +0000
Statistical Computations at FreeStatistics.org, Office for Research Development and Education, URL https://freestatistics.org/blog/index.php?pk=63808, Retrieved Sat, 27 Apr 2024 19:22:37 +0000
QR Codes:

Original text written by user:
IsPrivate?No (this computation is public)
User-defined keywords
Estimated Impact99
Family? (F = Feedback message, R = changed R code, M = changed R Module, P = changed Parameters, D = changed Data)
-     [Univariate Data Series] [data set] [2008-12-01 19:54:57] [b98453cac15ba1066b407e146608df68]
- RMP   [Exponential Smoothing] [] [2009-11-27 15:04:36] [b98453cac15ba1066b407e146608df68]
-   PD      [Exponential Smoothing] [] [2009-12-04 15:54:01] [c88a5f1b97e332c6387d668c465455af] [Current]
Feedback Forum

Post a new message
Dataseries X:
1258
1199
1158
1427
934
709
1186
986
1033
1257
1105
1179
1092
1092
1087
2028
2039
2010
754
760
715
855
971
815
915
843
761
1858
2968
4061
3661
3269
2857
2568
2274
1987
683
381
71
1772
3485
5181
4479
3782
3067
2489
1903
1330
736
483
242
1334
2423
3523
2986
2462
1908
1575
1237
904


Summary of computational transaction
Raw Inputview raw input (R code)
Raw Outputview raw output of R engine
Computing time2 seconds
R Server'Gwilym Jenkins' @ 72.249.127.135

\begin{tabular}{lllllllll}
\hline
Summary of computational transaction \tabularnewline
Raw Input & view raw input (R code)  \tabularnewline
Raw Output & view raw output of R engine  \tabularnewline
Computing time & 2 seconds \tabularnewline
R Server & 'Gwilym Jenkins' @ 72.249.127.135 \tabularnewline
\hline
\end{tabular}
%Source: https://freestatistics.org/blog/index.php?pk=63808&T=0

[TABLE]
[ROW][C]Summary of computational transaction[/C][/ROW]
[ROW][C]Raw Input[/C][C]view raw input (R code) [/C][/ROW]
[ROW][C]Raw Output[/C][C]view raw output of R engine [/C][/ROW]
[ROW][C]Computing time[/C][C]2 seconds[/C][/ROW]
[ROW][C]R Server[/C][C]'Gwilym Jenkins' @ 72.249.127.135[/C][/ROW]
[/TABLE]
Source: https://freestatistics.org/blog/index.php?pk=63808&T=0

Globally Unique Identifier (entire table): ba.freestatistics.org/blog/index.php?pk=63808&T=0

As an alternative you can also use a QR Code:  

The GUIDs for individual cells are displayed in the table below:

Summary of computational transaction
Raw Inputview raw input (R code)
Raw Outputview raw output of R engine
Computing time2 seconds
R Server'Gwilym Jenkins' @ 72.249.127.135


Estimated Parameters of Exponential Smoothing
ParameterValue
alpha0.0918611009738237
beta0
gamma0.573855305728291

\begin{tabular}{lllllllll}
\hline
Estimated Parameters of Exponential Smoothing \tabularnewline
Parameter & Value \tabularnewline
alpha & 0.0918611009738237 \tabularnewline
beta & 0 \tabularnewline
gamma & 0.573855305728291 \tabularnewline
\hline
\end{tabular}
%Source: https://freestatistics.org/blog/index.php?pk=63808&T=1

[TABLE]
[ROW][C]Estimated Parameters of Exponential Smoothing[/C][/ROW]
[ROW][C]Parameter[/C][C]Value[/C][/ROW]
[ROW][C]alpha[/C][C]0.0918611009738237[/C][/ROW]
[ROW][C]beta[/C][C]0[/C][/ROW]
[ROW][C]gamma[/C][C]0.573855305728291[/C][/ROW]
[/TABLE]
Source: https://freestatistics.org/blog/index.php?pk=63808&T=1

Globally Unique Identifier (entire table): ba.freestatistics.org/blog/index.php?pk=63808&T=1

As an alternative you can also use a QR Code:  

The GUIDs for individual cells are displayed in the table below:

Estimated Parameters of Exponential Smoothing
ParameterValue
alpha0.0918611009738237
beta0
gamma0.573855305728291


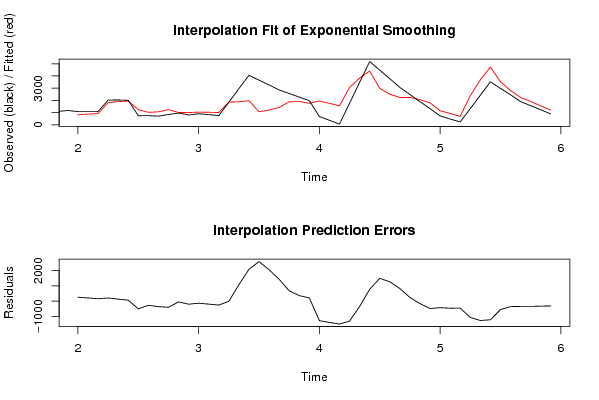
Interpolation Forecasts of Exponential Smoothing
tObservedFittedResiduals
131092831.122281907311260.877718092689
141092884.385368902543207.614631097457
151087926.685512139121160.314487860879
1620281820.45916588127207.540834118727
1720391905.54726232992133.452737670082
1820101945.4924605845664.5075394154394
197541256.35942724446-502.359427244458
207601028.43268285001-268.432682850010
217151071.31431656251-356.314316562514
228551253.75893393566-398.758933935659
239711018.24150647733-47.2415064773303
248151009.71354350964-194.713543509635
259151048.28006942312-133.280069423118
268431034.69041122445-191.690411224455
277611014.27205040528-253.272050405278
2818581864.40755848404-6.4075584840416
2929681890.617024027581077.38297597242
3040611981.205658367472079.79434163253
3136611076.391060919192584.60893908081
3232691222.169131047132046.83086895287
3328571429.607950149851427.39204985015
3425681892.25294110882675.747058891177
3522741912.41895570618361.581044293823
3619871772.07795251764214.922047482356
376831956.19662333999-1273.19662333999
383811765.2482088613-1384.2482088613
39711561.79859879052-1490.79859879052
4017723071.85565013228-1299.85565013228
4134853829.64255993234-344.642559932339
4251814404.72405087655776.275949123447
4344792988.204750367061490.79524963294
4437822518.148271365341263.85172863466
4530672244.13752371150822.862476288496
4624892247.78703064133241.212969358671
4719032064.61354447124-161.613544471244
4813301808.93008153061-478.930081530609
497361159.81561172641-423.815611726414
50483942.078553689241-459.078553689241
51242697.289305379152-455.289305379152
5213342394.35176643172-1060.35176643172
5324233683.39617061049-1260.39617061049
5435234735.9693980243-1212.9693980243
5529863536.81343804411-550.813438044111
5624622814.69982590468-352.699825904685
5719082249.49004861305-341.490048613054
5815751917.43744973985-342.437449739849
5912371561.28894104293-324.288941042926
609041212.35135642901-308.351356429009

\begin{tabular}{lllllllll}
\hline
Interpolation Forecasts of Exponential Smoothing \tabularnewline
t & Observed & Fitted & Residuals \tabularnewline
13 & 1092 & 831.122281907311 & 260.877718092689 \tabularnewline
14 & 1092 & 884.385368902543 & 207.614631097457 \tabularnewline
15 & 1087 & 926.685512139121 & 160.314487860879 \tabularnewline
16 & 2028 & 1820.45916588127 & 207.540834118727 \tabularnewline
17 & 2039 & 1905.54726232992 & 133.452737670082 \tabularnewline
18 & 2010 & 1945.49246058456 & 64.5075394154394 \tabularnewline
19 & 754 & 1256.35942724446 & -502.359427244458 \tabularnewline
20 & 760 & 1028.43268285001 & -268.432682850010 \tabularnewline
21 & 715 & 1071.31431656251 & -356.314316562514 \tabularnewline
22 & 855 & 1253.75893393566 & -398.758933935659 \tabularnewline
23 & 971 & 1018.24150647733 & -47.2415064773303 \tabularnewline
24 & 815 & 1009.71354350964 & -194.713543509635 \tabularnewline
25 & 915 & 1048.28006942312 & -133.280069423118 \tabularnewline
26 & 843 & 1034.69041122445 & -191.690411224455 \tabularnewline
27 & 761 & 1014.27205040528 & -253.272050405278 \tabularnewline
28 & 1858 & 1864.40755848404 & -6.4075584840416 \tabularnewline
29 & 2968 & 1890.61702402758 & 1077.38297597242 \tabularnewline
30 & 4061 & 1981.20565836747 & 2079.79434163253 \tabularnewline
31 & 3661 & 1076.39106091919 & 2584.60893908081 \tabularnewline
32 & 3269 & 1222.16913104713 & 2046.83086895287 \tabularnewline
33 & 2857 & 1429.60795014985 & 1427.39204985015 \tabularnewline
34 & 2568 & 1892.25294110882 & 675.747058891177 \tabularnewline
35 & 2274 & 1912.41895570618 & 361.581044293823 \tabularnewline
36 & 1987 & 1772.07795251764 & 214.922047482356 \tabularnewline
37 & 683 & 1956.19662333999 & -1273.19662333999 \tabularnewline
38 & 381 & 1765.2482088613 & -1384.2482088613 \tabularnewline
39 & 71 & 1561.79859879052 & -1490.79859879052 \tabularnewline
40 & 1772 & 3071.85565013228 & -1299.85565013228 \tabularnewline
41 & 3485 & 3829.64255993234 & -344.642559932339 \tabularnewline
42 & 5181 & 4404.72405087655 & 776.275949123447 \tabularnewline
43 & 4479 & 2988.20475036706 & 1490.79524963294 \tabularnewline
44 & 3782 & 2518.14827136534 & 1263.85172863466 \tabularnewline
45 & 3067 & 2244.13752371150 & 822.862476288496 \tabularnewline
46 & 2489 & 2247.78703064133 & 241.212969358671 \tabularnewline
47 & 1903 & 2064.61354447124 & -161.613544471244 \tabularnewline
48 & 1330 & 1808.93008153061 & -478.930081530609 \tabularnewline
49 & 736 & 1159.81561172641 & -423.815611726414 \tabularnewline
50 & 483 & 942.078553689241 & -459.078553689241 \tabularnewline
51 & 242 & 697.289305379152 & -455.289305379152 \tabularnewline
52 & 1334 & 2394.35176643172 & -1060.35176643172 \tabularnewline
53 & 2423 & 3683.39617061049 & -1260.39617061049 \tabularnewline
54 & 3523 & 4735.9693980243 & -1212.9693980243 \tabularnewline
55 & 2986 & 3536.81343804411 & -550.813438044111 \tabularnewline
56 & 2462 & 2814.69982590468 & -352.699825904685 \tabularnewline
57 & 1908 & 2249.49004861305 & -341.490048613054 \tabularnewline
58 & 1575 & 1917.43744973985 & -342.437449739849 \tabularnewline
59 & 1237 & 1561.28894104293 & -324.288941042926 \tabularnewline
60 & 904 & 1212.35135642901 & -308.351356429009 \tabularnewline
\hline
\end{tabular}
%Source: https://freestatistics.org/blog/index.php?pk=63808&T=2

[TABLE]
[ROW][C]Interpolation Forecasts of Exponential Smoothing[/C][/ROW]
[ROW][C]t[/C][C]Observed[/C][C]Fitted[/C][C]Residuals[/C][/ROW]
[ROW][C]13[/C][C]1092[/C][C]831.122281907311[/C][C]260.877718092689[/C][/ROW]
[ROW][C]14[/C][C]1092[/C][C]884.385368902543[/C][C]207.614631097457[/C][/ROW]
[ROW][C]15[/C][C]1087[/C][C]926.685512139121[/C][C]160.314487860879[/C][/ROW]
[ROW][C]16[/C][C]2028[/C][C]1820.45916588127[/C][C]207.540834118727[/C][/ROW]
[ROW][C]17[/C][C]2039[/C][C]1905.54726232992[/C][C]133.452737670082[/C][/ROW]
[ROW][C]18[/C][C]2010[/C][C]1945.49246058456[/C][C]64.5075394154394[/C][/ROW]
[ROW][C]19[/C][C]754[/C][C]1256.35942724446[/C][C]-502.359427244458[/C][/ROW]
[ROW][C]20[/C][C]760[/C][C]1028.43268285001[/C][C]-268.432682850010[/C][/ROW]
[ROW][C]21[/C][C]715[/C][C]1071.31431656251[/C][C]-356.314316562514[/C][/ROW]
[ROW][C]22[/C][C]855[/C][C]1253.75893393566[/C][C]-398.758933935659[/C][/ROW]
[ROW][C]23[/C][C]971[/C][C]1018.24150647733[/C][C]-47.2415064773303[/C][/ROW]
[ROW][C]24[/C][C]815[/C][C]1009.71354350964[/C][C]-194.713543509635[/C][/ROW]
[ROW][C]25[/C][C]915[/C][C]1048.28006942312[/C][C]-133.280069423118[/C][/ROW]
[ROW][C]26[/C][C]843[/C][C]1034.69041122445[/C][C]-191.690411224455[/C][/ROW]
[ROW][C]27[/C][C]761[/C][C]1014.27205040528[/C][C]-253.272050405278[/C][/ROW]
[ROW][C]28[/C][C]1858[/C][C]1864.40755848404[/C][C]-6.4075584840416[/C][/ROW]
[ROW][C]29[/C][C]2968[/C][C]1890.61702402758[/C][C]1077.38297597242[/C][/ROW]
[ROW][C]30[/C][C]4061[/C][C]1981.20565836747[/C][C]2079.79434163253[/C][/ROW]
[ROW][C]31[/C][C]3661[/C][C]1076.39106091919[/C][C]2584.60893908081[/C][/ROW]
[ROW][C]32[/C][C]3269[/C][C]1222.16913104713[/C][C]2046.83086895287[/C][/ROW]
[ROW][C]33[/C][C]2857[/C][C]1429.60795014985[/C][C]1427.39204985015[/C][/ROW]
[ROW][C]34[/C][C]2568[/C][C]1892.25294110882[/C][C]675.747058891177[/C][/ROW]
[ROW][C]35[/C][C]2274[/C][C]1912.41895570618[/C][C]361.581044293823[/C][/ROW]
[ROW][C]36[/C][C]1987[/C][C]1772.07795251764[/C][C]214.922047482356[/C][/ROW]
[ROW][C]37[/C][C]683[/C][C]1956.19662333999[/C][C]-1273.19662333999[/C][/ROW]
[ROW][C]38[/C][C]381[/C][C]1765.2482088613[/C][C]-1384.2482088613[/C][/ROW]
[ROW][C]39[/C][C]71[/C][C]1561.79859879052[/C][C]-1490.79859879052[/C][/ROW]
[ROW][C]40[/C][C]1772[/C][C]3071.85565013228[/C][C]-1299.85565013228[/C][/ROW]
[ROW][C]41[/C][C]3485[/C][C]3829.64255993234[/C][C]-344.642559932339[/C][/ROW]
[ROW][C]42[/C][C]5181[/C][C]4404.72405087655[/C][C]776.275949123447[/C][/ROW]
[ROW][C]43[/C][C]4479[/C][C]2988.20475036706[/C][C]1490.79524963294[/C][/ROW]
[ROW][C]44[/C][C]3782[/C][C]2518.14827136534[/C][C]1263.85172863466[/C][/ROW]
[ROW][C]45[/C][C]3067[/C][C]2244.13752371150[/C][C]822.862476288496[/C][/ROW]
[ROW][C]46[/C][C]2489[/C][C]2247.78703064133[/C][C]241.212969358671[/C][/ROW]
[ROW][C]47[/C][C]1903[/C][C]2064.61354447124[/C][C]-161.613544471244[/C][/ROW]
[ROW][C]48[/C][C]1330[/C][C]1808.93008153061[/C][C]-478.930081530609[/C][/ROW]
[ROW][C]49[/C][C]736[/C][C]1159.81561172641[/C][C]-423.815611726414[/C][/ROW]
[ROW][C]50[/C][C]483[/C][C]942.078553689241[/C][C]-459.078553689241[/C][/ROW]
[ROW][C]51[/C][C]242[/C][C]697.289305379152[/C][C]-455.289305379152[/C][/ROW]
[ROW][C]52[/C][C]1334[/C][C]2394.35176643172[/C][C]-1060.35176643172[/C][/ROW]
[ROW][C]53[/C][C]2423[/C][C]3683.39617061049[/C][C]-1260.39617061049[/C][/ROW]
[ROW][C]54[/C][C]3523[/C][C]4735.9693980243[/C][C]-1212.9693980243[/C][/ROW]
[ROW][C]55[/C][C]2986[/C][C]3536.81343804411[/C][C]-550.813438044111[/C][/ROW]
[ROW][C]56[/C][C]2462[/C][C]2814.69982590468[/C][C]-352.699825904685[/C][/ROW]
[ROW][C]57[/C][C]1908[/C][C]2249.49004861305[/C][C]-341.490048613054[/C][/ROW]
[ROW][C]58[/C][C]1575[/C][C]1917.43744973985[/C][C]-342.437449739849[/C][/ROW]
[ROW][C]59[/C][C]1237[/C][C]1561.28894104293[/C][C]-324.288941042926[/C][/ROW]
[ROW][C]60[/C][C]904[/C][C]1212.35135642901[/C][C]-308.351356429009[/C][/ROW]
[/TABLE]
Source: https://freestatistics.org/blog/index.php?pk=63808&T=2

Globally Unique Identifier (entire table): ba.freestatistics.org/blog/index.php?pk=63808&T=2

As an alternative you can also use a QR Code:  

The GUIDs for individual cells are displayed in the table below:

Interpolation Forecasts of Exponential Smoothing
tObservedFittedResiduals
131092831.122281907311260.877718092689
141092884.385368902543207.614631097457
151087926.685512139121160.314487860879
1620281820.45916588127207.540834118727
1720391905.54726232992133.452737670082
1820101945.4924605845664.5075394154394
197541256.35942724446-502.359427244458
207601028.43268285001-268.432682850010
217151071.31431656251-356.314316562514
228551253.75893393566-398.758933935659
239711018.24150647733-47.2415064773303
248151009.71354350964-194.713543509635
259151048.28006942312-133.280069423118
268431034.69041122445-191.690411224455
277611014.27205040528-253.272050405278
2818581864.40755848404-6.4075584840416
2929681890.617024027581077.38297597242
3040611981.205658367472079.79434163253
3136611076.391060919192584.60893908081
3232691222.169131047132046.83086895287
3328571429.607950149851427.39204985015
3425681892.25294110882675.747058891177
3522741912.41895570618361.581044293823
3619871772.07795251764214.922047482356
376831956.19662333999-1273.19662333999
383811765.2482088613-1384.2482088613
39711561.79859879052-1490.79859879052
4017723071.85565013228-1299.85565013228
4134853829.64255993234-344.642559932339
4251814404.72405087655776.275949123447
4344792988.204750367061490.79524963294
4437822518.148271365341263.85172863466
4530672244.13752371150822.862476288496
4624892247.78703064133241.212969358671
4719032064.61354447124-161.613544471244
4813301808.93008153061-478.930081530609
497361159.81561172641-423.815611726414
50483942.078553689241-459.078553689241
51242697.289305379152-455.289305379152
5213342394.35176643172-1060.35176643172
5324233683.39617061049-1260.39617061049
5435234735.9693980243-1212.9693980243
5529863536.81343804411-550.813438044111
5624622814.69982590468-352.699825904685
5719082249.49004861305-341.490048613054
5815751917.43744973985-342.437449739849
5912371561.28894104293-324.288941042926
609041212.35135642901-308.351356429009


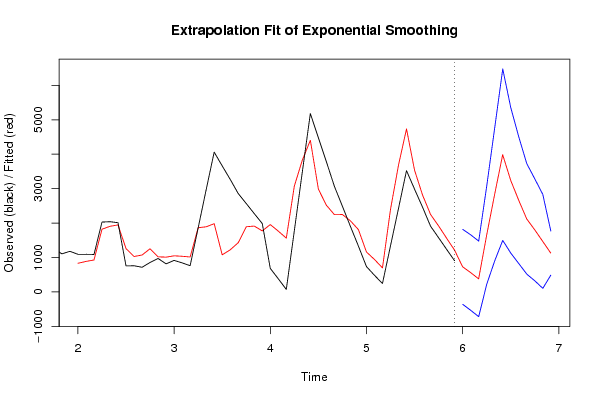
Extrapolation Forecasts of Exponential Smoothing
tForecast95% Lower Bound95% Upper Bound
61728.991369435192-360.1373556098361818.12009448022
62561.081187886313-535.1491328180951657.31150859072
63378.292057814204-719.4562266023211476.04034223073
641646.10196258095220.0877201730833072.11620498881
652837.25490505638903.1431326175734771.36667749518
663986.153909966871496.228544691166476.07927524258
673240.544716633421127.633183193385353.45625007346
682662.48403200613823.4463771260664501.5216868862
692119.55097013216515.5808491679853723.52109109634
701803.01609395140322.1508937327763283.88129417002
711466.04944222245102.6221296556482829.47675478924
721126.79135778182487.5204574958031766.06225806784

\begin{tabular}{lllllllll}
\hline
Extrapolation Forecasts of Exponential Smoothing \tabularnewline
t & Forecast & 95% Lower Bound & 95% Upper Bound \tabularnewline
61 & 728.991369435192 & -360.137355609836 & 1818.12009448022 \tabularnewline
62 & 561.081187886313 & -535.149132818095 & 1657.31150859072 \tabularnewline
63 & 378.292057814204 & -719.456226602321 & 1476.04034223073 \tabularnewline
64 & 1646.10196258095 & 220.087720173083 & 3072.11620498881 \tabularnewline
65 & 2837.25490505638 & 903.143132617573 & 4771.36667749518 \tabularnewline
66 & 3986.15390996687 & 1496.22854469116 & 6476.07927524258 \tabularnewline
67 & 3240.54471663342 & 1127.63318319338 & 5353.45625007346 \tabularnewline
68 & 2662.48403200613 & 823.446377126066 & 4501.5216868862 \tabularnewline
69 & 2119.55097013216 & 515.580849167985 & 3723.52109109634 \tabularnewline
70 & 1803.01609395140 & 322.150893732776 & 3283.88129417002 \tabularnewline
71 & 1466.04944222245 & 102.622129655648 & 2829.47675478924 \tabularnewline
72 & 1126.79135778182 & 487.520457495803 & 1766.06225806784 \tabularnewline
\hline
\end{tabular}
%Source: https://freestatistics.org/blog/index.php?pk=63808&T=3

[TABLE]
[ROW][C]Extrapolation Forecasts of Exponential Smoothing[/C][/ROW]
[ROW][C]t[/C][C]Forecast[/C][C]95% Lower Bound[/C][C]95% Upper Bound[/C][/ROW]
[ROW][C]61[/C][C]728.991369435192[/C][C]-360.137355609836[/C][C]1818.12009448022[/C][/ROW]
[ROW][C]62[/C][C]561.081187886313[/C][C]-535.149132818095[/C][C]1657.31150859072[/C][/ROW]
[ROW][C]63[/C][C]378.292057814204[/C][C]-719.456226602321[/C][C]1476.04034223073[/C][/ROW]
[ROW][C]64[/C][C]1646.10196258095[/C][C]220.087720173083[/C][C]3072.11620498881[/C][/ROW]
[ROW][C]65[/C][C]2837.25490505638[/C][C]903.143132617573[/C][C]4771.36667749518[/C][/ROW]
[ROW][C]66[/C][C]3986.15390996687[/C][C]1496.22854469116[/C][C]6476.07927524258[/C][/ROW]
[ROW][C]67[/C][C]3240.54471663342[/C][C]1127.63318319338[/C][C]5353.45625007346[/C][/ROW]
[ROW][C]68[/C][C]2662.48403200613[/C][C]823.446377126066[/C][C]4501.5216868862[/C][/ROW]
[ROW][C]69[/C][C]2119.55097013216[/C][C]515.580849167985[/C][C]3723.52109109634[/C][/ROW]
[ROW][C]70[/C][C]1803.01609395140[/C][C]322.150893732776[/C][C]3283.88129417002[/C][/ROW]
[ROW][C]71[/C][C]1466.04944222245[/C][C]102.622129655648[/C][C]2829.47675478924[/C][/ROW]
[ROW][C]72[/C][C]1126.79135778182[/C][C]487.520457495803[/C][C]1766.06225806784[/C][/ROW]
[/TABLE]
Source: https://freestatistics.org/blog/index.php?pk=63808&T=3

Globally Unique Identifier (entire table): ba.freestatistics.org/blog/index.php?pk=63808&T=3

As an alternative you can also use a QR Code:  

The GUIDs for individual cells are displayed in the table below:

Extrapolation Forecasts of Exponential Smoothing
tForecast95% Lower Bound95% Upper Bound
61728.991369435192-360.1373556098361818.12009448022
62561.081187886313-535.1491328180951657.31150859072
63378.292057814204-719.4562266023211476.04034223073
641646.10196258095220.0877201730833072.11620498881
652837.25490505638903.1431326175734771.36667749518
663986.153909966871496.228544691166476.07927524258
673240.544716633421127.633183193385353.45625007346
682662.48403200613823.4463771260664501.5216868862
692119.55097013216515.5808491679853723.52109109634
701803.01609395140322.1508937327763283.88129417002
711466.04944222245102.6221296556482829.47675478924
721126.79135778182487.5204574958031766.06225806784


Parameters (Session):
par1 = multiplicative ; par2 = 12 ;
Parameters (R input):
par1 = 12 ; par2 = Triple ; par3 = multiplicative ;
R code (references can be found in the software module):
par1 <- as.numeric(par1)
if (par2 == 'Single') K <- 1
if (par2 == 'Double') K <- 2
if (par2 == 'Triple') K <- par1
nx <- length(x)
nxmK <- nx - K
x <- ts(x, frequency = par1)
if (par2 == 'Single') fit <- HoltWinters(x, gamma=0, beta=0)
if (par2 == 'Double') fit <- HoltWinters(x, gamma=0)
if (par2 == 'Triple') fit <- HoltWinters(x, seasonal=par3)
fit
myresid <- x - fit$fitted[,'xhat']
bitmap(file='test1.png')
op <- par(mfrow=c(2,1))
plot(fit,ylab='Observed (black) / Fitted (red)',main='Interpolation Fit of Exponential Smoothing')
plot(myresid,ylab='Residuals',main='Interpolation Prediction Errors')
par(op)
dev.off()
bitmap(file='test2.png')
p <- predict(fit, par1, prediction.interval=TRUE)
np <- length(p[,1])
plot(fit,p,ylab='Observed (black) / Fitted (red)',main='Extrapolation Fit of Exponential Smoothing')
dev.off()
bitmap(file='test3.png')
op <- par(mfrow = c(2,2))
acf(as.numeric(myresid),lag.max = nx/2,main='Residual ACF')
spectrum(myresid,main='Residals Periodogram')
cpgram(myresid,main='Residal Cumulative Periodogram')
qqnorm(myresid,main='Residual Normal QQ Plot')
qqline(myresid)
par(op)
dev.off()
load(file='createtable')
a<-table.start()
a<-table.row.start(a)
a<-table.element(a,'Estimated Parameters of Exponential Smoothing',2,TRUE)
a<-table.row.end(a)
a<-table.row.start(a)
a<-table.element(a,'Parameter',header=TRUE)
a<-table.element(a,'Value',header=TRUE)
a<-table.row.end(a)
a<-table.row.start(a)
a<-table.element(a,'alpha',header=TRUE)
a<-table.element(a,fit$alpha)
a<-table.row.end(a)
a<-table.row.start(a)
a<-table.element(a,'beta',header=TRUE)
a<-table.element(a,fit$beta)
a<-table.row.end(a)
a<-table.row.start(a)
a<-table.element(a,'gamma',header=TRUE)
a<-table.element(a,fit$gamma)
a<-table.row.end(a)
a<-table.end(a)
table.save(a,file='mytable.tab')
a<-table.start()
a<-table.row.start(a)
a<-table.element(a,'Interpolation Forecasts of Exponential Smoothing',4,TRUE)
a<-table.row.end(a)
a<-table.row.start(a)
a<-table.element(a,'t',header=TRUE)
a<-table.element(a,'Observed',header=TRUE)
a<-table.element(a,'Fitted',header=TRUE)
a<-table.element(a,'Residuals',header=TRUE)
a<-table.row.end(a)
for (i in 1:nxmK) {
a<-table.row.start(a)
a<-table.element(a,i+K,header=TRUE)
a<-table.element(a,x[i+K])
a<-table.element(a,fit$fitted[i,'xhat'])
a<-table.element(a,myresid[i])
a<-table.row.end(a)
}
a<-table.end(a)
table.save(a,file='mytable1.tab')
a<-table.start()
a<-table.row.start(a)
a<-table.element(a,'Extrapolation Forecasts of Exponential Smoothing',4,TRUE)
a<-table.row.end(a)
a<-table.row.start(a)
a<-table.element(a,'t',header=TRUE)
a<-table.element(a,'Forecast',header=TRUE)
a<-table.element(a,'95% Lower Bound',header=TRUE)
a<-table.element(a,'95% Upper Bound',header=TRUE)
a<-table.row.end(a)
for (i in 1:np) {
a<-table.row.start(a)
a<-table.element(a,nx+i,header=TRUE)
a<-table.element(a,p[i,'fit'])
a<-table.element(a,p[i,'lwr'])
a<-table.element(a,p[i,'upr'])
a<-table.row.end(a)
}
a<-table.end(a)
table.save(a,file='mytable2.tab')