Free Statistics

of Irreproducible Research!

Author's title

Author*The author of this computation has been verified*
R Software Modulerwasp_autocorrelation.wasp
Title produced by software(Partial) Autocorrelation Function
Date of computationFri, 04 Dec 2009 08:58:28 -0700
Cite this page as followsStatistical Computations at FreeStatistics.org, Office for Research Development and Education, URL https://freestatistics.org/blog/index.php?v=date/2009/Dec/04/t1259942345d32v2krdzub1s9x.htm/, Retrieved Sun, 28 Apr 2024 05:41:52 +0000
Statistical Computations at FreeStatistics.org, Office for Research Development and Education, URL https://freestatistics.org/blog/index.php?pk=63811, Retrieved Sun, 28 Apr 2024 05:41:52 +0000
QR Codes:

Original text written by user:
IsPrivate?No (this computation is public)
User-defined keywords
Estimated Impact125
Family? (F = Feedback message, R = changed R code, M = changed R Module, P = changed Parameters, D = changed Data)
-     [Univariate Data Series] [data set] [2008-12-01 19:54:57] [b98453cac15ba1066b407e146608df68]
- RMP   [(Partial) Autocorrelation Function] [] [2009-11-27 14:46:03] [b98453cac15ba1066b407e146608df68]
-   PD      [(Partial) Autocorrelation Function] [PACF en ACF] [2009-12-04 15:58:28] [154177ed6b2613a730375f7d341441cf] [Current]
-   P         [(Partial) Autocorrelation Function] [PACF en ACF] [2009-12-04 16:03:38] [075a06058fde559dd021d126a2b15a40]
- RMP           [ARIMA Backward Selection] [ARIMA Backward Es...] [2009-12-10 10:49:45] [075a06058fde559dd021d126a2b15a40]
Feedback Forum

Post a new message
Dataseries X:
136
133
126
120
114
116
153
162
161
149
139
135
130
127
122
117
112
113
149
157
157
147
137
132
125
123
117
114
111
112
144
150
149
134
123
116
117
111
105
102
95
93
124
130
124
115
106
105
105
101
95
93
84
87
116
120
117
109
105
107
109


Summary of computational transaction
Raw Inputview raw input (R code)
Raw Outputview raw output of R engine
Computing time1 seconds
R Server'Gwilym Jenkins' @ 72.249.127.135

\begin{tabular}{lllllllll}
\hline
Summary of computational transaction \tabularnewline
Raw Input & view raw input (R code)  \tabularnewline
Raw Output & view raw output of R engine  \tabularnewline
Computing time & 1 seconds \tabularnewline
R Server & 'Gwilym Jenkins' @ 72.249.127.135 \tabularnewline
\hline
\end{tabular}
%Source: https://freestatistics.org/blog/index.php?pk=63811&T=0

[TABLE]
[ROW][C]Summary of computational transaction[/C][/ROW]
[ROW][C]Raw Input[/C][C]view raw input (R code) [/C][/ROW]
[ROW][C]Raw Output[/C][C]view raw output of R engine [/C][/ROW]
[ROW][C]Computing time[/C][C]1 seconds[/C][/ROW]
[ROW][C]R Server[/C][C]'Gwilym Jenkins' @ 72.249.127.135[/C][/ROW]
[/TABLE]
Source: https://freestatistics.org/blog/index.php?pk=63811&T=0

Globally Unique Identifier (entire table): ba.freestatistics.org/blog/index.php?pk=63811&T=0

As an alternative you can also use a QR Code:  

The GUIDs for individual cells are displayed in the table below:

Summary of computational transaction
Raw Inputview raw input (R code)
Raw Outputview raw output of R engine
Computing time1 seconds
R Server'Gwilym Jenkins' @ 72.249.127.135


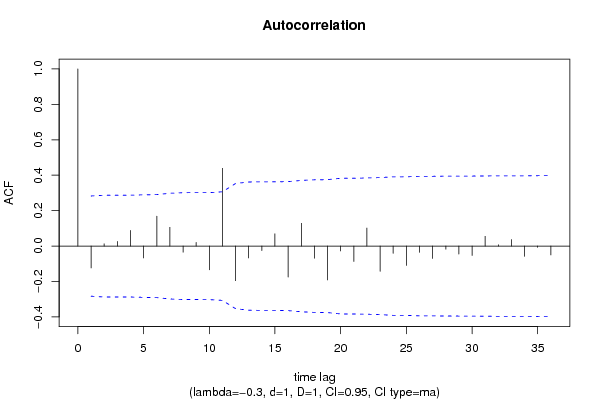
Autocorrelation Function
Time lag kACF(k)T-STATP-value
1-0.123188-0.85350.198819
20.0127520.08830.464985
30.0263210.18240.428036
40.0882450.61140.271917
5-0.067097-0.46490.322066
60.1687211.16890.124101
70.1059050.73370.233342
8-0.034298-0.23760.406592
90.0207730.14390.443082
10-0.133714-0.92640.179437
110.4392413.04310.001895
12-0.19547-1.35430.090998
13-0.067151-0.46520.321933
14-0.025259-0.1750.430909
150.0697290.48310.315612
16-0.17502-1.21260.115614
170.1284710.89010.188933
18-0.068348-0.47350.31899
19-0.190975-1.32310.096033
20-0.026952-0.18670.426329
21-0.086464-0.5990.275982
220.1019810.70650.241632
23-0.142493-0.98720.164242
24-0.040816-0.28280.389281
25-0.10884-0.75410.227247
26-0.035362-0.2450.403753
27-0.069763-0.48330.315528
28-0.017512-0.12130.45197
29-0.04513-0.31270.377943
30-0.052628-0.36460.358499
310.0550710.38150.352241
320.0072420.05020.480095
330.0371010.2570.399121
34-0.057523-0.39850.346002
35-0.007089-0.04910.480515
36-0.049943-0.3460.365422

\begin{tabular}{lllllllll}
\hline
Autocorrelation Function \tabularnewline
Time lag k & ACF(k) & T-STAT & P-value \tabularnewline
1 & -0.123188 & -0.8535 & 0.198819 \tabularnewline
2 & 0.012752 & 0.0883 & 0.464985 \tabularnewline
3 & 0.026321 & 0.1824 & 0.428036 \tabularnewline
4 & 0.088245 & 0.6114 & 0.271917 \tabularnewline
5 & -0.067097 & -0.4649 & 0.322066 \tabularnewline
6 & 0.168721 & 1.1689 & 0.124101 \tabularnewline
7 & 0.105905 & 0.7337 & 0.233342 \tabularnewline
8 & -0.034298 & -0.2376 & 0.406592 \tabularnewline
9 & 0.020773 & 0.1439 & 0.443082 \tabularnewline
10 & -0.133714 & -0.9264 & 0.179437 \tabularnewline
11 & 0.439241 & 3.0431 & 0.001895 \tabularnewline
12 & -0.19547 & -1.3543 & 0.090998 \tabularnewline
13 & -0.067151 & -0.4652 & 0.321933 \tabularnewline
14 & -0.025259 & -0.175 & 0.430909 \tabularnewline
15 & 0.069729 & 0.4831 & 0.315612 \tabularnewline
16 & -0.17502 & -1.2126 & 0.115614 \tabularnewline
17 & 0.128471 & 0.8901 & 0.188933 \tabularnewline
18 & -0.068348 & -0.4735 & 0.31899 \tabularnewline
19 & -0.190975 & -1.3231 & 0.096033 \tabularnewline
20 & -0.026952 & -0.1867 & 0.426329 \tabularnewline
21 & -0.086464 & -0.599 & 0.275982 \tabularnewline
22 & 0.101981 & 0.7065 & 0.241632 \tabularnewline
23 & -0.142493 & -0.9872 & 0.164242 \tabularnewline
24 & -0.040816 & -0.2828 & 0.389281 \tabularnewline
25 & -0.10884 & -0.7541 & 0.227247 \tabularnewline
26 & -0.035362 & -0.245 & 0.403753 \tabularnewline
27 & -0.069763 & -0.4833 & 0.315528 \tabularnewline
28 & -0.017512 & -0.1213 & 0.45197 \tabularnewline
29 & -0.04513 & -0.3127 & 0.377943 \tabularnewline
30 & -0.052628 & -0.3646 & 0.358499 \tabularnewline
31 & 0.055071 & 0.3815 & 0.352241 \tabularnewline
32 & 0.007242 & 0.0502 & 0.480095 \tabularnewline
33 & 0.037101 & 0.257 & 0.399121 \tabularnewline
34 & -0.057523 & -0.3985 & 0.346002 \tabularnewline
35 & -0.007089 & -0.0491 & 0.480515 \tabularnewline
36 & -0.049943 & -0.346 & 0.365422 \tabularnewline
\hline
\end{tabular}
%Source: https://freestatistics.org/blog/index.php?pk=63811&T=1

[TABLE]
[ROW][C]Autocorrelation Function[/C][/ROW]
[ROW][C]Time lag k[/C][C]ACF(k)[/C][C]T-STAT[/C][C]P-value[/C][/ROW]
[ROW][C]1[/C][C]-0.123188[/C][C]-0.8535[/C][C]0.198819[/C][/ROW]
[ROW][C]2[/C][C]0.012752[/C][C]0.0883[/C][C]0.464985[/C][/ROW]
[ROW][C]3[/C][C]0.026321[/C][C]0.1824[/C][C]0.428036[/C][/ROW]
[ROW][C]4[/C][C]0.088245[/C][C]0.6114[/C][C]0.271917[/C][/ROW]
[ROW][C]5[/C][C]-0.067097[/C][C]-0.4649[/C][C]0.322066[/C][/ROW]
[ROW][C]6[/C][C]0.168721[/C][C]1.1689[/C][C]0.124101[/C][/ROW]
[ROW][C]7[/C][C]0.105905[/C][C]0.7337[/C][C]0.233342[/C][/ROW]
[ROW][C]8[/C][C]-0.034298[/C][C]-0.2376[/C][C]0.406592[/C][/ROW]
[ROW][C]9[/C][C]0.020773[/C][C]0.1439[/C][C]0.443082[/C][/ROW]
[ROW][C]10[/C][C]-0.133714[/C][C]-0.9264[/C][C]0.179437[/C][/ROW]
[ROW][C]11[/C][C]0.439241[/C][C]3.0431[/C][C]0.001895[/C][/ROW]
[ROW][C]12[/C][C]-0.19547[/C][C]-1.3543[/C][C]0.090998[/C][/ROW]
[ROW][C]13[/C][C]-0.067151[/C][C]-0.4652[/C][C]0.321933[/C][/ROW]
[ROW][C]14[/C][C]-0.025259[/C][C]-0.175[/C][C]0.430909[/C][/ROW]
[ROW][C]15[/C][C]0.069729[/C][C]0.4831[/C][C]0.315612[/C][/ROW]
[ROW][C]16[/C][C]-0.17502[/C][C]-1.2126[/C][C]0.115614[/C][/ROW]
[ROW][C]17[/C][C]0.128471[/C][C]0.8901[/C][C]0.188933[/C][/ROW]
[ROW][C]18[/C][C]-0.068348[/C][C]-0.4735[/C][C]0.31899[/C][/ROW]
[ROW][C]19[/C][C]-0.190975[/C][C]-1.3231[/C][C]0.096033[/C][/ROW]
[ROW][C]20[/C][C]-0.026952[/C][C]-0.1867[/C][C]0.426329[/C][/ROW]
[ROW][C]21[/C][C]-0.086464[/C][C]-0.599[/C][C]0.275982[/C][/ROW]
[ROW][C]22[/C][C]0.101981[/C][C]0.7065[/C][C]0.241632[/C][/ROW]
[ROW][C]23[/C][C]-0.142493[/C][C]-0.9872[/C][C]0.164242[/C][/ROW]
[ROW][C]24[/C][C]-0.040816[/C][C]-0.2828[/C][C]0.389281[/C][/ROW]
[ROW][C]25[/C][C]-0.10884[/C][C]-0.7541[/C][C]0.227247[/C][/ROW]
[ROW][C]26[/C][C]-0.035362[/C][C]-0.245[/C][C]0.403753[/C][/ROW]
[ROW][C]27[/C][C]-0.069763[/C][C]-0.4833[/C][C]0.315528[/C][/ROW]
[ROW][C]28[/C][C]-0.017512[/C][C]-0.1213[/C][C]0.45197[/C][/ROW]
[ROW][C]29[/C][C]-0.04513[/C][C]-0.3127[/C][C]0.377943[/C][/ROW]
[ROW][C]30[/C][C]-0.052628[/C][C]-0.3646[/C][C]0.358499[/C][/ROW]
[ROW][C]31[/C][C]0.055071[/C][C]0.3815[/C][C]0.352241[/C][/ROW]
[ROW][C]32[/C][C]0.007242[/C][C]0.0502[/C][C]0.480095[/C][/ROW]
[ROW][C]33[/C][C]0.037101[/C][C]0.257[/C][C]0.399121[/C][/ROW]
[ROW][C]34[/C][C]-0.057523[/C][C]-0.3985[/C][C]0.346002[/C][/ROW]
[ROW][C]35[/C][C]-0.007089[/C][C]-0.0491[/C][C]0.480515[/C][/ROW]
[ROW][C]36[/C][C]-0.049943[/C][C]-0.346[/C][C]0.365422[/C][/ROW]
[/TABLE]
Source: https://freestatistics.org/blog/index.php?pk=63811&T=1

Globally Unique Identifier (entire table): ba.freestatistics.org/blog/index.php?pk=63811&T=1

As an alternative you can also use a QR Code:  

The GUIDs for individual cells are displayed in the table below:

Autocorrelation Function
Time lag kACF(k)T-STATP-value
1-0.123188-0.85350.198819
20.0127520.08830.464985
30.0263210.18240.428036
40.0882450.61140.271917
5-0.067097-0.46490.322066
60.1687211.16890.124101
70.1059050.73370.233342
8-0.034298-0.23760.406592
90.0207730.14390.443082
10-0.133714-0.92640.179437
110.4392413.04310.001895
12-0.19547-1.35430.090998
13-0.067151-0.46520.321933
14-0.025259-0.1750.430909
150.0697290.48310.315612
16-0.17502-1.21260.115614
170.1284710.89010.188933
18-0.068348-0.47350.31899
19-0.190975-1.32310.096033
20-0.026952-0.18670.426329
21-0.086464-0.5990.275982
220.1019810.70650.241632
23-0.142493-0.98720.164242
24-0.040816-0.28280.389281
25-0.10884-0.75410.227247
26-0.035362-0.2450.403753
27-0.069763-0.48330.315528
28-0.017512-0.12130.45197
29-0.04513-0.31270.377943
30-0.052628-0.36460.358499
310.0550710.38150.352241
320.0072420.05020.480095
330.0371010.2570.399121
34-0.057523-0.39850.346002
35-0.007089-0.04910.480515
36-0.049943-0.3460.365422


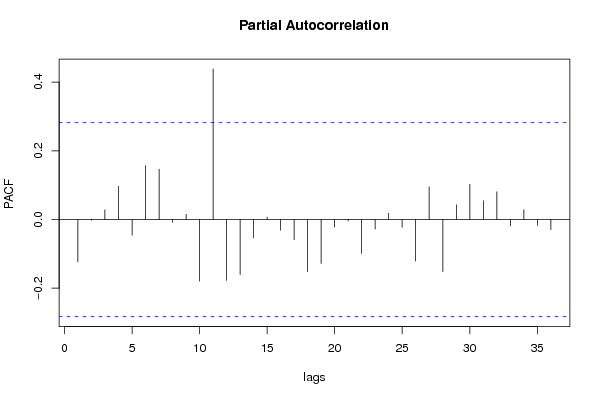
Partial Autocorrelation Function
Time lag kPACF(k)T-STATP-value
1-0.123188-0.85350.198819
2-0.002461-0.01710.493233
30.0280170.19410.423454
40.0964710.66840.253549
5-0.045765-0.31710.376282
60.1567241.08580.141492
70.146221.0130.15806
8-0.008785-0.06090.47586
90.0148560.10290.459226
10-0.179412-1.2430.109952
110.438133.03550.001936
12-0.177421-1.22920.112492
13-0.160337-1.11080.136084
14-0.053301-0.36930.356771
150.0069270.0480.480961
16-0.031285-0.21670.414662
17-0.058832-0.40760.342689
18-0.151954-1.05280.14886
19-0.12785-0.88580.190079
20-0.021611-0.14970.440806
21-0.004503-0.03120.487622
22-0.098791-0.68440.248492
23-0.027895-0.19330.423786
240.0181920.1260.450113
25-0.022702-0.15730.437841
26-0.121078-0.83890.202855
270.0947160.65620.257411
28-0.151608-1.05040.149403
290.0424990.29440.384844
300.1025960.71080.240321
310.0546470.37860.353326
320.0804380.55730.28996
33-0.018771-0.13010.448534
340.0284880.19740.422186
35-0.017306-0.11990.452532
36-0.029525-0.20460.419392

\begin{tabular}{lllllllll}
\hline
Partial Autocorrelation Function \tabularnewline
Time lag k & PACF(k) & T-STAT & P-value \tabularnewline
1 & -0.123188 & -0.8535 & 0.198819 \tabularnewline
2 & -0.002461 & -0.0171 & 0.493233 \tabularnewline
3 & 0.028017 & 0.1941 & 0.423454 \tabularnewline
4 & 0.096471 & 0.6684 & 0.253549 \tabularnewline
5 & -0.045765 & -0.3171 & 0.376282 \tabularnewline
6 & 0.156724 & 1.0858 & 0.141492 \tabularnewline
7 & 0.14622 & 1.013 & 0.15806 \tabularnewline
8 & -0.008785 & -0.0609 & 0.47586 \tabularnewline
9 & 0.014856 & 0.1029 & 0.459226 \tabularnewline
10 & -0.179412 & -1.243 & 0.109952 \tabularnewline
11 & 0.43813 & 3.0355 & 0.001936 \tabularnewline
12 & -0.177421 & -1.2292 & 0.112492 \tabularnewline
13 & -0.160337 & -1.1108 & 0.136084 \tabularnewline
14 & -0.053301 & -0.3693 & 0.356771 \tabularnewline
15 & 0.006927 & 0.048 & 0.480961 \tabularnewline
16 & -0.031285 & -0.2167 & 0.414662 \tabularnewline
17 & -0.058832 & -0.4076 & 0.342689 \tabularnewline
18 & -0.151954 & -1.0528 & 0.14886 \tabularnewline
19 & -0.12785 & -0.8858 & 0.190079 \tabularnewline
20 & -0.021611 & -0.1497 & 0.440806 \tabularnewline
21 & -0.004503 & -0.0312 & 0.487622 \tabularnewline
22 & -0.098791 & -0.6844 & 0.248492 \tabularnewline
23 & -0.027895 & -0.1933 & 0.423786 \tabularnewline
24 & 0.018192 & 0.126 & 0.450113 \tabularnewline
25 & -0.022702 & -0.1573 & 0.437841 \tabularnewline
26 & -0.121078 & -0.8389 & 0.202855 \tabularnewline
27 & 0.094716 & 0.6562 & 0.257411 \tabularnewline
28 & -0.151608 & -1.0504 & 0.149403 \tabularnewline
29 & 0.042499 & 0.2944 & 0.384844 \tabularnewline
30 & 0.102596 & 0.7108 & 0.240321 \tabularnewline
31 & 0.054647 & 0.3786 & 0.353326 \tabularnewline
32 & 0.080438 & 0.5573 & 0.28996 \tabularnewline
33 & -0.018771 & -0.1301 & 0.448534 \tabularnewline
34 & 0.028488 & 0.1974 & 0.422186 \tabularnewline
35 & -0.017306 & -0.1199 & 0.452532 \tabularnewline
36 & -0.029525 & -0.2046 & 0.419392 \tabularnewline
\hline
\end{tabular}
%Source: https://freestatistics.org/blog/index.php?pk=63811&T=2

[TABLE]
[ROW][C]Partial Autocorrelation Function[/C][/ROW]
[ROW][C]Time lag k[/C][C]PACF(k)[/C][C]T-STAT[/C][C]P-value[/C][/ROW]
[ROW][C]1[/C][C]-0.123188[/C][C]-0.8535[/C][C]0.198819[/C][/ROW]
[ROW][C]2[/C][C]-0.002461[/C][C]-0.0171[/C][C]0.493233[/C][/ROW]
[ROW][C]3[/C][C]0.028017[/C][C]0.1941[/C][C]0.423454[/C][/ROW]
[ROW][C]4[/C][C]0.096471[/C][C]0.6684[/C][C]0.253549[/C][/ROW]
[ROW][C]5[/C][C]-0.045765[/C][C]-0.3171[/C][C]0.376282[/C][/ROW]
[ROW][C]6[/C][C]0.156724[/C][C]1.0858[/C][C]0.141492[/C][/ROW]
[ROW][C]7[/C][C]0.14622[/C][C]1.013[/C][C]0.15806[/C][/ROW]
[ROW][C]8[/C][C]-0.008785[/C][C]-0.0609[/C][C]0.47586[/C][/ROW]
[ROW][C]9[/C][C]0.014856[/C][C]0.1029[/C][C]0.459226[/C][/ROW]
[ROW][C]10[/C][C]-0.179412[/C][C]-1.243[/C][C]0.109952[/C][/ROW]
[ROW][C]11[/C][C]0.43813[/C][C]3.0355[/C][C]0.001936[/C][/ROW]
[ROW][C]12[/C][C]-0.177421[/C][C]-1.2292[/C][C]0.112492[/C][/ROW]
[ROW][C]13[/C][C]-0.160337[/C][C]-1.1108[/C][C]0.136084[/C][/ROW]
[ROW][C]14[/C][C]-0.053301[/C][C]-0.3693[/C][C]0.356771[/C][/ROW]
[ROW][C]15[/C][C]0.006927[/C][C]0.048[/C][C]0.480961[/C][/ROW]
[ROW][C]16[/C][C]-0.031285[/C][C]-0.2167[/C][C]0.414662[/C][/ROW]
[ROW][C]17[/C][C]-0.058832[/C][C]-0.4076[/C][C]0.342689[/C][/ROW]
[ROW][C]18[/C][C]-0.151954[/C][C]-1.0528[/C][C]0.14886[/C][/ROW]
[ROW][C]19[/C][C]-0.12785[/C][C]-0.8858[/C][C]0.190079[/C][/ROW]
[ROW][C]20[/C][C]-0.021611[/C][C]-0.1497[/C][C]0.440806[/C][/ROW]
[ROW][C]21[/C][C]-0.004503[/C][C]-0.0312[/C][C]0.487622[/C][/ROW]
[ROW][C]22[/C][C]-0.098791[/C][C]-0.6844[/C][C]0.248492[/C][/ROW]
[ROW][C]23[/C][C]-0.027895[/C][C]-0.1933[/C][C]0.423786[/C][/ROW]
[ROW][C]24[/C][C]0.018192[/C][C]0.126[/C][C]0.450113[/C][/ROW]
[ROW][C]25[/C][C]-0.022702[/C][C]-0.1573[/C][C]0.437841[/C][/ROW]
[ROW][C]26[/C][C]-0.121078[/C][C]-0.8389[/C][C]0.202855[/C][/ROW]
[ROW][C]27[/C][C]0.094716[/C][C]0.6562[/C][C]0.257411[/C][/ROW]
[ROW][C]28[/C][C]-0.151608[/C][C]-1.0504[/C][C]0.149403[/C][/ROW]
[ROW][C]29[/C][C]0.042499[/C][C]0.2944[/C][C]0.384844[/C][/ROW]
[ROW][C]30[/C][C]0.102596[/C][C]0.7108[/C][C]0.240321[/C][/ROW]
[ROW][C]31[/C][C]0.054647[/C][C]0.3786[/C][C]0.353326[/C][/ROW]
[ROW][C]32[/C][C]0.080438[/C][C]0.5573[/C][C]0.28996[/C][/ROW]
[ROW][C]33[/C][C]-0.018771[/C][C]-0.1301[/C][C]0.448534[/C][/ROW]
[ROW][C]34[/C][C]0.028488[/C][C]0.1974[/C][C]0.422186[/C][/ROW]
[ROW][C]35[/C][C]-0.017306[/C][C]-0.1199[/C][C]0.452532[/C][/ROW]
[ROW][C]36[/C][C]-0.029525[/C][C]-0.2046[/C][C]0.419392[/C][/ROW]
[/TABLE]
Source: https://freestatistics.org/blog/index.php?pk=63811&T=2

Globally Unique Identifier (entire table): ba.freestatistics.org/blog/index.php?pk=63811&T=2

As an alternative you can also use a QR Code:  

The GUIDs for individual cells are displayed in the table below:

Partial Autocorrelation Function
Time lag kPACF(k)T-STATP-value
1-0.123188-0.85350.198819
2-0.002461-0.01710.493233
30.0280170.19410.423454
40.0964710.66840.253549
5-0.045765-0.31710.376282
60.1567241.08580.141492
70.146221.0130.15806
8-0.008785-0.06090.47586
90.0148560.10290.459226
10-0.179412-1.2430.109952
110.438133.03550.001936
12-0.177421-1.22920.112492
13-0.160337-1.11080.136084
14-0.053301-0.36930.356771
150.0069270.0480.480961
16-0.031285-0.21670.414662
17-0.058832-0.40760.342689
18-0.151954-1.05280.14886
19-0.12785-0.88580.190079
20-0.021611-0.14970.440806
21-0.004503-0.03120.487622
22-0.098791-0.68440.248492
23-0.027895-0.19330.423786
240.0181920.1260.450113
25-0.022702-0.15730.437841
26-0.121078-0.83890.202855
270.0947160.65620.257411
28-0.151608-1.05040.149403
290.0424990.29440.384844
300.1025960.71080.240321
310.0546470.37860.353326
320.0804380.55730.28996
33-0.018771-0.13010.448534
340.0284880.19740.422186
35-0.017306-0.11990.452532
36-0.029525-0.20460.419392


Parameters (Session):
par1 = 36 ; par2 = -0.3 ; par3 = 1 ; par4 = 1 ; par5 = 12 ; par6 = MA ; par7 = 0.95 ;
Parameters (R input):
par1 = 36 ; par2 = -0.3 ; par3 = 1 ; par4 = 1 ; par5 = 12 ; par6 = MA ; par7 = 0.95 ;
R code (references can be found in the software module):
if (par1 == 'Default') {
par1 = 10*log10(length(x))
} else {
par1 <- as.numeric(par1)
}
par2 <- as.numeric(par2)
par3 <- as.numeric(par3)
par4 <- as.numeric(par4)
par5 <- as.numeric(par5)
if (par6 == 'White Noise') par6 <- 'white' else par6 <- 'ma'
par7 <- as.numeric(par7)
if (par2 == 0) {
x <- log(x)
} else {
x <- (x ^ par2 - 1) / par2
}
if (par3 > 0) x <- diff(x,lag=1,difference=par3)
if (par4 > 0) x <- diff(x,lag=par5,difference=par4)
bitmap(file='pic1.png')
racf <- acf(x, par1, main='Autocorrelation', xlab='time lag', ylab='ACF', ci.type=par6, ci=par7, sub=paste('(lambda=',par2,', d=',par3,', D=',par4,', CI=', par7, ', CI type=',par6,')',sep=''))
dev.off()
bitmap(file='pic2.png')
rpacf <- pacf(x,par1,main='Partial Autocorrelation',xlab='lags',ylab='PACF')
dev.off()
(myacf <- c(racf$acf))
(mypacf <- c(rpacf$acf))
lengthx <- length(x)
sqrtn <- sqrt(lengthx)
load(file='createtable')
a<-table.start()
a<-table.row.start(a)
a<-table.element(a,'Autocorrelation Function',4,TRUE)
a<-table.row.end(a)
a<-table.row.start(a)
a<-table.element(a,'Time lag k',header=TRUE)
a<-table.element(a,hyperlink('basics.htm','ACF(k)','click here for more information about the Autocorrelation Function'),header=TRUE)
a<-table.element(a,'T-STAT',header=TRUE)
a<-table.element(a,'P-value',header=TRUE)
a<-table.row.end(a)
for (i in 2:(par1+1)) {
a<-table.row.start(a)
a<-table.element(a,i-1,header=TRUE)
a<-table.element(a,round(myacf[i],6))
mytstat <- myacf[i]*sqrtn
a<-table.element(a,round(mytstat,4))
a<-table.element(a,round(1-pt(abs(mytstat),lengthx),6))
a<-table.row.end(a)
}
a<-table.end(a)
table.save(a,file='mytable.tab')
a<-table.start()
a<-table.row.start(a)
a<-table.element(a,'Partial Autocorrelation Function',4,TRUE)
a<-table.row.end(a)
a<-table.row.start(a)
a<-table.element(a,'Time lag k',header=TRUE)
a<-table.element(a,hyperlink('basics.htm','PACF(k)','click here for more information about the Partial Autocorrelation Function'),header=TRUE)
a<-table.element(a,'T-STAT',header=TRUE)
a<-table.element(a,'P-value',header=TRUE)
a<-table.row.end(a)
for (i in 1:par1) {
a<-table.row.start(a)
a<-table.element(a,i,header=TRUE)
a<-table.element(a,round(mypacf[i],6))
mytstat <- mypacf[i]*sqrtn
a<-table.element(a,round(mytstat,4))
a<-table.element(a,round(1-pt(abs(mytstat),lengthx),6))
a<-table.row.end(a)
}
a<-table.end(a)
table.save(a,file='mytable1.tab')