Free Statistics

of Irreproducible Research!

Author's title

Author*The author of this computation has been verified*
R Software Modulerwasp_autocorrelation.wasp
Title produced by software(Partial) Autocorrelation Function
Date of computationFri, 04 Dec 2009 08:59:16 -0700
Cite this page as followsStatistical Computations at FreeStatistics.org, Office for Research Development and Education, URL https://freestatistics.org/blog/index.php?v=date/2009/Dec/04/t125994239877r9c6zqddetx9p.htm/, Retrieved Sat, 27 Apr 2024 22:36:03 +0000
Statistical Computations at FreeStatistics.org, Office for Research Development and Education, URL https://freestatistics.org/blog/index.php?pk=63812, Retrieved Sat, 27 Apr 2024 22:36:03 +0000
QR Codes:

Original text written by user:
IsPrivate?No (this computation is public)
User-defined keywords
Estimated Impact95
Family? (F = Feedback message, R = changed R code, M = changed R Module, P = changed Parameters, D = changed Data)
-     [Univariate Data Series] [data set] [2008-12-01 19:54:57] [b98453cac15ba1066b407e146608df68]
- RMP   [(Partial) Autocorrelation Function] [] [2009-11-27 14:46:03] [b98453cac15ba1066b407e146608df68]
-    D      [(Partial) Autocorrelation Function] [] [2009-12-04 15:59:16] [8af916b6a531ec49628252b0a0ece045] [Current]
Feedback Forum

Post a new message
Dataseries X:
100,6
104,3
120,4
107,5
102,9
125,6
107,5
108,8
128,4
121,1
119,5
128,7
108,7
105,5
119,8
111,3
110,6
120,1
97,5
107,7
127,3
117,2
119,8
116,2
111
112,4
130,6
109,1
118,8
123,9
101,6
112,8
128
129,6
125,8
119,5
115,7
113,6
129,7
112
116,8
127
112,1
114,2
121,1
131,6
125
120,4
117,7
117,5
120,6
127,5
112,3
124,5
115,2
104,7
130,9
129,2
113,5
125,6
107,6


Summary of computational transaction
Raw Inputview raw input (R code)
Raw Outputview raw output of R engine
Computing time1 seconds
R Server'Gwilym Jenkins' @ 72.249.127.135

\begin{tabular}{lllllllll}
\hline
Summary of computational transaction \tabularnewline
Raw Input & view raw input (R code)  \tabularnewline
Raw Output & view raw output of R engine  \tabularnewline
Computing time & 1 seconds \tabularnewline
R Server & 'Gwilym Jenkins' @ 72.249.127.135 \tabularnewline
\hline
\end{tabular}
%Source: https://freestatistics.org/blog/index.php?pk=63812&T=0

[TABLE]
[ROW][C]Summary of computational transaction[/C][/ROW]
[ROW][C]Raw Input[/C][C]view raw input (R code) [/C][/ROW]
[ROW][C]Raw Output[/C][C]view raw output of R engine [/C][/ROW]
[ROW][C]Computing time[/C][C]1 seconds[/C][/ROW]
[ROW][C]R Server[/C][C]'Gwilym Jenkins' @ 72.249.127.135[/C][/ROW]
[/TABLE]
Source: https://freestatistics.org/blog/index.php?pk=63812&T=0

Globally Unique Identifier (entire table): ba.freestatistics.org/blog/index.php?pk=63812&T=0

As an alternative you can also use a QR Code:  

The GUIDs for individual cells are displayed in the table below:

Summary of computational transaction
Raw Inputview raw input (R code)
Raw Outputview raw output of R engine
Computing time1 seconds
R Server'Gwilym Jenkins' @ 72.249.127.135


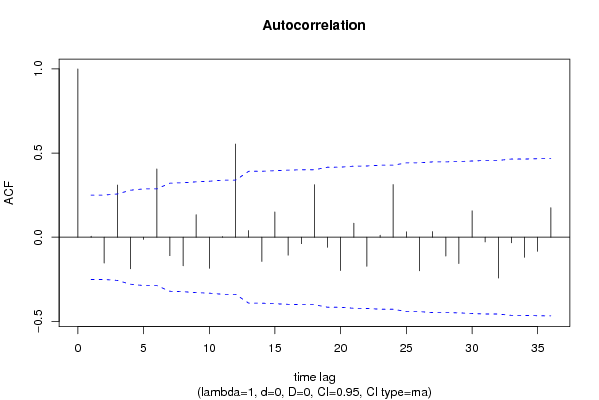
Autocorrelation Function
Time lag kACF(k)T-STATP-value
10.0060240.04710.481313
2-0.153797-1.20120.117159
30.3098332.41990.00926
4-0.187785-1.46660.073804
5-0.01319-0.1030.459145
60.4060173.17110.001188
7-0.109564-0.85570.19775
8-0.170037-1.3280.094558
90.1339951.04650.149722
10-0.184632-1.4420.077206
110.0035960.02810.488843
120.5534654.32272.9e-05
130.0395270.30870.379295
14-0.143647-1.12190.133147
150.1505331.17570.122141
16-0.106585-0.83250.2042
17-0.038148-0.29790.383377
180.3123592.43960.008813
19-0.060096-0.46940.320242
20-0.197992-1.54640.063594
210.0837350.6540.257787
22-0.172728-1.3490.091154
230.0118090.09220.463408
240.3129792.44440.008706
250.0320050.250.401726
26-0.199479-1.5580.062206
270.0340460.26590.395604
28-0.112262-0.87680.192018
29-0.156446-1.22190.113226
300.1570411.22650.112357
31-0.02837-0.22160.412692
32-0.242495-1.89390.031488
33-0.033064-0.25820.398546
34-0.119326-0.9320.177513
35-0.08386-0.6550.257476
360.1756951.37220.08751

\begin{tabular}{lllllllll}
\hline
Autocorrelation Function \tabularnewline
Time lag k & ACF(k) & T-STAT & P-value \tabularnewline
1 & 0.006024 & 0.0471 & 0.481313 \tabularnewline
2 & -0.153797 & -1.2012 & 0.117159 \tabularnewline
3 & 0.309833 & 2.4199 & 0.00926 \tabularnewline
4 & -0.187785 & -1.4666 & 0.073804 \tabularnewline
5 & -0.01319 & -0.103 & 0.459145 \tabularnewline
6 & 0.406017 & 3.1711 & 0.001188 \tabularnewline
7 & -0.109564 & -0.8557 & 0.19775 \tabularnewline
8 & -0.170037 & -1.328 & 0.094558 \tabularnewline
9 & 0.133995 & 1.0465 & 0.149722 \tabularnewline
10 & -0.184632 & -1.442 & 0.077206 \tabularnewline
11 & 0.003596 & 0.0281 & 0.488843 \tabularnewline
12 & 0.553465 & 4.3227 & 2.9e-05 \tabularnewline
13 & 0.039527 & 0.3087 & 0.379295 \tabularnewline
14 & -0.143647 & -1.1219 & 0.133147 \tabularnewline
15 & 0.150533 & 1.1757 & 0.122141 \tabularnewline
16 & -0.106585 & -0.8325 & 0.2042 \tabularnewline
17 & -0.038148 & -0.2979 & 0.383377 \tabularnewline
18 & 0.312359 & 2.4396 & 0.008813 \tabularnewline
19 & -0.060096 & -0.4694 & 0.320242 \tabularnewline
20 & -0.197992 & -1.5464 & 0.063594 \tabularnewline
21 & 0.083735 & 0.654 & 0.257787 \tabularnewline
22 & -0.172728 & -1.349 & 0.091154 \tabularnewline
23 & 0.011809 & 0.0922 & 0.463408 \tabularnewline
24 & 0.312979 & 2.4444 & 0.008706 \tabularnewline
25 & 0.032005 & 0.25 & 0.401726 \tabularnewline
26 & -0.199479 & -1.558 & 0.062206 \tabularnewline
27 & 0.034046 & 0.2659 & 0.395604 \tabularnewline
28 & -0.112262 & -0.8768 & 0.192018 \tabularnewline
29 & -0.156446 & -1.2219 & 0.113226 \tabularnewline
30 & 0.157041 & 1.2265 & 0.112357 \tabularnewline
31 & -0.02837 & -0.2216 & 0.412692 \tabularnewline
32 & -0.242495 & -1.8939 & 0.031488 \tabularnewline
33 & -0.033064 & -0.2582 & 0.398546 \tabularnewline
34 & -0.119326 & -0.932 & 0.177513 \tabularnewline
35 & -0.08386 & -0.655 & 0.257476 \tabularnewline
36 & 0.175695 & 1.3722 & 0.08751 \tabularnewline
\hline
\end{tabular}
%Source: https://freestatistics.org/blog/index.php?pk=63812&T=1

[TABLE]
[ROW][C]Autocorrelation Function[/C][/ROW]
[ROW][C]Time lag k[/C][C]ACF(k)[/C][C]T-STAT[/C][C]P-value[/C][/ROW]
[ROW][C]1[/C][C]0.006024[/C][C]0.0471[/C][C]0.481313[/C][/ROW]
[ROW][C]2[/C][C]-0.153797[/C][C]-1.2012[/C][C]0.117159[/C][/ROW]
[ROW][C]3[/C][C]0.309833[/C][C]2.4199[/C][C]0.00926[/C][/ROW]
[ROW][C]4[/C][C]-0.187785[/C][C]-1.4666[/C][C]0.073804[/C][/ROW]
[ROW][C]5[/C][C]-0.01319[/C][C]-0.103[/C][C]0.459145[/C][/ROW]
[ROW][C]6[/C][C]0.406017[/C][C]3.1711[/C][C]0.001188[/C][/ROW]
[ROW][C]7[/C][C]-0.109564[/C][C]-0.8557[/C][C]0.19775[/C][/ROW]
[ROW][C]8[/C][C]-0.170037[/C][C]-1.328[/C][C]0.094558[/C][/ROW]
[ROW][C]9[/C][C]0.133995[/C][C]1.0465[/C][C]0.149722[/C][/ROW]
[ROW][C]10[/C][C]-0.184632[/C][C]-1.442[/C][C]0.077206[/C][/ROW]
[ROW][C]11[/C][C]0.003596[/C][C]0.0281[/C][C]0.488843[/C][/ROW]
[ROW][C]12[/C][C]0.553465[/C][C]4.3227[/C][C]2.9e-05[/C][/ROW]
[ROW][C]13[/C][C]0.039527[/C][C]0.3087[/C][C]0.379295[/C][/ROW]
[ROW][C]14[/C][C]-0.143647[/C][C]-1.1219[/C][C]0.133147[/C][/ROW]
[ROW][C]15[/C][C]0.150533[/C][C]1.1757[/C][C]0.122141[/C][/ROW]
[ROW][C]16[/C][C]-0.106585[/C][C]-0.8325[/C][C]0.2042[/C][/ROW]
[ROW][C]17[/C][C]-0.038148[/C][C]-0.2979[/C][C]0.383377[/C][/ROW]
[ROW][C]18[/C][C]0.312359[/C][C]2.4396[/C][C]0.008813[/C][/ROW]
[ROW][C]19[/C][C]-0.060096[/C][C]-0.4694[/C][C]0.320242[/C][/ROW]
[ROW][C]20[/C][C]-0.197992[/C][C]-1.5464[/C][C]0.063594[/C][/ROW]
[ROW][C]21[/C][C]0.083735[/C][C]0.654[/C][C]0.257787[/C][/ROW]
[ROW][C]22[/C][C]-0.172728[/C][C]-1.349[/C][C]0.091154[/C][/ROW]
[ROW][C]23[/C][C]0.011809[/C][C]0.0922[/C][C]0.463408[/C][/ROW]
[ROW][C]24[/C][C]0.312979[/C][C]2.4444[/C][C]0.008706[/C][/ROW]
[ROW][C]25[/C][C]0.032005[/C][C]0.25[/C][C]0.401726[/C][/ROW]
[ROW][C]26[/C][C]-0.199479[/C][C]-1.558[/C][C]0.062206[/C][/ROW]
[ROW][C]27[/C][C]0.034046[/C][C]0.2659[/C][C]0.395604[/C][/ROW]
[ROW][C]28[/C][C]-0.112262[/C][C]-0.8768[/C][C]0.192018[/C][/ROW]
[ROW][C]29[/C][C]-0.156446[/C][C]-1.2219[/C][C]0.113226[/C][/ROW]
[ROW][C]30[/C][C]0.157041[/C][C]1.2265[/C][C]0.112357[/C][/ROW]
[ROW][C]31[/C][C]-0.02837[/C][C]-0.2216[/C][C]0.412692[/C][/ROW]
[ROW][C]32[/C][C]-0.242495[/C][C]-1.8939[/C][C]0.031488[/C][/ROW]
[ROW][C]33[/C][C]-0.033064[/C][C]-0.2582[/C][C]0.398546[/C][/ROW]
[ROW][C]34[/C][C]-0.119326[/C][C]-0.932[/C][C]0.177513[/C][/ROW]
[ROW][C]35[/C][C]-0.08386[/C][C]-0.655[/C][C]0.257476[/C][/ROW]
[ROW][C]36[/C][C]0.175695[/C][C]1.3722[/C][C]0.08751[/C][/ROW]
[/TABLE]
Source: https://freestatistics.org/blog/index.php?pk=63812&T=1

Globally Unique Identifier (entire table): ba.freestatistics.org/blog/index.php?pk=63812&T=1

As an alternative you can also use a QR Code:  

The GUIDs for individual cells are displayed in the table below:

Autocorrelation Function
Time lag kACF(k)T-STATP-value
10.0060240.04710.481313
2-0.153797-1.20120.117159
30.3098332.41990.00926
4-0.187785-1.46660.073804
5-0.01319-0.1030.459145
60.4060173.17110.001188
7-0.109564-0.85570.19775
8-0.170037-1.3280.094558
90.1339951.04650.149722
10-0.184632-1.4420.077206
110.0035960.02810.488843
120.5534654.32272.9e-05
130.0395270.30870.379295
14-0.143647-1.12190.133147
150.1505331.17570.122141
16-0.106585-0.83250.2042
17-0.038148-0.29790.383377
180.3123592.43960.008813
19-0.060096-0.46940.320242
20-0.197992-1.54640.063594
210.0837350.6540.257787
22-0.172728-1.3490.091154
230.0118090.09220.463408
240.3129792.44440.008706
250.0320050.250.401726
26-0.199479-1.5580.062206
270.0340460.26590.395604
28-0.112262-0.87680.192018
29-0.156446-1.22190.113226
300.1570411.22650.112357
31-0.02837-0.22160.412692
32-0.242495-1.89390.031488
33-0.033064-0.25820.398546
34-0.119326-0.9320.177513
35-0.08386-0.6550.257476
360.1756951.37220.08751


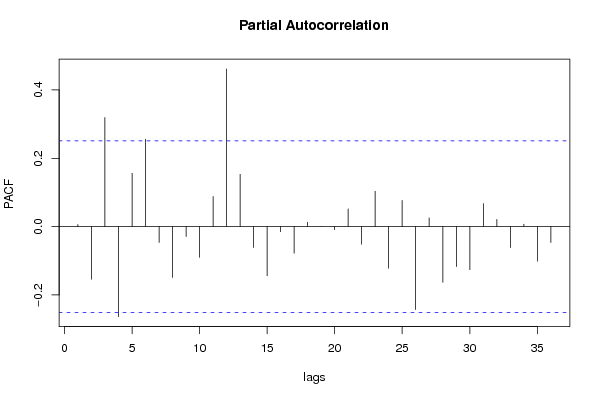
Partial Autocorrelation Function
Time lag kPACF(k)T-STATP-value
10.0060240.04710.481313
2-0.153839-1.20150.117097
30.3193992.49460.007667
4-0.263589-2.05870.021901
50.1559651.21810.113934
60.2558951.99860.025057
7-0.046181-0.36070.35979
8-0.14865-1.1610.125084
9-0.028611-0.22350.411963
10-0.089939-0.70240.242537
110.0880710.68790.247076
120.4615523.60480.000315
130.1531271.1960.11817
14-0.061105-0.47720.317446
15-0.143898-1.12390.132734
16-0.014765-0.11530.454287
17-0.077653-0.60650.273221
180.0129650.10130.459837
190.0002880.00220.499107
20-0.008967-0.070.472198
210.0517020.40380.343885
22-0.051529-0.40250.344379
230.1036310.80940.210721
24-0.121621-0.94990.172959
250.0767590.59950.275527
26-0.242941-1.89740.031253
270.0253020.19760.422001
28-0.163237-1.27490.103586
29-0.116913-0.91310.182386
30-0.126226-0.98590.164048
310.0674540.52680.300109
320.0210050.16410.435114
33-0.061477-0.48020.316418
340.0072680.05680.477459
35-0.101377-0.79180.215779
36-0.046401-0.36240.359152

\begin{tabular}{lllllllll}
\hline
Partial Autocorrelation Function \tabularnewline
Time lag k & PACF(k) & T-STAT & P-value \tabularnewline
1 & 0.006024 & 0.0471 & 0.481313 \tabularnewline
2 & -0.153839 & -1.2015 & 0.117097 \tabularnewline
3 & 0.319399 & 2.4946 & 0.007667 \tabularnewline
4 & -0.263589 & -2.0587 & 0.021901 \tabularnewline
5 & 0.155965 & 1.2181 & 0.113934 \tabularnewline
6 & 0.255895 & 1.9986 & 0.025057 \tabularnewline
7 & -0.046181 & -0.3607 & 0.35979 \tabularnewline
8 & -0.14865 & -1.161 & 0.125084 \tabularnewline
9 & -0.028611 & -0.2235 & 0.411963 \tabularnewline
10 & -0.089939 & -0.7024 & 0.242537 \tabularnewline
11 & 0.088071 & 0.6879 & 0.247076 \tabularnewline
12 & 0.461552 & 3.6048 & 0.000315 \tabularnewline
13 & 0.153127 & 1.196 & 0.11817 \tabularnewline
14 & -0.061105 & -0.4772 & 0.317446 \tabularnewline
15 & -0.143898 & -1.1239 & 0.132734 \tabularnewline
16 & -0.014765 & -0.1153 & 0.454287 \tabularnewline
17 & -0.077653 & -0.6065 & 0.273221 \tabularnewline
18 & 0.012965 & 0.1013 & 0.459837 \tabularnewline
19 & 0.000288 & 0.0022 & 0.499107 \tabularnewline
20 & -0.008967 & -0.07 & 0.472198 \tabularnewline
21 & 0.051702 & 0.4038 & 0.343885 \tabularnewline
22 & -0.051529 & -0.4025 & 0.344379 \tabularnewline
23 & 0.103631 & 0.8094 & 0.210721 \tabularnewline
24 & -0.121621 & -0.9499 & 0.172959 \tabularnewline
25 & 0.076759 & 0.5995 & 0.275527 \tabularnewline
26 & -0.242941 & -1.8974 & 0.031253 \tabularnewline
27 & 0.025302 & 0.1976 & 0.422001 \tabularnewline
28 & -0.163237 & -1.2749 & 0.103586 \tabularnewline
29 & -0.116913 & -0.9131 & 0.182386 \tabularnewline
30 & -0.126226 & -0.9859 & 0.164048 \tabularnewline
31 & 0.067454 & 0.5268 & 0.300109 \tabularnewline
32 & 0.021005 & 0.1641 & 0.435114 \tabularnewline
33 & -0.061477 & -0.4802 & 0.316418 \tabularnewline
34 & 0.007268 & 0.0568 & 0.477459 \tabularnewline
35 & -0.101377 & -0.7918 & 0.215779 \tabularnewline
36 & -0.046401 & -0.3624 & 0.359152 \tabularnewline
\hline
\end{tabular}
%Source: https://freestatistics.org/blog/index.php?pk=63812&T=2

[TABLE]
[ROW][C]Partial Autocorrelation Function[/C][/ROW]
[ROW][C]Time lag k[/C][C]PACF(k)[/C][C]T-STAT[/C][C]P-value[/C][/ROW]
[ROW][C]1[/C][C]0.006024[/C][C]0.0471[/C][C]0.481313[/C][/ROW]
[ROW][C]2[/C][C]-0.153839[/C][C]-1.2015[/C][C]0.117097[/C][/ROW]
[ROW][C]3[/C][C]0.319399[/C][C]2.4946[/C][C]0.007667[/C][/ROW]
[ROW][C]4[/C][C]-0.263589[/C][C]-2.0587[/C][C]0.021901[/C][/ROW]
[ROW][C]5[/C][C]0.155965[/C][C]1.2181[/C][C]0.113934[/C][/ROW]
[ROW][C]6[/C][C]0.255895[/C][C]1.9986[/C][C]0.025057[/C][/ROW]
[ROW][C]7[/C][C]-0.046181[/C][C]-0.3607[/C][C]0.35979[/C][/ROW]
[ROW][C]8[/C][C]-0.14865[/C][C]-1.161[/C][C]0.125084[/C][/ROW]
[ROW][C]9[/C][C]-0.028611[/C][C]-0.2235[/C][C]0.411963[/C][/ROW]
[ROW][C]10[/C][C]-0.089939[/C][C]-0.7024[/C][C]0.242537[/C][/ROW]
[ROW][C]11[/C][C]0.088071[/C][C]0.6879[/C][C]0.247076[/C][/ROW]
[ROW][C]12[/C][C]0.461552[/C][C]3.6048[/C][C]0.000315[/C][/ROW]
[ROW][C]13[/C][C]0.153127[/C][C]1.196[/C][C]0.11817[/C][/ROW]
[ROW][C]14[/C][C]-0.061105[/C][C]-0.4772[/C][C]0.317446[/C][/ROW]
[ROW][C]15[/C][C]-0.143898[/C][C]-1.1239[/C][C]0.132734[/C][/ROW]
[ROW][C]16[/C][C]-0.014765[/C][C]-0.1153[/C][C]0.454287[/C][/ROW]
[ROW][C]17[/C][C]-0.077653[/C][C]-0.6065[/C][C]0.273221[/C][/ROW]
[ROW][C]18[/C][C]0.012965[/C][C]0.1013[/C][C]0.459837[/C][/ROW]
[ROW][C]19[/C][C]0.000288[/C][C]0.0022[/C][C]0.499107[/C][/ROW]
[ROW][C]20[/C][C]-0.008967[/C][C]-0.07[/C][C]0.472198[/C][/ROW]
[ROW][C]21[/C][C]0.051702[/C][C]0.4038[/C][C]0.343885[/C][/ROW]
[ROW][C]22[/C][C]-0.051529[/C][C]-0.4025[/C][C]0.344379[/C][/ROW]
[ROW][C]23[/C][C]0.103631[/C][C]0.8094[/C][C]0.210721[/C][/ROW]
[ROW][C]24[/C][C]-0.121621[/C][C]-0.9499[/C][C]0.172959[/C][/ROW]
[ROW][C]25[/C][C]0.076759[/C][C]0.5995[/C][C]0.275527[/C][/ROW]
[ROW][C]26[/C][C]-0.242941[/C][C]-1.8974[/C][C]0.031253[/C][/ROW]
[ROW][C]27[/C][C]0.025302[/C][C]0.1976[/C][C]0.422001[/C][/ROW]
[ROW][C]28[/C][C]-0.163237[/C][C]-1.2749[/C][C]0.103586[/C][/ROW]
[ROW][C]29[/C][C]-0.116913[/C][C]-0.9131[/C][C]0.182386[/C][/ROW]
[ROW][C]30[/C][C]-0.126226[/C][C]-0.9859[/C][C]0.164048[/C][/ROW]
[ROW][C]31[/C][C]0.067454[/C][C]0.5268[/C][C]0.300109[/C][/ROW]
[ROW][C]32[/C][C]0.021005[/C][C]0.1641[/C][C]0.435114[/C][/ROW]
[ROW][C]33[/C][C]-0.061477[/C][C]-0.4802[/C][C]0.316418[/C][/ROW]
[ROW][C]34[/C][C]0.007268[/C][C]0.0568[/C][C]0.477459[/C][/ROW]
[ROW][C]35[/C][C]-0.101377[/C][C]-0.7918[/C][C]0.215779[/C][/ROW]
[ROW][C]36[/C][C]-0.046401[/C][C]-0.3624[/C][C]0.359152[/C][/ROW]
[/TABLE]
Source: https://freestatistics.org/blog/index.php?pk=63812&T=2

Globally Unique Identifier (entire table): ba.freestatistics.org/blog/index.php?pk=63812&T=2

As an alternative you can also use a QR Code:  

The GUIDs for individual cells are displayed in the table below:

Partial Autocorrelation Function
Time lag kPACF(k)T-STATP-value
10.0060240.04710.481313
2-0.153839-1.20150.117097
30.3193992.49460.007667
4-0.263589-2.05870.021901
50.1559651.21810.113934
60.2558951.99860.025057
7-0.046181-0.36070.35979
8-0.14865-1.1610.125084
9-0.028611-0.22350.411963
10-0.089939-0.70240.242537
110.0880710.68790.247076
120.4615523.60480.000315
130.1531271.1960.11817
14-0.061105-0.47720.317446
15-0.143898-1.12390.132734
16-0.014765-0.11530.454287
17-0.077653-0.60650.273221
180.0129650.10130.459837
190.0002880.00220.499107
20-0.008967-0.070.472198
210.0517020.40380.343885
22-0.051529-0.40250.344379
230.1036310.80940.210721
24-0.121621-0.94990.172959
250.0767590.59950.275527
26-0.242941-1.89740.031253
270.0253020.19760.422001
28-0.163237-1.27490.103586
29-0.116913-0.91310.182386
30-0.126226-0.98590.164048
310.0674540.52680.300109
320.0210050.16410.435114
33-0.061477-0.48020.316418
340.0072680.05680.477459
35-0.101377-0.79180.215779
36-0.046401-0.36240.359152


Parameters (Session):
par1 = 36 ; par2 = 1 ; par3 = 0 ; par4 = 0 ; par5 = 12 ; par6 = MA ; par7 = 0.95 ;
Parameters (R input):
par1 = 36 ; par2 = 1 ; par3 = 0 ; par4 = 0 ; par5 = 12 ; par6 = MA ; par7 = 0.95 ;
R code (references can be found in the software module):
if (par1 == 'Default') {
par1 = 10*log10(length(x))
} else {
par1 <- as.numeric(par1)
}
par2 <- as.numeric(par2)
par3 <- as.numeric(par3)
par4 <- as.numeric(par4)
par5 <- as.numeric(par5)
if (par6 == 'White Noise') par6 <- 'white' else par6 <- 'ma'
par7 <- as.numeric(par7)
if (par2 == 0) {
x <- log(x)
} else {
x <- (x ^ par2 - 1) / par2
}
if (par3 > 0) x <- diff(x,lag=1,difference=par3)
if (par4 > 0) x <- diff(x,lag=par5,difference=par4)
bitmap(file='pic1.png')
racf <- acf(x, par1, main='Autocorrelation', xlab='time lag', ylab='ACF', ci.type=par6, ci=par7, sub=paste('(lambda=',par2,', d=',par3,', D=',par4,', CI=', par7, ', CI type=',par6,')',sep=''))
dev.off()
bitmap(file='pic2.png')
rpacf <- pacf(x,par1,main='Partial Autocorrelation',xlab='lags',ylab='PACF')
dev.off()
(myacf <- c(racf$acf))
(mypacf <- c(rpacf$acf))
lengthx <- length(x)
sqrtn <- sqrt(lengthx)
load(file='createtable')
a<-table.start()
a<-table.row.start(a)
a<-table.element(a,'Autocorrelation Function',4,TRUE)
a<-table.row.end(a)
a<-table.row.start(a)
a<-table.element(a,'Time lag k',header=TRUE)
a<-table.element(a,hyperlink('basics.htm','ACF(k)','click here for more information about the Autocorrelation Function'),header=TRUE)
a<-table.element(a,'T-STAT',header=TRUE)
a<-table.element(a,'P-value',header=TRUE)
a<-table.row.end(a)
for (i in 2:(par1+1)) {
a<-table.row.start(a)
a<-table.element(a,i-1,header=TRUE)
a<-table.element(a,round(myacf[i],6))
mytstat <- myacf[i]*sqrtn
a<-table.element(a,round(mytstat,4))
a<-table.element(a,round(1-pt(abs(mytstat),lengthx),6))
a<-table.row.end(a)
}
a<-table.end(a)
table.save(a,file='mytable.tab')
a<-table.start()
a<-table.row.start(a)
a<-table.element(a,'Partial Autocorrelation Function',4,TRUE)
a<-table.row.end(a)
a<-table.row.start(a)
a<-table.element(a,'Time lag k',header=TRUE)
a<-table.element(a,hyperlink('basics.htm','PACF(k)','click here for more information about the Partial Autocorrelation Function'),header=TRUE)
a<-table.element(a,'T-STAT',header=TRUE)
a<-table.element(a,'P-value',header=TRUE)
a<-table.row.end(a)
for (i in 1:par1) {
a<-table.row.start(a)
a<-table.element(a,i,header=TRUE)
a<-table.element(a,round(mypacf[i],6))
mytstat <- mypacf[i]*sqrtn
a<-table.element(a,round(mytstat,4))
a<-table.element(a,round(1-pt(abs(mytstat),lengthx),6))
a<-table.row.end(a)
}
a<-table.end(a)
table.save(a,file='mytable1.tab')