Free Statistics

of Irreproducible Research!

Author's title

Author*The author of this computation has been verified*
R Software Modulerwasp_arimabackwardselection.wasp
Title produced by softwareARIMA Backward Selection
Date of computationFri, 04 Dec 2009 08:57:45 -0700
Cite this page as followsStatistical Computations at FreeStatistics.org, Office for Research Development and Education, URL https://freestatistics.org/blog/index.php?v=date/2009/Dec/04/t12599427924lnguy9ebvc2l1d.htm/, Retrieved Sun, 28 Apr 2024 09:26:55 +0000
Statistical Computations at FreeStatistics.org, Office for Research Development and Education, URL https://freestatistics.org/blog/index.php?pk=63821, Retrieved Sun, 28 Apr 2024 09:26:55 +0000
QR Codes:

Original text written by user:
IsPrivate?No (this computation is public)
User-defined keywordsShwWS9arima
Estimated Impact155
Family? (F = Feedback message, R = changed R code, M = changed R Module, P = changed Parameters, D = changed Data)
-     [Univariate Data Series] [data set] [2008-12-01 19:54:57] [b98453cac15ba1066b407e146608df68]
- RMP   [ARIMA Backward Selection] [] [2009-11-27 14:53:14] [b98453cac15ba1066b407e146608df68]
-   PD      [ARIMA Backward Selection] [WS9 arima] [2009-12-04 15:57:45] [51108381f3361ca8af49c4f74052c840] [Current]
-    D        [ARIMA Backward Selection] [Paper controle arima] [2009-12-20 18:19:33] [e0fc65a5811681d807296d590d5b45de]
-   PD          [ARIMA Backward Selection] [paper; toepassing...] [2009-12-21 14:58:20] [e0fc65a5811681d807296d590d5b45de]
-             [ARIMA Backward Selection] [workshop 9 ARIMA] [2010-12-03 09:09:23] [814f53995537cd15c528d8efbf1cf544]
Feedback Forum

Post a new message
Dataseries X:
58608
46865
51378
46235
47206
45382
41227
33795
31295
42625
33625
21538
56421
53152
53536
52408
41454
38271
35306
26414
31917
38030
27534
18387
50556
43901
48572
43899
37532
40357
35489
29027
34485
42598
30306
26451
47460
50104
61465
53726
39477
43895
31481
29896
33842
39120
33702
25094
51442
45594
52518
48564
41745
49585
32747
33379
35645
37034
35681
20972


Summary of computational transaction
Raw Inputview raw input (R code)
Raw Outputview raw output of R engine
Computing time9 seconds
R Server'Gwilym Jenkins' @ 72.249.127.135

\begin{tabular}{lllllllll}
\hline
Summary of computational transaction \tabularnewline
Raw Input & view raw input (R code)  \tabularnewline
Raw Output & view raw output of R engine  \tabularnewline
Computing time & 9 seconds \tabularnewline
R Server & 'Gwilym Jenkins' @ 72.249.127.135 \tabularnewline
\hline
\end{tabular}
%Source: https://freestatistics.org/blog/index.php?pk=63821&T=0

[TABLE]
[ROW][C]Summary of computational transaction[/C][/ROW]
[ROW][C]Raw Input[/C][C]view raw input (R code) [/C][/ROW]
[ROW][C]Raw Output[/C][C]view raw output of R engine [/C][/ROW]
[ROW][C]Computing time[/C][C]9 seconds[/C][/ROW]
[ROW][C]R Server[/C][C]'Gwilym Jenkins' @ 72.249.127.135[/C][/ROW]
[/TABLE]
Source: https://freestatistics.org/blog/index.php?pk=63821&T=0

Globally Unique Identifier (entire table): ba.freestatistics.org/blog/index.php?pk=63821&T=0

As an alternative you can also use a QR Code:  

The GUIDs for individual cells are displayed in the table below:

Summary of computational transaction
Raw Inputview raw input (R code)
Raw Outputview raw output of R engine
Computing time9 seconds
R Server'Gwilym Jenkins' @ 72.249.127.135


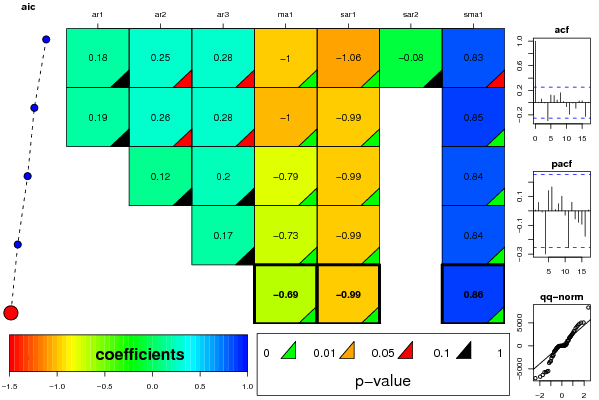
ARIMA Parameter Estimation and Backward Selection
Iterationar1ar2ar3ma1sar1sar2sma1
Estimates ( 1 )0.18180.25040.2843-1-1.0636-0.07760.8306
(p-val)(0.25 )(0.0965 )(0.0958 )(0 )(6e-04 )(0.7621 )(0.0587 )
Estimates ( 2 )0.18860.25580.2814-1-0.990800.8533
(p-val)(0.2289 )(0.0886 )(0.0975 )(0 )(0 )(NA )(1e-04 )
Estimates ( 3 )00.11970.2001-0.7882-0.989300.8364
(p-val)(NA )(0.5342 )(0.2947 )(0 )(0 )(NA )(0.0022 )
Estimates ( 4 )000.1667-0.7329-0.989100.8399
(p-val)(NA )(NA )(0.3449 )(0 )(0 )(NA )(0.0012 )
Estimates ( 5 )000-0.6948-0.988900.857
(p-val)(NA )(NA )(NA )(0 )(0 )(NA )(6e-04 )
Estimates ( 6 )NANANANANANANA
(p-val)(NA )(NA )(NA )(NA )(NA )(NA )(NA )
Estimates ( 7 )NANANANANANANA
(p-val)(NA )(NA )(NA )(NA )(NA )(NA )(NA )
Estimates ( 8 )NANANANANANANA
(p-val)(NA )(NA )(NA )(NA )(NA )(NA )(NA )
Estimates ( 9 )NANANANANANANA
(p-val)(NA )(NA )(NA )(NA )(NA )(NA )(NA )
Estimates ( 10 )NANANANANANANA
(p-val)(NA )(NA )(NA )(NA )(NA )(NA )(NA )
Estimates ( 11 )NANANANANANANA
(p-val)(NA )(NA )(NA )(NA )(NA )(NA )(NA )
Estimates ( 12 )NANANANANANANA
(p-val)(NA )(NA )(NA )(NA )(NA )(NA )(NA )
Estimates ( 13 )NANANANANANANA
(p-val)(NA )(NA )(NA )(NA )(NA )(NA )(NA )

\begin{tabular}{lllllllll}
\hline
ARIMA Parameter Estimation and Backward Selection \tabularnewline
Iteration & ar1 & ar2 & ar3 & ma1 & sar1 & sar2 & sma1 \tabularnewline
Estimates ( 1 ) & 0.1818 & 0.2504 & 0.2843 & -1 & -1.0636 & -0.0776 & 0.8306 \tabularnewline
(p-val) & (0.25 ) & (0.0965 ) & (0.0958 ) & (0 ) & (6e-04 ) & (0.7621 ) & (0.0587 ) \tabularnewline
Estimates ( 2 ) & 0.1886 & 0.2558 & 0.2814 & -1 & -0.9908 & 0 & 0.8533 \tabularnewline
(p-val) & (0.2289 ) & (0.0886 ) & (0.0975 ) & (0 ) & (0 ) & (NA ) & (1e-04 ) \tabularnewline
Estimates ( 3 ) & 0 & 0.1197 & 0.2001 & -0.7882 & -0.9893 & 0 & 0.8364 \tabularnewline
(p-val) & (NA ) & (0.5342 ) & (0.2947 ) & (0 ) & (0 ) & (NA ) & (0.0022 ) \tabularnewline
Estimates ( 4 ) & 0 & 0 & 0.1667 & -0.7329 & -0.9891 & 0 & 0.8399 \tabularnewline
(p-val) & (NA ) & (NA ) & (0.3449 ) & (0 ) & (0 ) & (NA ) & (0.0012 ) \tabularnewline
Estimates ( 5 ) & 0 & 0 & 0 & -0.6948 & -0.9889 & 0 & 0.857 \tabularnewline
(p-val) & (NA ) & (NA ) & (NA ) & (0 ) & (0 ) & (NA ) & (6e-04 ) \tabularnewline
Estimates ( 6 ) & NA & NA & NA & NA & NA & NA & NA \tabularnewline
(p-val) & (NA ) & (NA ) & (NA ) & (NA ) & (NA ) & (NA ) & (NA ) \tabularnewline
Estimates ( 7 ) & NA & NA & NA & NA & NA & NA & NA \tabularnewline
(p-val) & (NA ) & (NA ) & (NA ) & (NA ) & (NA ) & (NA ) & (NA ) \tabularnewline
Estimates ( 8 ) & NA & NA & NA & NA & NA & NA & NA \tabularnewline
(p-val) & (NA ) & (NA ) & (NA ) & (NA ) & (NA ) & (NA ) & (NA ) \tabularnewline
Estimates ( 9 ) & NA & NA & NA & NA & NA & NA & NA \tabularnewline
(p-val) & (NA ) & (NA ) & (NA ) & (NA ) & (NA ) & (NA ) & (NA ) \tabularnewline
Estimates ( 10 ) & NA & NA & NA & NA & NA & NA & NA \tabularnewline
(p-val) & (NA ) & (NA ) & (NA ) & (NA ) & (NA ) & (NA ) & (NA ) \tabularnewline
Estimates ( 11 ) & NA & NA & NA & NA & NA & NA & NA \tabularnewline
(p-val) & (NA ) & (NA ) & (NA ) & (NA ) & (NA ) & (NA ) & (NA ) \tabularnewline
Estimates ( 12 ) & NA & NA & NA & NA & NA & NA & NA \tabularnewline
(p-val) & (NA ) & (NA ) & (NA ) & (NA ) & (NA ) & (NA ) & (NA ) \tabularnewline
Estimates ( 13 ) & NA & NA & NA & NA & NA & NA & NA \tabularnewline
(p-val) & (NA ) & (NA ) & (NA ) & (NA ) & (NA ) & (NA ) & (NA ) \tabularnewline
\hline
\end{tabular}
%Source: https://freestatistics.org/blog/index.php?pk=63821&T=1

[TABLE]
[ROW][C]ARIMA Parameter Estimation and Backward Selection[/C][/ROW]
[ROW][C]Iteration[/C][C]ar1[/C][C]ar2[/C][C]ar3[/C][C]ma1[/C][C]sar1[/C][C]sar2[/C][C]sma1[/C][/ROW]
[ROW][C]Estimates ( 1 )[/C][C]0.1818[/C][C]0.2504[/C][C]0.2843[/C][C]-1[/C][C]-1.0636[/C][C]-0.0776[/C][C]0.8306[/C][/ROW]
[ROW][C](p-val)[/C][C](0.25 )[/C][C](0.0965 )[/C][C](0.0958 )[/C][C](0 )[/C][C](6e-04 )[/C][C](0.7621 )[/C][C](0.0587 )[/C][/ROW]
[ROW][C]Estimates ( 2 )[/C][C]0.1886[/C][C]0.2558[/C][C]0.2814[/C][C]-1[/C][C]-0.9908[/C][C]0[/C][C]0.8533[/C][/ROW]
[ROW][C](p-val)[/C][C](0.2289 )[/C][C](0.0886 )[/C][C](0.0975 )[/C][C](0 )[/C][C](0 )[/C][C](NA )[/C][C](1e-04 )[/C][/ROW]
[ROW][C]Estimates ( 3 )[/C][C]0[/C][C]0.1197[/C][C]0.2001[/C][C]-0.7882[/C][C]-0.9893[/C][C]0[/C][C]0.8364[/C][/ROW]
[ROW][C](p-val)[/C][C](NA )[/C][C](0.5342 )[/C][C](0.2947 )[/C][C](0 )[/C][C](0 )[/C][C](NA )[/C][C](0.0022 )[/C][/ROW]
[ROW][C]Estimates ( 4 )[/C][C]0[/C][C]0[/C][C]0.1667[/C][C]-0.7329[/C][C]-0.9891[/C][C]0[/C][C]0.8399[/C][/ROW]
[ROW][C](p-val)[/C][C](NA )[/C][C](NA )[/C][C](0.3449 )[/C][C](0 )[/C][C](0 )[/C][C](NA )[/C][C](0.0012 )[/C][/ROW]
[ROW][C]Estimates ( 5 )[/C][C]0[/C][C]0[/C][C]0[/C][C]-0.6948[/C][C]-0.9889[/C][C]0[/C][C]0.857[/C][/ROW]
[ROW][C](p-val)[/C][C](NA )[/C][C](NA )[/C][C](NA )[/C][C](0 )[/C][C](0 )[/C][C](NA )[/C][C](6e-04 )[/C][/ROW]
[ROW][C]Estimates ( 6 )[/C][C]NA[/C][C]NA[/C][C]NA[/C][C]NA[/C][C]NA[/C][C]NA[/C][C]NA[/C][/ROW]
[ROW][C](p-val)[/C][C](NA )[/C][C](NA )[/C][C](NA )[/C][C](NA )[/C][C](NA )[/C][C](NA )[/C][C](NA )[/C][/ROW]
[ROW][C]Estimates ( 7 )[/C][C]NA[/C][C]NA[/C][C]NA[/C][C]NA[/C][C]NA[/C][C]NA[/C][C]NA[/C][/ROW]
[ROW][C](p-val)[/C][C](NA )[/C][C](NA )[/C][C](NA )[/C][C](NA )[/C][C](NA )[/C][C](NA )[/C][C](NA )[/C][/ROW]
[ROW][C]Estimates ( 8 )[/C][C]NA[/C][C]NA[/C][C]NA[/C][C]NA[/C][C]NA[/C][C]NA[/C][C]NA[/C][/ROW]
[ROW][C](p-val)[/C][C](NA )[/C][C](NA )[/C][C](NA )[/C][C](NA )[/C][C](NA )[/C][C](NA )[/C][C](NA )[/C][/ROW]
[ROW][C]Estimates ( 9 )[/C][C]NA[/C][C]NA[/C][C]NA[/C][C]NA[/C][C]NA[/C][C]NA[/C][C]NA[/C][/ROW]
[ROW][C](p-val)[/C][C](NA )[/C][C](NA )[/C][C](NA )[/C][C](NA )[/C][C](NA )[/C][C](NA )[/C][C](NA )[/C][/ROW]
[ROW][C]Estimates ( 10 )[/C][C]NA[/C][C]NA[/C][C]NA[/C][C]NA[/C][C]NA[/C][C]NA[/C][C]NA[/C][/ROW]
[ROW][C](p-val)[/C][C](NA )[/C][C](NA )[/C][C](NA )[/C][C](NA )[/C][C](NA )[/C][C](NA )[/C][C](NA )[/C][/ROW]
[ROW][C]Estimates ( 11 )[/C][C]NA[/C][C]NA[/C][C]NA[/C][C]NA[/C][C]NA[/C][C]NA[/C][C]NA[/C][/ROW]
[ROW][C](p-val)[/C][C](NA )[/C][C](NA )[/C][C](NA )[/C][C](NA )[/C][C](NA )[/C][C](NA )[/C][C](NA )[/C][/ROW]
[ROW][C]Estimates ( 12 )[/C][C]NA[/C][C]NA[/C][C]NA[/C][C]NA[/C][C]NA[/C][C]NA[/C][C]NA[/C][/ROW]
[ROW][C](p-val)[/C][C](NA )[/C][C](NA )[/C][C](NA )[/C][C](NA )[/C][C](NA )[/C][C](NA )[/C][C](NA )[/C][/ROW]
[ROW][C]Estimates ( 13 )[/C][C]NA[/C][C]NA[/C][C]NA[/C][C]NA[/C][C]NA[/C][C]NA[/C][C]NA[/C][/ROW]
[ROW][C](p-val)[/C][C](NA )[/C][C](NA )[/C][C](NA )[/C][C](NA )[/C][C](NA )[/C][C](NA )[/C][C](NA )[/C][/ROW]
[/TABLE]
Source: https://freestatistics.org/blog/index.php?pk=63821&T=1

Globally Unique Identifier (entire table): ba.freestatistics.org/blog/index.php?pk=63821&T=1

As an alternative you can also use a QR Code:  

The GUIDs for individual cells are displayed in the table below:

ARIMA Parameter Estimation and Backward Selection
Iterationar1ar2ar3ma1sar1sar2sma1
Estimates ( 1 )0.18180.25040.2843-1-1.0636-0.07760.8306
(p-val)(0.25 )(0.0965 )(0.0958 )(0 )(6e-04 )(0.7621 )(0.0587 )
Estimates ( 2 )0.18860.25580.2814-1-0.990800.8533
(p-val)(0.2289 )(0.0886 )(0.0975 )(0 )(0 )(NA )(1e-04 )
Estimates ( 3 )00.11970.2001-0.7882-0.989300.8364
(p-val)(NA )(0.5342 )(0.2947 )(0 )(0 )(NA )(0.0022 )
Estimates ( 4 )000.1667-0.7329-0.989100.8399
(p-val)(NA )(NA )(0.3449 )(0 )(0 )(NA )(0.0012 )
Estimates ( 5 )000-0.6948-0.988900.857
(p-val)(NA )(NA )(NA )(0 )(0 )(NA )(6e-04 )
Estimates ( 6 )NANANANANANANA
(p-val)(NA )(NA )(NA )(NA )(NA )(NA )(NA )
Estimates ( 7 )NANANANANANANA
(p-val)(NA )(NA )(NA )(NA )(NA )(NA )(NA )
Estimates ( 8 )NANANANANANANA
(p-val)(NA )(NA )(NA )(NA )(NA )(NA )(NA )
Estimates ( 9 )NANANANANANANA
(p-val)(NA )(NA )(NA )(NA )(NA )(NA )(NA )
Estimates ( 10 )NANANANANANANA
(p-val)(NA )(NA )(NA )(NA )(NA )(NA )(NA )
Estimates ( 11 )NANANANANANANA
(p-val)(NA )(NA )(NA )(NA )(NA )(NA )(NA )
Estimates ( 12 )NANANANANANANA
(p-val)(NA )(NA )(NA )(NA )(NA )(NA )(NA )
Estimates ( 13 )NANANANANANANA
(p-val)(NA )(NA )(NA )(NA )(NA )(NA )(NA )


Estimated ARIMA Residuals
Value
-144.458634798520
4738.17184449676
-56.6723703044119
3199.12961927171
-6994.10971384746
-5542.8260725268
-3704.13531761553
-2240.16206742915
4096.8878617092
-1005.77678609539
-1060.60311327861
95.265490199972
-2620.40670196995
-363.119908866254
1110.64788838372
237.657779935602
-1982.73602399722
2762.59479837024
1176.83390819240
2497.43479290561
5001.15735308267
3146.96815246879
-528.136486348389
5047.30491807552
-6305.79110970972
544.417430627553
8301.77633677279
2369.45747035618
-819.380008422531
1851.13498715499
-5721.16766581126
1911.73296637402
-3304.11797831615
-1326.40649294826
4407.63290009201
185.325702366445
2114.73159553015
-2193.22566856287
-5447.05907286864
296.06132547831
1627.28729433005
3795.02071852417
-3441.67404764907
-247.404854969439
-535.257504876322
-5694.1843676201
1113.57611491407
-6675.2542461228

\begin{tabular}{lllllllll}
\hline
Estimated ARIMA Residuals \tabularnewline
Value \tabularnewline
-144.458634798520 \tabularnewline
4738.17184449676 \tabularnewline
-56.6723703044119 \tabularnewline
3199.12961927171 \tabularnewline
-6994.10971384746 \tabularnewline
-5542.8260725268 \tabularnewline
-3704.13531761553 \tabularnewline
-2240.16206742915 \tabularnewline
4096.8878617092 \tabularnewline
-1005.77678609539 \tabularnewline
-1060.60311327861 \tabularnewline
95.265490199972 \tabularnewline
-2620.40670196995 \tabularnewline
-363.119908866254 \tabularnewline
1110.64788838372 \tabularnewline
237.657779935602 \tabularnewline
-1982.73602399722 \tabularnewline
2762.59479837024 \tabularnewline
1176.83390819240 \tabularnewline
2497.43479290561 \tabularnewline
5001.15735308267 \tabularnewline
3146.96815246879 \tabularnewline
-528.136486348389 \tabularnewline
5047.30491807552 \tabularnewline
-6305.79110970972 \tabularnewline
544.417430627553 \tabularnewline
8301.77633677279 \tabularnewline
2369.45747035618 \tabularnewline
-819.380008422531 \tabularnewline
1851.13498715499 \tabularnewline
-5721.16766581126 \tabularnewline
1911.73296637402 \tabularnewline
-3304.11797831615 \tabularnewline
-1326.40649294826 \tabularnewline
4407.63290009201 \tabularnewline
185.325702366445 \tabularnewline
2114.73159553015 \tabularnewline
-2193.22566856287 \tabularnewline
-5447.05907286864 \tabularnewline
296.06132547831 \tabularnewline
1627.28729433005 \tabularnewline
3795.02071852417 \tabularnewline
-3441.67404764907 \tabularnewline
-247.404854969439 \tabularnewline
-535.257504876322 \tabularnewline
-5694.1843676201 \tabularnewline
1113.57611491407 \tabularnewline
-6675.2542461228 \tabularnewline
\hline
\end{tabular}
%Source: https://freestatistics.org/blog/index.php?pk=63821&T=2

[TABLE]
[ROW][C]Estimated ARIMA Residuals[/C][/ROW]
[ROW][C]Value[/C][/ROW]
[ROW][C]-144.458634798520[/C][/ROW]
[ROW][C]4738.17184449676[/C][/ROW]
[ROW][C]-56.6723703044119[/C][/ROW]
[ROW][C]3199.12961927171[/C][/ROW]
[ROW][C]-6994.10971384746[/C][/ROW]
[ROW][C]-5542.8260725268[/C][/ROW]
[ROW][C]-3704.13531761553[/C][/ROW]
[ROW][C]-2240.16206742915[/C][/ROW]
[ROW][C]4096.8878617092[/C][/ROW]
[ROW][C]-1005.77678609539[/C][/ROW]
[ROW][C]-1060.60311327861[/C][/ROW]
[ROW][C]95.265490199972[/C][/ROW]
[ROW][C]-2620.40670196995[/C][/ROW]
[ROW][C]-363.119908866254[/C][/ROW]
[ROW][C]1110.64788838372[/C][/ROW]
[ROW][C]237.657779935602[/C][/ROW]
[ROW][C]-1982.73602399722[/C][/ROW]
[ROW][C]2762.59479837024[/C][/ROW]
[ROW][C]1176.83390819240[/C][/ROW]
[ROW][C]2497.43479290561[/C][/ROW]
[ROW][C]5001.15735308267[/C][/ROW]
[ROW][C]3146.96815246879[/C][/ROW]
[ROW][C]-528.136486348389[/C][/ROW]
[ROW][C]5047.30491807552[/C][/ROW]
[ROW][C]-6305.79110970972[/C][/ROW]
[ROW][C]544.417430627553[/C][/ROW]
[ROW][C]8301.77633677279[/C][/ROW]
[ROW][C]2369.45747035618[/C][/ROW]
[ROW][C]-819.380008422531[/C][/ROW]
[ROW][C]1851.13498715499[/C][/ROW]
[ROW][C]-5721.16766581126[/C][/ROW]
[ROW][C]1911.73296637402[/C][/ROW]
[ROW][C]-3304.11797831615[/C][/ROW]
[ROW][C]-1326.40649294826[/C][/ROW]
[ROW][C]4407.63290009201[/C][/ROW]
[ROW][C]185.325702366445[/C][/ROW]
[ROW][C]2114.73159553015[/C][/ROW]
[ROW][C]-2193.22566856287[/C][/ROW]
[ROW][C]-5447.05907286864[/C][/ROW]
[ROW][C]296.06132547831[/C][/ROW]
[ROW][C]1627.28729433005[/C][/ROW]
[ROW][C]3795.02071852417[/C][/ROW]
[ROW][C]-3441.67404764907[/C][/ROW]
[ROW][C]-247.404854969439[/C][/ROW]
[ROW][C]-535.257504876322[/C][/ROW]
[ROW][C]-5694.1843676201[/C][/ROW]
[ROW][C]1113.57611491407[/C][/ROW]
[ROW][C]-6675.2542461228[/C][/ROW]
[/TABLE]
Source: https://freestatistics.org/blog/index.php?pk=63821&T=2

Globally Unique Identifier (entire table): ba.freestatistics.org/blog/index.php?pk=63821&T=2

As an alternative you can also use a QR Code:  

The GUIDs for individual cells are displayed in the table below:

Estimated ARIMA Residuals
Value
-144.458634798520
4738.17184449676
-56.6723703044119
3199.12961927171
-6994.10971384746
-5542.8260725268
-3704.13531761553
-2240.16206742915
4096.8878617092
-1005.77678609539
-1060.60311327861
95.265490199972
-2620.40670196995
-363.119908866254
1110.64788838372
237.657779935602
-1982.73602399722
2762.59479837024
1176.83390819240
2497.43479290561
5001.15735308267
3146.96815246879
-528.136486348389
5047.30491807552
-6305.79110970972
544.417430627553
8301.77633677279
2369.45747035618
-819.380008422531
1851.13498715499
-5721.16766581126
1911.73296637402
-3304.11797831615
-1326.40649294826
4407.63290009201
185.325702366445
2114.73159553015
-2193.22566856287
-5447.05907286864
296.06132547831
1627.28729433005
3795.02071852417
-3441.67404764907
-247.404854969439
-535.257504876322
-5694.1843676201
1113.57611491407
-6675.2542461228


Parameters (Session):
par1 = FALSE ; par2 = 1 ; par3 = 1 ; par4 = 1 ; par5 = 12 ; par6 = 3 ; par7 = 1 ; par8 = 2 ; par9 = 1 ;
Parameters (R input):
par1 = FALSE ; par2 = 1 ; par3 = 1 ; par4 = 1 ; par5 = 12 ; par6 = 3 ; par7 = 1 ; par8 = 2 ; par9 = 1 ;
R code (references can be found in the software module):
library(lattice)
if (par1 == 'TRUE') par1 <- TRUE
if (par1 == 'FALSE') par1 <- FALSE
par2 <- as.numeric(par2) #Box-Cox lambda transformation parameter
par3 <- as.numeric(par3) #degree of non-seasonal differencing
par4 <- as.numeric(par4) #degree of seasonal differencing
par5 <- as.numeric(par5) #seasonal period
par6 <- as.numeric(par6) #degree (p) of the non-seasonal AR(p) polynomial
par7 <- as.numeric(par7) #degree (q) of the non-seasonal MA(q) polynomial
par8 <- as.numeric(par8) #degree (P) of the seasonal AR(P) polynomial
par9 <- as.numeric(par9) #degree (Q) of the seasonal MA(Q) polynomial
armaGR <- function(arima.out, names, n){
try1 <- arima.out$coef
try2 <- sqrt(diag(arima.out$var.coef))
try.data.frame <- data.frame(matrix(NA,ncol=4,nrow=length(names)))
dimnames(try.data.frame) <- list(names,c('coef','std','tstat','pv'))
try.data.frame[,1] <- try1
for(i in 1:length(try2)) try.data.frame[which(rownames(try.data.frame)==names(try2)[i]),2] <- try2[i]
try.data.frame[,3] <- try.data.frame[,1] / try.data.frame[,2]
try.data.frame[,4] <- round((1-pt(abs(try.data.frame[,3]),df=n-(length(try2)+1)))*2,5)
vector <- rep(NA,length(names))
vector[is.na(try.data.frame[,4])] <- 0
maxi <- which.max(try.data.frame[,4])
continue <- max(try.data.frame[,4],na.rm=TRUE) > .05
vector[maxi] <- 0
list(summary=try.data.frame,next.vector=vector,continue=continue)
}
arimaSelect <- function(series, order=c(13,0,0), seasonal=list(order=c(2,0,0),period=12), include.mean=F){
nrc <- order[1]+order[3]+seasonal$order[1]+seasonal$order[3]
coeff <- matrix(NA, nrow=nrc*2, ncol=nrc)
pval <- matrix(NA, nrow=nrc*2, ncol=nrc)
mylist <- rep(list(NULL), nrc)
names <- NULL
if(order[1] > 0) names <- paste('ar',1:order[1],sep='')
if(order[3] > 0) names <- c( names , paste('ma',1:order[3],sep='') )
if(seasonal$order[1] > 0) names <- c(names, paste('sar',1:seasonal$order[1],sep=''))
if(seasonal$order[3] > 0) names <- c(names, paste('sma',1:seasonal$order[3],sep=''))
arima.out <- arima(series, order=order, seasonal=seasonal, include.mean=include.mean, method='ML')
mylist[[1]] <- arima.out
last.arma <- armaGR(arima.out, names, length(series))
mystop <- FALSE
i <- 1
coeff[i,] <- last.arma[[1]][,1]
pval [i,] <- last.arma[[1]][,4]
i <- 2
aic <- arima.out$aic
while(!mystop){
mylist[[i]] <- arima.out
arima.out <- arima(series, order=order, seasonal=seasonal, include.mean=include.mean, method='ML', fixed=last.arma$next.vector)
aic <- c(aic, arima.out$aic)
last.arma <- armaGR(arima.out, names, length(series))
mystop <- !last.arma$continue
coeff[i,] <- last.arma[[1]][,1]
pval [i,] <- last.arma[[1]][,4]
i <- i+1
}
list(coeff, pval, mylist, aic=aic)
}
arimaSelectplot <- function(arimaSelect.out,noms,choix){
noms <- names(arimaSelect.out[[3]][[1]]$coef)
coeff <- arimaSelect.out[[1]]
k <- min(which(is.na(coeff[,1])))-1
coeff <- coeff[1:k,]
pval <- arimaSelect.out[[2]][1:k,]
aic <- arimaSelect.out$aic[1:k]
coeff[coeff==0] <- NA
n <- ncol(coeff)
if(missing(choix)) choix <- k
layout(matrix(c(1,1,1,2,
3,3,3,2,
3,3,3,4,
5,6,7,7),nr=4),
widths=c(10,35,45,15),
heights=c(30,30,15,15))
couleurs <- rainbow(75)[1:50]#(50)
ticks <- pretty(coeff)
par(mar=c(1,1,3,1))
plot(aic,k:1-.5,type='o',pch=21,bg='blue',cex=2,axes=F,lty=2,xpd=NA)
points(aic[choix],k-choix+.5,pch=21,cex=4,bg=2,xpd=NA)
title('aic',line=2)
par(mar=c(3,0,0,0))
plot(0,axes=F,xlab='',ylab='',xlim=range(ticks),ylim=c(.1,1))
rect(xleft = min(ticks) + (0:49)/50*(max(ticks)-min(ticks)),
xright = min(ticks) + (1:50)/50*(max(ticks)-min(ticks)),
ytop = rep(1,50),
ybottom= rep(0,50),col=couleurs,border=NA)
axis(1,ticks)
rect(xleft=min(ticks),xright=max(ticks),ytop=1,ybottom=0)
text(mean(coeff,na.rm=T),.5,'coefficients',cex=2,font=2)
par(mar=c(1,1,3,1))
image(1:n,1:k,t(coeff[k:1,]),axes=F,col=couleurs,zlim=range(ticks))
for(i in 1:n) for(j in 1:k) if(!is.na(coeff[j,i])) {
if(pval[j,i]<.01) symb = 'green'
else if( (pval[j,i]<.05) & (pval[j,i]>=.01)) symb = 'orange'
else if( (pval[j,i]<.1) & (pval[j,i]>=.05)) symb = 'red'
else symb = 'black'
polygon(c(i+.5 ,i+.2 ,i+.5 ,i+.5),
c(k-j+0.5,k-j+0.5,k-j+0.8,k-j+0.5),
col=symb)
if(j==choix) {
rect(xleft=i-.5,
xright=i+.5,
ybottom=k-j+1.5,
ytop=k-j+.5,
lwd=4)
text(i,
k-j+1,
round(coeff[j,i],2),
cex=1.2,
font=2)
}
else{
rect(xleft=i-.5,xright=i+.5,ybottom=k-j+1.5,ytop=k-j+.5)
text(i,k-j+1,round(coeff[j,i],2),cex=1.2,font=1)
}
}
axis(3,1:n,noms)
par(mar=c(0.5,0,0,0.5))
plot(0,axes=F,xlab='',ylab='',type='n',xlim=c(0,8),ylim=c(-.2,.8))
cols <- c('green','orange','red','black')
niv <- c('0','0.01','0.05','0.1')
for(i in 0:3){
polygon(c(1+2*i ,1+2*i ,1+2*i-.5 ,1+2*i),
c(.4 ,.7 , .4 , .4),
col=cols[i+1])
text(2*i,0.5,niv[i+1],cex=1.5)
}
text(8,.5,1,cex=1.5)
text(4,0,'p-value',cex=2)
box()
residus <- arimaSelect.out[[3]][[choix]]$res
par(mar=c(1,2,4,1))
acf(residus,main='')
title('acf',line=.5)
par(mar=c(1,2,4,1))
pacf(residus,main='')
title('pacf',line=.5)
par(mar=c(2,2,4,1))
qqnorm(residus,main='')
title('qq-norm',line=.5)
qqline(residus)
residus
}
if (par2 == 0) x <- log(x)
if (par2 != 0) x <- x^par2
(selection <- arimaSelect(x, order=c(par6,par3,par7), seasonal=list(order=c(par8,par4,par9), period=par5)))
bitmap(file='test1.png')
resid <- arimaSelectplot(selection)
dev.off()
resid
bitmap(file='test2.png')
acf(resid,length(resid)/2, main='Residual Autocorrelation Function')
dev.off()
bitmap(file='test3.png')
pacf(resid,length(resid)/2, main='Residual Partial Autocorrelation Function')
dev.off()
bitmap(file='test4.png')
cpgram(resid, main='Residual Cumulative Periodogram')
dev.off()
bitmap(file='test5.png')
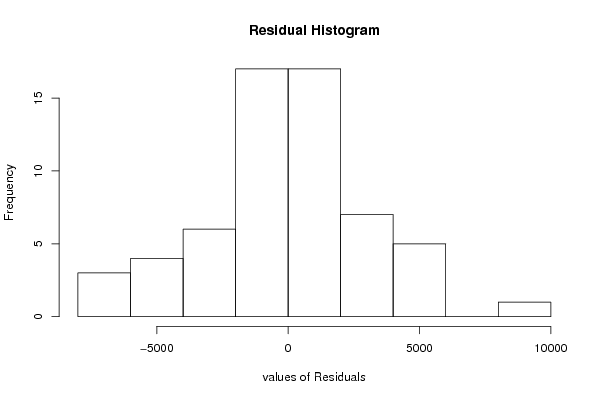
hist(resid, main='Residual Histogram', xlab='values of Residuals')
dev.off()
bitmap(file='test6.png')
densityplot(~resid,col='black',main='Residual Density Plot', xlab='values of Residuals')
dev.off()
bitmap(file='test7.png')
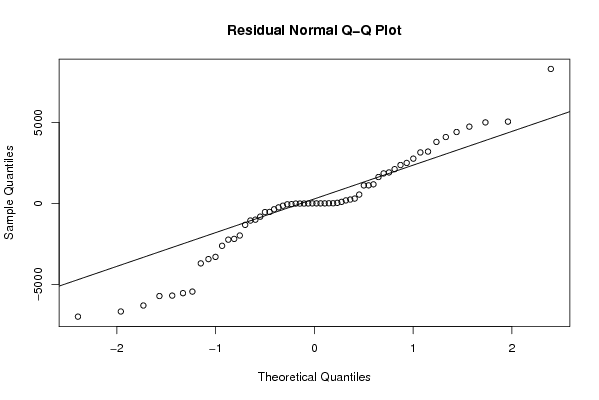
qqnorm(resid, main='Residual Normal Q-Q Plot')
qqline(resid)
dev.off()
ncols <- length(selection[[1]][1,])
nrows <- length(selection[[2]][,1])-1
load(file='createtable')
a<-table.start()
a<-table.row.start(a)
a<-table.element(a,'ARIMA Parameter Estimation and Backward Selection', ncols+1,TRUE)
a<-table.row.end(a)
a<-table.row.start(a)
a<-table.element(a,'Iteration', header=TRUE)
for (i in 1:ncols) {
a<-table.element(a,names(selection[[3]][[1]]$coef)[i],header=TRUE)
}
a<-table.row.end(a)
for (j in 1:nrows) {
a<-table.row.start(a)
mydum <- 'Estimates ('
mydum <- paste(mydum,j)
mydum <- paste(mydum,')')
a<-table.element(a,mydum, header=TRUE)
for (i in 1:ncols) {
a<-table.element(a,round(selection[[1]][j,i],4))
}
a<-table.row.end(a)
a<-table.row.start(a)
a<-table.element(a,'(p-val)', header=TRUE)
for (i in 1:ncols) {
mydum <- '('
mydum <- paste(mydum,round(selection[[2]][j,i],4),sep='')
mydum <- paste(mydum,')')
a<-table.element(a,mydum)
}
a<-table.row.end(a)
}
a<-table.end(a)
table.save(a,file='mytable.tab')
a<-table.start()
a<-table.row.start(a)
a<-table.element(a,'Estimated ARIMA Residuals', 1,TRUE)
a<-table.row.end(a)
a<-table.row.start(a)
a<-table.element(a,'Value', 1,TRUE)
a<-table.row.end(a)
for (i in (par4*par5+par3):length(resid)) {
a<-table.row.start(a)
a<-table.element(a,resid[i])
a<-table.row.end(a)
}
a<-table.end(a)
table.save(a,file='mytable1.tab')