Free Statistics

of Irreproducible Research!

Author's title

Author*The author of this computation has been verified*
R Software Modulerwasp_arimabackwardselection.wasp
Title produced by softwareARIMA Backward Selection
Date of computationFri, 04 Dec 2009 09:05:30 -0700
Cite this page as followsStatistical Computations at FreeStatistics.org, Office for Research Development and Education, URL https://freestatistics.org/blog/index.php?v=date/2009/Dec/04/t1259942874fet7sjp0e078azo.htm/, Retrieved Sun, 28 Apr 2024 16:11:38 +0000
Statistical Computations at FreeStatistics.org, Office for Research Development and Education, URL https://freestatistics.org/blog/index.php?pk=63823, Retrieved Sun, 28 Apr 2024 16:11:38 +0000
QR Codes:

Original text written by user:
IsPrivate?No (this computation is public)
User-defined keywords
Estimated Impact133
Family? (F = Feedback message, R = changed R code, M = changed R Module, P = changed Parameters, D = changed Data)
-     [Univariate Data Series] [data set] [2008-12-01 19:54:57] [b98453cac15ba1066b407e146608df68]
- RMP   [ARIMA Backward Selection] [] [2009-11-27 14:53:14] [b98453cac15ba1066b407e146608df68]
-   PD      [ARIMA Backward Selection] [ARIMA] [2009-12-04 16:05:30] [d5837f25ec8937f9733a894c487f865c] [Current]
-   P         [ARIMA Backward Selection] [ARIMA] [2009-12-19 10:42:58] [c0117c881d5fcd069841276db0c34efe]
Feedback Forum

Post a new message
Dataseries X:
3030.29
2803.47
2767.63
2882.6
2863.36
2897.06
3012.61
3142.95
3032.93
3045.78
3110.52
3013.24
2987.1
2995.55
2833.18
2848.96
2794.83
2845.26
2915.02
2892.63
2604.42
2641.65
2659.81
2638.53
2720.25
2745.88
2735.7
2811.7
2799.43
2555.28
2304.98
2214.95
2065.81
1940.49
2042
1995.37
1946.81
1765.9
1635.25
1833.42
1910.43
1959.67
1969.6
2061.41
2093.48
2120.88
2174.56
2196.72
2350.44
2440.25
2408.64
2472.81
2407.6
2454.62
2448.05
2497.84
2645.64
2756.76
2849.27
2921.44


Summary of computational transaction
Raw Inputview raw input (R code)
Raw Outputview raw output of R engine
Computing time10 seconds
R Server'Gwilym Jenkins' @ 72.249.127.135

\begin{tabular}{lllllllll}
\hline
Summary of computational transaction \tabularnewline
Raw Input & view raw input (R code)  \tabularnewline
Raw Output & view raw output of R engine  \tabularnewline
Computing time & 10 seconds \tabularnewline
R Server & 'Gwilym Jenkins' @ 72.249.127.135 \tabularnewline
\hline
\end{tabular}
%Source: https://freestatistics.org/blog/index.php?pk=63823&T=0

[TABLE]
[ROW][C]Summary of computational transaction[/C][/ROW]
[ROW][C]Raw Input[/C][C]view raw input (R code) [/C][/ROW]
[ROW][C]Raw Output[/C][C]view raw output of R engine [/C][/ROW]
[ROW][C]Computing time[/C][C]10 seconds[/C][/ROW]
[ROW][C]R Server[/C][C]'Gwilym Jenkins' @ 72.249.127.135[/C][/ROW]
[/TABLE]
Source: https://freestatistics.org/blog/index.php?pk=63823&T=0

Globally Unique Identifier (entire table): ba.freestatistics.org/blog/index.php?pk=63823&T=0

As an alternative you can also use a QR Code:  

The GUIDs for individual cells are displayed in the table below:

Summary of computational transaction
Raw Inputview raw input (R code)
Raw Outputview raw output of R engine
Computing time10 seconds
R Server'Gwilym Jenkins' @ 72.249.127.135


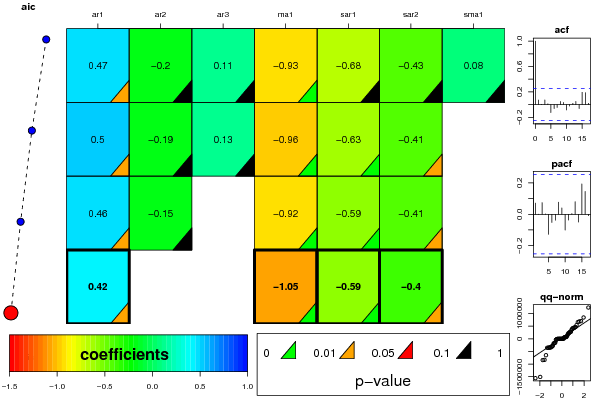
ARIMA Parameter Estimation and Backward Selection
Iterationar1ar2ar3ma1sar1sar2sma1
Estimates ( 1 )0.4745-0.1980.1098-0.9275-0.6846-0.43280.078
(p-val)(0.0184 )(0.263 )(0.5433 )(0 )(0.495 )(0.4671 )(0.9449 )
Estimates ( 2 )0.5041-0.19180.1318-0.9639-0.6255-0.41110
(p-val)(0.0294 )(0.2882 )(0.5019 )(0.002 )(6e-04 )(0.0346 )(NA )
Estimates ( 3 )0.4554-0.15250-0.9184-0.5916-0.40750
(p-val)(0.0168 )(0.3623 )(NA )(0 )(9e-04 )(0.0376 )(NA )
Estimates ( 4 )0.42200-1.0516-0.5888-0.40
(p-val)(0.0206 )(NA )(NA )(0 )(7e-04 )(0.0393 )(NA )
Estimates ( 5 )NANANANANANANA
(p-val)(NA )(NA )(NA )(NA )(NA )(NA )(NA )
Estimates ( 6 )NANANANANANANA
(p-val)(NA )(NA )(NA )(NA )(NA )(NA )(NA )
Estimates ( 7 )NANANANANANANA
(p-val)(NA )(NA )(NA )(NA )(NA )(NA )(NA )
Estimates ( 8 )NANANANANANANA
(p-val)(NA )(NA )(NA )(NA )(NA )(NA )(NA )
Estimates ( 9 )NANANANANANANA
(p-val)(NA )(NA )(NA )(NA )(NA )(NA )(NA )
Estimates ( 10 )NANANANANANANA
(p-val)(NA )(NA )(NA )(NA )(NA )(NA )(NA )
Estimates ( 11 )NANANANANANANA
(p-val)(NA )(NA )(NA )(NA )(NA )(NA )(NA )
Estimates ( 12 )NANANANANANANA
(p-val)(NA )(NA )(NA )(NA )(NA )(NA )(NA )
Estimates ( 13 )NANANANANANANA
(p-val)(NA )(NA )(NA )(NA )(NA )(NA )(NA )

\begin{tabular}{lllllllll}
\hline
ARIMA Parameter Estimation and Backward Selection \tabularnewline
Iteration & ar1 & ar2 & ar3 & ma1 & sar1 & sar2 & sma1 \tabularnewline
Estimates ( 1 ) & 0.4745 & -0.198 & 0.1098 & -0.9275 & -0.6846 & -0.4328 & 0.078 \tabularnewline
(p-val) & (0.0184 ) & (0.263 ) & (0.5433 ) & (0 ) & (0.495 ) & (0.4671 ) & (0.9449 ) \tabularnewline
Estimates ( 2 ) & 0.5041 & -0.1918 & 0.1318 & -0.9639 & -0.6255 & -0.4111 & 0 \tabularnewline
(p-val) & (0.0294 ) & (0.2882 ) & (0.5019 ) & (0.002 ) & (6e-04 ) & (0.0346 ) & (NA ) \tabularnewline
Estimates ( 3 ) & 0.4554 & -0.1525 & 0 & -0.9184 & -0.5916 & -0.4075 & 0 \tabularnewline
(p-val) & (0.0168 ) & (0.3623 ) & (NA ) & (0 ) & (9e-04 ) & (0.0376 ) & (NA ) \tabularnewline
Estimates ( 4 ) & 0.422 & 0 & 0 & -1.0516 & -0.5888 & -0.4 & 0 \tabularnewline
(p-val) & (0.0206 ) & (NA ) & (NA ) & (0 ) & (7e-04 ) & (0.0393 ) & (NA ) \tabularnewline
Estimates ( 5 ) & NA & NA & NA & NA & NA & NA & NA \tabularnewline
(p-val) & (NA ) & (NA ) & (NA ) & (NA ) & (NA ) & (NA ) & (NA ) \tabularnewline
Estimates ( 6 ) & NA & NA & NA & NA & NA & NA & NA \tabularnewline
(p-val) & (NA ) & (NA ) & (NA ) & (NA ) & (NA ) & (NA ) & (NA ) \tabularnewline
Estimates ( 7 ) & NA & NA & NA & NA & NA & NA & NA \tabularnewline
(p-val) & (NA ) & (NA ) & (NA ) & (NA ) & (NA ) & (NA ) & (NA ) \tabularnewline
Estimates ( 8 ) & NA & NA & NA & NA & NA & NA & NA \tabularnewline
(p-val) & (NA ) & (NA ) & (NA ) & (NA ) & (NA ) & (NA ) & (NA ) \tabularnewline
Estimates ( 9 ) & NA & NA & NA & NA & NA & NA & NA \tabularnewline
(p-val) & (NA ) & (NA ) & (NA ) & (NA ) & (NA ) & (NA ) & (NA ) \tabularnewline
Estimates ( 10 ) & NA & NA & NA & NA & NA & NA & NA \tabularnewline
(p-val) & (NA ) & (NA ) & (NA ) & (NA ) & (NA ) & (NA ) & (NA ) \tabularnewline
Estimates ( 11 ) & NA & NA & NA & NA & NA & NA & NA \tabularnewline
(p-val) & (NA ) & (NA ) & (NA ) & (NA ) & (NA ) & (NA ) & (NA ) \tabularnewline
Estimates ( 12 ) & NA & NA & NA & NA & NA & NA & NA \tabularnewline
(p-val) & (NA ) & (NA ) & (NA ) & (NA ) & (NA ) & (NA ) & (NA ) \tabularnewline
Estimates ( 13 ) & NA & NA & NA & NA & NA & NA & NA \tabularnewline
(p-val) & (NA ) & (NA ) & (NA ) & (NA ) & (NA ) & (NA ) & (NA ) \tabularnewline
\hline
\end{tabular}
%Source: https://freestatistics.org/blog/index.php?pk=63823&T=1

[TABLE]
[ROW][C]ARIMA Parameter Estimation and Backward Selection[/C][/ROW]
[ROW][C]Iteration[/C][C]ar1[/C][C]ar2[/C][C]ar3[/C][C]ma1[/C][C]sar1[/C][C]sar2[/C][C]sma1[/C][/ROW]
[ROW][C]Estimates ( 1 )[/C][C]0.4745[/C][C]-0.198[/C][C]0.1098[/C][C]-0.9275[/C][C]-0.6846[/C][C]-0.4328[/C][C]0.078[/C][/ROW]
[ROW][C](p-val)[/C][C](0.0184 )[/C][C](0.263 )[/C][C](0.5433 )[/C][C](0 )[/C][C](0.495 )[/C][C](0.4671 )[/C][C](0.9449 )[/C][/ROW]
[ROW][C]Estimates ( 2 )[/C][C]0.5041[/C][C]-0.1918[/C][C]0.1318[/C][C]-0.9639[/C][C]-0.6255[/C][C]-0.4111[/C][C]0[/C][/ROW]
[ROW][C](p-val)[/C][C](0.0294 )[/C][C](0.2882 )[/C][C](0.5019 )[/C][C](0.002 )[/C][C](6e-04 )[/C][C](0.0346 )[/C][C](NA )[/C][/ROW]
[ROW][C]Estimates ( 3 )[/C][C]0.4554[/C][C]-0.1525[/C][C]0[/C][C]-0.9184[/C][C]-0.5916[/C][C]-0.4075[/C][C]0[/C][/ROW]
[ROW][C](p-val)[/C][C](0.0168 )[/C][C](0.3623 )[/C][C](NA )[/C][C](0 )[/C][C](9e-04 )[/C][C](0.0376 )[/C][C](NA )[/C][/ROW]
[ROW][C]Estimates ( 4 )[/C][C]0.422[/C][C]0[/C][C]0[/C][C]-1.0516[/C][C]-0.5888[/C][C]-0.4[/C][C]0[/C][/ROW]
[ROW][C](p-val)[/C][C](0.0206 )[/C][C](NA )[/C][C](NA )[/C][C](0 )[/C][C](7e-04 )[/C][C](0.0393 )[/C][C](NA )[/C][/ROW]
[ROW][C]Estimates ( 5 )[/C][C]NA[/C][C]NA[/C][C]NA[/C][C]NA[/C][C]NA[/C][C]NA[/C][C]NA[/C][/ROW]
[ROW][C](p-val)[/C][C](NA )[/C][C](NA )[/C][C](NA )[/C][C](NA )[/C][C](NA )[/C][C](NA )[/C][C](NA )[/C][/ROW]
[ROW][C]Estimates ( 6 )[/C][C]NA[/C][C]NA[/C][C]NA[/C][C]NA[/C][C]NA[/C][C]NA[/C][C]NA[/C][/ROW]
[ROW][C](p-val)[/C][C](NA )[/C][C](NA )[/C][C](NA )[/C][C](NA )[/C][C](NA )[/C][C](NA )[/C][C](NA )[/C][/ROW]
[ROW][C]Estimates ( 7 )[/C][C]NA[/C][C]NA[/C][C]NA[/C][C]NA[/C][C]NA[/C][C]NA[/C][C]NA[/C][/ROW]
[ROW][C](p-val)[/C][C](NA )[/C][C](NA )[/C][C](NA )[/C][C](NA )[/C][C](NA )[/C][C](NA )[/C][C](NA )[/C][/ROW]
[ROW][C]Estimates ( 8 )[/C][C]NA[/C][C]NA[/C][C]NA[/C][C]NA[/C][C]NA[/C][C]NA[/C][C]NA[/C][/ROW]
[ROW][C](p-val)[/C][C](NA )[/C][C](NA )[/C][C](NA )[/C][C](NA )[/C][C](NA )[/C][C](NA )[/C][C](NA )[/C][/ROW]
[ROW][C]Estimates ( 9 )[/C][C]NA[/C][C]NA[/C][C]NA[/C][C]NA[/C][C]NA[/C][C]NA[/C][C]NA[/C][/ROW]
[ROW][C](p-val)[/C][C](NA )[/C][C](NA )[/C][C](NA )[/C][C](NA )[/C][C](NA )[/C][C](NA )[/C][C](NA )[/C][/ROW]
[ROW][C]Estimates ( 10 )[/C][C]NA[/C][C]NA[/C][C]NA[/C][C]NA[/C][C]NA[/C][C]NA[/C][C]NA[/C][/ROW]
[ROW][C](p-val)[/C][C](NA )[/C][C](NA )[/C][C](NA )[/C][C](NA )[/C][C](NA )[/C][C](NA )[/C][C](NA )[/C][/ROW]
[ROW][C]Estimates ( 11 )[/C][C]NA[/C][C]NA[/C][C]NA[/C][C]NA[/C][C]NA[/C][C]NA[/C][C]NA[/C][/ROW]
[ROW][C](p-val)[/C][C](NA )[/C][C](NA )[/C][C](NA )[/C][C](NA )[/C][C](NA )[/C][C](NA )[/C][C](NA )[/C][/ROW]
[ROW][C]Estimates ( 12 )[/C][C]NA[/C][C]NA[/C][C]NA[/C][C]NA[/C][C]NA[/C][C]NA[/C][C]NA[/C][/ROW]
[ROW][C](p-val)[/C][C](NA )[/C][C](NA )[/C][C](NA )[/C][C](NA )[/C][C](NA )[/C][C](NA )[/C][C](NA )[/C][/ROW]
[ROW][C]Estimates ( 13 )[/C][C]NA[/C][C]NA[/C][C]NA[/C][C]NA[/C][C]NA[/C][C]NA[/C][C]NA[/C][/ROW]
[ROW][C](p-val)[/C][C](NA )[/C][C](NA )[/C][C](NA )[/C][C](NA )[/C][C](NA )[/C][C](NA )[/C][C](NA )[/C][/ROW]
[/TABLE]
Source: https://freestatistics.org/blog/index.php?pk=63823&T=1

Globally Unique Identifier (entire table): ba.freestatistics.org/blog/index.php?pk=63823&T=1

As an alternative you can also use a QR Code:  

The GUIDs for individual cells are displayed in the table below:

ARIMA Parameter Estimation and Backward Selection
Iterationar1ar2ar3ma1sar1sar2sma1
Estimates ( 1 )0.4745-0.1980.1098-0.9275-0.6846-0.43280.078
(p-val)(0.0184 )(0.263 )(0.5433 )(0 )(0.495 )(0.4671 )(0.9449 )
Estimates ( 2 )0.5041-0.19180.1318-0.9639-0.6255-0.41110
(p-val)(0.0294 )(0.2882 )(0.5019 )(0.002 )(6e-04 )(0.0346 )(NA )
Estimates ( 3 )0.4554-0.15250-0.9184-0.5916-0.40750
(p-val)(0.0168 )(0.3623 )(NA )(0 )(9e-04 )(0.0376 )(NA )
Estimates ( 4 )0.42200-1.0516-0.5888-0.40
(p-val)(0.0206 )(NA )(NA )(0 )(7e-04 )(0.0393 )(NA )
Estimates ( 5 )NANANANANANANA
(p-val)(NA )(NA )(NA )(NA )(NA )(NA )(NA )
Estimates ( 6 )NANANANANANANA
(p-val)(NA )(NA )(NA )(NA )(NA )(NA )(NA )
Estimates ( 7 )NANANANANANANA
(p-val)(NA )(NA )(NA )(NA )(NA )(NA )(NA )
Estimates ( 8 )NANANANANANANA
(p-val)(NA )(NA )(NA )(NA )(NA )(NA )(NA )
Estimates ( 9 )NANANANANANANA
(p-val)(NA )(NA )(NA )(NA )(NA )(NA )(NA )
Estimates ( 10 )NANANANANANANA
(p-val)(NA )(NA )(NA )(NA )(NA )(NA )(NA )
Estimates ( 11 )NANANANANANANA
(p-val)(NA )(NA )(NA )(NA )(NA )(NA )(NA )
Estimates ( 12 )NANANANANANANA
(p-val)(NA )(NA )(NA )(NA )(NA )(NA )(NA )
Estimates ( 13 )NANANANANANANA
(p-val)(NA )(NA )(NA )(NA )(NA )(NA )(NA )


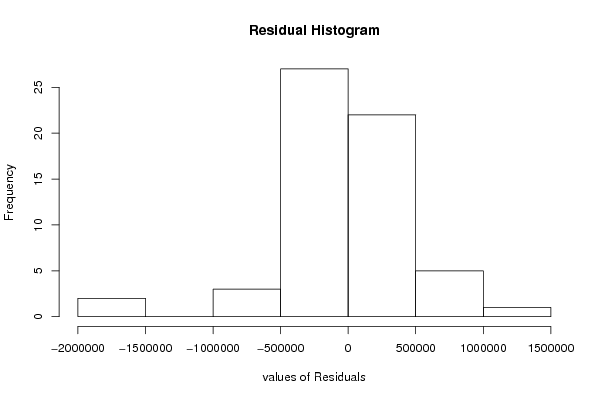
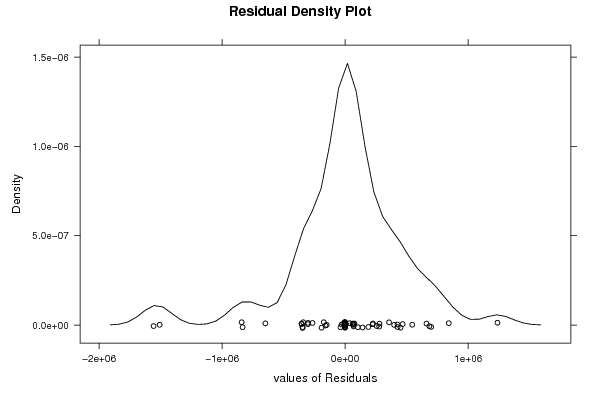
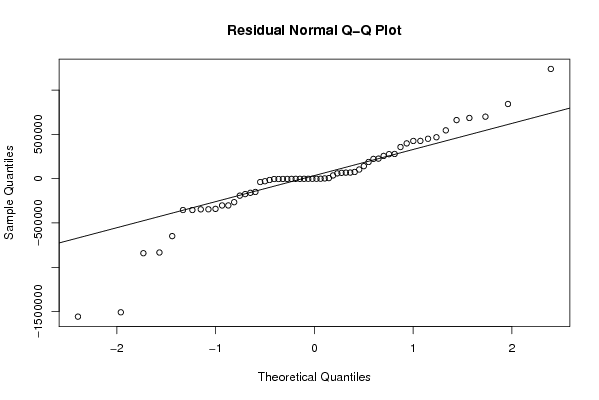
Estimated ARIMA Residuals
Value
75261.9080878108
-1507759.33828025
-159903.638992263
-150273.492602406
-3409.59589872402
-354000.929334735
-648559.05984181
-345831.642815895
425976.867912472
-341161.145655769
684665.436194784
545110.922114830
276202.635436134
256354.034979655
-191867.662427737
67953.6561096886
-1557005.91383168
-833284.087098942
59636.2299748624
699163.988012576
-841245.177796393
660871.058192966
102981.189345203
-28707.7781294355
6378.2738470353
36415.0895283337
397819.119581765
356898.351286386
467166.811049402
-38216.1292263807
225813.106620503
842232.83708305
-265494.101507823
-174078.389923801
449854.272907716
425218.344453635
222824.163881172
65529.5654063194
-353928.554442847
-346106.494739582
278530.368322590
-302397.946227308
141012.470236308
1237739.24012887
-302257.280245000
68491.6473106833
188020.373758700

\begin{tabular}{lllllllll}
\hline
Estimated ARIMA Residuals \tabularnewline
Value \tabularnewline
75261.9080878108 \tabularnewline
-1507759.33828025 \tabularnewline
-159903.638992263 \tabularnewline
-150273.492602406 \tabularnewline
-3409.59589872402 \tabularnewline
-354000.929334735 \tabularnewline
-648559.05984181 \tabularnewline
-345831.642815895 \tabularnewline
425976.867912472 \tabularnewline
-341161.145655769 \tabularnewline
684665.436194784 \tabularnewline
545110.922114830 \tabularnewline
276202.635436134 \tabularnewline
256354.034979655 \tabularnewline
-191867.662427737 \tabularnewline
67953.6561096886 \tabularnewline
-1557005.91383168 \tabularnewline
-833284.087098942 \tabularnewline
59636.2299748624 \tabularnewline
699163.988012576 \tabularnewline
-841245.177796393 \tabularnewline
660871.058192966 \tabularnewline
102981.189345203 \tabularnewline
-28707.7781294355 \tabularnewline
6378.2738470353 \tabularnewline
36415.0895283337 \tabularnewline
397819.119581765 \tabularnewline
356898.351286386 \tabularnewline
467166.811049402 \tabularnewline
-38216.1292263807 \tabularnewline
225813.106620503 \tabularnewline
842232.83708305 \tabularnewline
-265494.101507823 \tabularnewline
-174078.389923801 \tabularnewline
449854.272907716 \tabularnewline
425218.344453635 \tabularnewline
222824.163881172 \tabularnewline
65529.5654063194 \tabularnewline
-353928.554442847 \tabularnewline
-346106.494739582 \tabularnewline
278530.368322590 \tabularnewline
-302397.946227308 \tabularnewline
141012.470236308 \tabularnewline
1237739.24012887 \tabularnewline
-302257.280245000 \tabularnewline
68491.6473106833 \tabularnewline
188020.373758700 \tabularnewline
\hline
\end{tabular}
%Source: https://freestatistics.org/blog/index.php?pk=63823&T=2

[TABLE]
[ROW][C]Estimated ARIMA Residuals[/C][/ROW]
[ROW][C]Value[/C][/ROW]
[ROW][C]75261.9080878108[/C][/ROW]
[ROW][C]-1507759.33828025[/C][/ROW]
[ROW][C]-159903.638992263[/C][/ROW]
[ROW][C]-150273.492602406[/C][/ROW]
[ROW][C]-3409.59589872402[/C][/ROW]
[ROW][C]-354000.929334735[/C][/ROW]
[ROW][C]-648559.05984181[/C][/ROW]
[ROW][C]-345831.642815895[/C][/ROW]
[ROW][C]425976.867912472[/C][/ROW]
[ROW][C]-341161.145655769[/C][/ROW]
[ROW][C]684665.436194784[/C][/ROW]
[ROW][C]545110.922114830[/C][/ROW]
[ROW][C]276202.635436134[/C][/ROW]
[ROW][C]256354.034979655[/C][/ROW]
[ROW][C]-191867.662427737[/C][/ROW]
[ROW][C]67953.6561096886[/C][/ROW]
[ROW][C]-1557005.91383168[/C][/ROW]
[ROW][C]-833284.087098942[/C][/ROW]
[ROW][C]59636.2299748624[/C][/ROW]
[ROW][C]699163.988012576[/C][/ROW]
[ROW][C]-841245.177796393[/C][/ROW]
[ROW][C]660871.058192966[/C][/ROW]
[ROW][C]102981.189345203[/C][/ROW]
[ROW][C]-28707.7781294355[/C][/ROW]
[ROW][C]6378.2738470353[/C][/ROW]
[ROW][C]36415.0895283337[/C][/ROW]
[ROW][C]397819.119581765[/C][/ROW]
[ROW][C]356898.351286386[/C][/ROW]
[ROW][C]467166.811049402[/C][/ROW]
[ROW][C]-38216.1292263807[/C][/ROW]
[ROW][C]225813.106620503[/C][/ROW]
[ROW][C]842232.83708305[/C][/ROW]
[ROW][C]-265494.101507823[/C][/ROW]
[ROW][C]-174078.389923801[/C][/ROW]
[ROW][C]449854.272907716[/C][/ROW]
[ROW][C]425218.344453635[/C][/ROW]
[ROW][C]222824.163881172[/C][/ROW]
[ROW][C]65529.5654063194[/C][/ROW]
[ROW][C]-353928.554442847[/C][/ROW]
[ROW][C]-346106.494739582[/C][/ROW]
[ROW][C]278530.368322590[/C][/ROW]
[ROW][C]-302397.946227308[/C][/ROW]
[ROW][C]141012.470236308[/C][/ROW]
[ROW][C]1237739.24012887[/C][/ROW]
[ROW][C]-302257.280245000[/C][/ROW]
[ROW][C]68491.6473106833[/C][/ROW]
[ROW][C]188020.373758700[/C][/ROW]
[/TABLE]
Source: https://freestatistics.org/blog/index.php?pk=63823&T=2

Globally Unique Identifier (entire table): ba.freestatistics.org/blog/index.php?pk=63823&T=2

As an alternative you can also use a QR Code:  

The GUIDs for individual cells are displayed in the table below:

Estimated ARIMA Residuals
Value
75261.9080878108
-1507759.33828025
-159903.638992263
-150273.492602406
-3409.59589872402
-354000.929334735
-648559.05984181
-345831.642815895
425976.867912472
-341161.145655769
684665.436194784
545110.922114830
276202.635436134
256354.034979655
-191867.662427737
67953.6561096886
-1557005.91383168
-833284.087098942
59636.2299748624
699163.988012576
-841245.177796393
660871.058192966
102981.189345203
-28707.7781294355
6378.2738470353
36415.0895283337
397819.119581765
356898.351286386
467166.811049402
-38216.1292263807
225813.106620503
842232.83708305
-265494.101507823
-174078.389923801
449854.272907716
425218.344453635
222824.163881172
65529.5654063194
-353928.554442847
-346106.494739582
278530.368322590
-302397.946227308
141012.470236308
1237739.24012887
-302257.280245000
68491.6473106833
188020.373758700


Parameters (Session):
par1 = FALSE ; par2 = 2.0 ; par3 = 2 ; par4 = 1 ; par5 = 12 ; par6 = 3 ; par7 = 1 ; par8 = 2 ; par9 = 1 ;
Parameters (R input):
par1 = FALSE ; par2 = 2.0 ; par3 = 2 ; par4 = 1 ; par5 = 12 ; par6 = 3 ; par7 = 1 ; par8 = 2 ; par9 = 1 ;
R code (references can be found in the software module):
library(lattice)
if (par1 == 'TRUE') par1 <- TRUE
if (par1 == 'FALSE') par1 <- FALSE
par2 <- as.numeric(par2) #Box-Cox lambda transformation parameter
par3 <- as.numeric(par3) #degree of non-seasonal differencing
par4 <- as.numeric(par4) #degree of seasonal differencing
par5 <- as.numeric(par5) #seasonal period
par6 <- as.numeric(par6) #degree (p) of the non-seasonal AR(p) polynomial
par7 <- as.numeric(par7) #degree (q) of the non-seasonal MA(q) polynomial
par8 <- as.numeric(par8) #degree (P) of the seasonal AR(P) polynomial
par9 <- as.numeric(par9) #degree (Q) of the seasonal MA(Q) polynomial
armaGR <- function(arima.out, names, n){
try1 <- arima.out$coef
try2 <- sqrt(diag(arima.out$var.coef))
try.data.frame <- data.frame(matrix(NA,ncol=4,nrow=length(names)))
dimnames(try.data.frame) <- list(names,c('coef','std','tstat','pv'))
try.data.frame[,1] <- try1
for(i in 1:length(try2)) try.data.frame[which(rownames(try.data.frame)==names(try2)[i]),2] <- try2[i]
try.data.frame[,3] <- try.data.frame[,1] / try.data.frame[,2]
try.data.frame[,4] <- round((1-pt(abs(try.data.frame[,3]),df=n-(length(try2)+1)))*2,5)
vector <- rep(NA,length(names))
vector[is.na(try.data.frame[,4])] <- 0
maxi <- which.max(try.data.frame[,4])
continue <- max(try.data.frame[,4],na.rm=TRUE) > .05
vector[maxi] <- 0
list(summary=try.data.frame,next.vector=vector,continue=continue)
}
arimaSelect <- function(series, order=c(13,0,0), seasonal=list(order=c(2,0,0),period=12), include.mean=F){
nrc <- order[1]+order[3]+seasonal$order[1]+seasonal$order[3]
coeff <- matrix(NA, nrow=nrc*2, ncol=nrc)
pval <- matrix(NA, nrow=nrc*2, ncol=nrc)
mylist <- rep(list(NULL), nrc)
names <- NULL
if(order[1] > 0) names <- paste('ar',1:order[1],sep='')
if(order[3] > 0) names <- c( names , paste('ma',1:order[3],sep='') )
if(seasonal$order[1] > 0) names <- c(names, paste('sar',1:seasonal$order[1],sep=''))
if(seasonal$order[3] > 0) names <- c(names, paste('sma',1:seasonal$order[3],sep=''))
arima.out <- arima(series, order=order, seasonal=seasonal, include.mean=include.mean, method='ML')
mylist[[1]] <- arima.out
last.arma <- armaGR(arima.out, names, length(series))
mystop <- FALSE
i <- 1
coeff[i,] <- last.arma[[1]][,1]
pval [i,] <- last.arma[[1]][,4]
i <- 2
aic <- arima.out$aic
while(!mystop){
mylist[[i]] <- arima.out
arima.out <- arima(series, order=order, seasonal=seasonal, include.mean=include.mean, method='ML', fixed=last.arma$next.vector)
aic <- c(aic, arima.out$aic)
last.arma <- armaGR(arima.out, names, length(series))
mystop <- !last.arma$continue
coeff[i,] <- last.arma[[1]][,1]
pval [i,] <- last.arma[[1]][,4]
i <- i+1
}
list(coeff, pval, mylist, aic=aic)
}
arimaSelectplot <- function(arimaSelect.out,noms,choix){
noms <- names(arimaSelect.out[[3]][[1]]$coef)
coeff <- arimaSelect.out[[1]]
k <- min(which(is.na(coeff[,1])))-1
coeff <- coeff[1:k,]
pval <- arimaSelect.out[[2]][1:k,]
aic <- arimaSelect.out$aic[1:k]
coeff[coeff==0] <- NA
n <- ncol(coeff)
if(missing(choix)) choix <- k
layout(matrix(c(1,1,1,2,
3,3,3,2,
3,3,3,4,
5,6,7,7),nr=4),
widths=c(10,35,45,15),
heights=c(30,30,15,15))
couleurs <- rainbow(75)[1:50]#(50)
ticks <- pretty(coeff)
par(mar=c(1,1,3,1))
plot(aic,k:1-.5,type='o',pch=21,bg='blue',cex=2,axes=F,lty=2,xpd=NA)
points(aic[choix],k-choix+.5,pch=21,cex=4,bg=2,xpd=NA)
title('aic',line=2)
par(mar=c(3,0,0,0))
plot(0,axes=F,xlab='',ylab='',xlim=range(ticks),ylim=c(.1,1))
rect(xleft = min(ticks) + (0:49)/50*(max(ticks)-min(ticks)),
xright = min(ticks) + (1:50)/50*(max(ticks)-min(ticks)),
ytop = rep(1,50),
ybottom= rep(0,50),col=couleurs,border=NA)
axis(1,ticks)
rect(xleft=min(ticks),xright=max(ticks),ytop=1,ybottom=0)
text(mean(coeff,na.rm=T),.5,'coefficients',cex=2,font=2)
par(mar=c(1,1,3,1))
image(1:n,1:k,t(coeff[k:1,]),axes=F,col=couleurs,zlim=range(ticks))
for(i in 1:n) for(j in 1:k) if(!is.na(coeff[j,i])) {
if(pval[j,i]<.01) symb = 'green'
else if( (pval[j,i]<.05) & (pval[j,i]>=.01)) symb = 'orange'
else if( (pval[j,i]<.1) & (pval[j,i]>=.05)) symb = 'red'
else symb = 'black'
polygon(c(i+.5 ,i+.2 ,i+.5 ,i+.5),
c(k-j+0.5,k-j+0.5,k-j+0.8,k-j+0.5),
col=symb)
if(j==choix) {
rect(xleft=i-.5,
xright=i+.5,
ybottom=k-j+1.5,
ytop=k-j+.5,
lwd=4)
text(i,
k-j+1,
round(coeff[j,i],2),
cex=1.2,
font=2)
}
else{
rect(xleft=i-.5,xright=i+.5,ybottom=k-j+1.5,ytop=k-j+.5)
text(i,k-j+1,round(coeff[j,i],2),cex=1.2,font=1)
}
}
axis(3,1:n,noms)
par(mar=c(0.5,0,0,0.5))
plot(0,axes=F,xlab='',ylab='',type='n',xlim=c(0,8),ylim=c(-.2,.8))
cols <- c('green','orange','red','black')
niv <- c('0','0.01','0.05','0.1')
for(i in 0:3){
polygon(c(1+2*i ,1+2*i ,1+2*i-.5 ,1+2*i),
c(.4 ,.7 , .4 , .4),
col=cols[i+1])
text(2*i,0.5,niv[i+1],cex=1.5)
}
text(8,.5,1,cex=1.5)
text(4,0,'p-value',cex=2)
box()
residus <- arimaSelect.out[[3]][[choix]]$res
par(mar=c(1,2,4,1))
acf(residus,main='')
title('acf',line=.5)
par(mar=c(1,2,4,1))
pacf(residus,main='')
title('pacf',line=.5)
par(mar=c(2,2,4,1))
qqnorm(residus,main='')
title('qq-norm',line=.5)
qqline(residus)
residus
}
if (par2 == 0) x <- log(x)
if (par2 != 0) x <- x^par2
(selection <- arimaSelect(x, order=c(par6,par3,par7), seasonal=list(order=c(par8,par4,par9), period=par5)))
bitmap(file='test1.png')
resid <- arimaSelectplot(selection)
dev.off()
resid
bitmap(file='test2.png')
acf(resid,length(resid)/2, main='Residual Autocorrelation Function')
dev.off()
bitmap(file='test3.png')
pacf(resid,length(resid)/2, main='Residual Partial Autocorrelation Function')
dev.off()
bitmap(file='test4.png')
cpgram(resid, main='Residual Cumulative Periodogram')
dev.off()
bitmap(file='test5.png')
hist(resid, main='Residual Histogram', xlab='values of Residuals')
dev.off()
bitmap(file='test6.png')
densityplot(~resid,col='black',main='Residual Density Plot', xlab='values of Residuals')
dev.off()
bitmap(file='test7.png')
qqnorm(resid, main='Residual Normal Q-Q Plot')
qqline(resid)
dev.off()
ncols <- length(selection[[1]][1,])
nrows <- length(selection[[2]][,1])-1
load(file='createtable')
a<-table.start()
a<-table.row.start(a)
a<-table.element(a,'ARIMA Parameter Estimation and Backward Selection', ncols+1,TRUE)
a<-table.row.end(a)
a<-table.row.start(a)
a<-table.element(a,'Iteration', header=TRUE)
for (i in 1:ncols) {
a<-table.element(a,names(selection[[3]][[1]]$coef)[i],header=TRUE)
}
a<-table.row.end(a)
for (j in 1:nrows) {
a<-table.row.start(a)
mydum <- 'Estimates ('
mydum <- paste(mydum,j)
mydum <- paste(mydum,')')
a<-table.element(a,mydum, header=TRUE)
for (i in 1:ncols) {
a<-table.element(a,round(selection[[1]][j,i],4))
}
a<-table.row.end(a)
a<-table.row.start(a)
a<-table.element(a,'(p-val)', header=TRUE)
for (i in 1:ncols) {
mydum <- '('
mydum <- paste(mydum,round(selection[[2]][j,i],4),sep='')
mydum <- paste(mydum,')')
a<-table.element(a,mydum)
}
a<-table.row.end(a)
}
a<-table.end(a)
table.save(a,file='mytable.tab')
a<-table.start()
a<-table.row.start(a)
a<-table.element(a,'Estimated ARIMA Residuals', 1,TRUE)
a<-table.row.end(a)
a<-table.row.start(a)
a<-table.element(a,'Value', 1,TRUE)
a<-table.row.end(a)
for (i in (par4*par5+par3):length(resid)) {
a<-table.row.start(a)
a<-table.element(a,resid[i])
a<-table.row.end(a)
}
a<-table.end(a)
table.save(a,file='mytable1.tab')