Free Statistics

of Irreproducible Research!

Author's title

Author*The author of this computation has been verified*
R Software Modulerwasp_autocorrelation.wasp
Title produced by software(Partial) Autocorrelation Function
Date of computationFri, 04 Dec 2009 09:13:13 -0700
Cite this page as followsStatistical Computations at FreeStatistics.org, Office for Research Development and Education, URL https://freestatistics.org/blog/index.php?v=date/2009/Dec/04/t1259943250cgcnbw9q2k2z8sk.htm/, Retrieved Sun, 28 Apr 2024 13:30:33 +0000
Statistical Computations at FreeStatistics.org, Office for Research Development and Education, URL https://freestatistics.org/blog/index.php?pk=63835, Retrieved Sun, 28 Apr 2024 13:30:33 +0000
QR Codes:

Original text written by user:
IsPrivate?No (this computation is public)
User-defined keywords
Estimated Impact109
Family? (F = Feedback message, R = changed R code, M = changed R Module, P = changed Parameters, D = changed Data)
-     [Univariate Data Series] [data set] [2008-12-01 19:54:57] [b98453cac15ba1066b407e146608df68]
- RMP   [(Partial) Autocorrelation Function] [] [2009-11-27 14:48:46] [b98453cac15ba1066b407e146608df68]
-   PD      [(Partial) Autocorrelation Function] [] [2009-12-04 16:13:13] [8af916b6a531ec49628252b0a0ece045] [Current]
Feedback Forum

Post a new message
Dataseries X:
100,6
104,3
120,4
107,5
102,9
125,6
107,5
108,8
128,4
121,1
119,5
128,7
108,7
105,5
119,8
111,3
110,6
120,1
97,5
107,7
127,3
117,2
119,8
116,2
111
112,4
130,6
109,1
118,8
123,9
101,6
112,8
128
129,6
125,8
119,5
115,7
113,6
129,7
112
116,8
127
112,1
114,2
121,1
131,6
125
120,4
117,7
117,5
120,6
127,5
112,3
124,5
115,2
104,7
130,9
129,2
113,5
125,6
107,6


Summary of computational transaction
Raw Inputview raw input (R code)
Raw Outputview raw output of R engine
Computing time1 seconds
R Server'Gwilym Jenkins' @ 72.249.127.135

\begin{tabular}{lllllllll}
\hline
Summary of computational transaction \tabularnewline
Raw Input & view raw input (R code)  \tabularnewline
Raw Output & view raw output of R engine  \tabularnewline
Computing time & 1 seconds \tabularnewline
R Server & 'Gwilym Jenkins' @ 72.249.127.135 \tabularnewline
\hline
\end{tabular}
%Source: https://freestatistics.org/blog/index.php?pk=63835&T=0

[TABLE]
[ROW][C]Summary of computational transaction[/C][/ROW]
[ROW][C]Raw Input[/C][C]view raw input (R code) [/C][/ROW]
[ROW][C]Raw Output[/C][C]view raw output of R engine [/C][/ROW]
[ROW][C]Computing time[/C][C]1 seconds[/C][/ROW]
[ROW][C]R Server[/C][C]'Gwilym Jenkins' @ 72.249.127.135[/C][/ROW]
[/TABLE]
Source: https://freestatistics.org/blog/index.php?pk=63835&T=0

Globally Unique Identifier (entire table): ba.freestatistics.org/blog/index.php?pk=63835&T=0

As an alternative you can also use a QR Code:  

The GUIDs for individual cells are displayed in the table below:

Summary of computational transaction
Raw Inputview raw input (R code)
Raw Outputview raw output of R engine
Computing time1 seconds
R Server'Gwilym Jenkins' @ 72.249.127.135


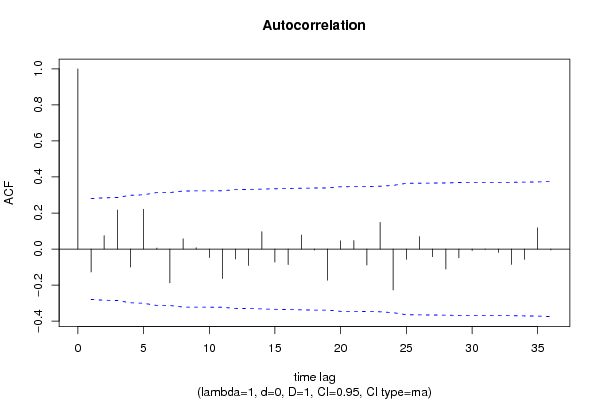
Autocorrelation Function
Time lag kACF(k)T-STATP-value
1-0.127157-0.89010.188881
20.0737640.51630.303967
30.2161661.51320.068331
4-0.099882-0.69920.243874
50.2203741.54260.064679
60.0051850.03630.485599
7-0.187678-1.31370.097525
80.0565930.39610.346858
90.0073130.05120.479692
10-0.047209-0.33050.371229
11-0.164321-1.15020.127812
12-0.055426-0.3880.349855
13-0.091129-0.63790.263254
140.0963740.67460.251544
15-0.072134-0.50490.307932
16-0.086544-0.60580.27372
170.0772570.54080.295547
18-0.005615-0.03930.484404
19-0.173403-1.21380.115317
200.0454210.31790.375938
210.0470470.32930.371656
22-0.088768-0.62140.268617
230.1479851.03590.152668
24-0.227465-1.59230.058879
25-0.057211-0.40050.345274
260.068980.48290.315674
27-0.042467-0.29730.383758
28-0.111628-0.78140.219165
29-0.049038-0.34330.366433
30-0.008711-0.0610.475812
31-0.00264-0.01850.492664
32-0.018942-0.13260.447529
33-0.085709-0.60.275648
34-0.057204-0.40040.345291
350.1180510.82640.206304
36-0.005256-0.03680.485401

\begin{tabular}{lllllllll}
\hline
Autocorrelation Function \tabularnewline
Time lag k & ACF(k) & T-STAT & P-value \tabularnewline
1 & -0.127157 & -0.8901 & 0.188881 \tabularnewline
2 & 0.073764 & 0.5163 & 0.303967 \tabularnewline
3 & 0.216166 & 1.5132 & 0.068331 \tabularnewline
4 & -0.099882 & -0.6992 & 0.243874 \tabularnewline
5 & 0.220374 & 1.5426 & 0.064679 \tabularnewline
6 & 0.005185 & 0.0363 & 0.485599 \tabularnewline
7 & -0.187678 & -1.3137 & 0.097525 \tabularnewline
8 & 0.056593 & 0.3961 & 0.346858 \tabularnewline
9 & 0.007313 & 0.0512 & 0.479692 \tabularnewline
10 & -0.047209 & -0.3305 & 0.371229 \tabularnewline
11 & -0.164321 & -1.1502 & 0.127812 \tabularnewline
12 & -0.055426 & -0.388 & 0.349855 \tabularnewline
13 & -0.091129 & -0.6379 & 0.263254 \tabularnewline
14 & 0.096374 & 0.6746 & 0.251544 \tabularnewline
15 & -0.072134 & -0.5049 & 0.307932 \tabularnewline
16 & -0.086544 & -0.6058 & 0.27372 \tabularnewline
17 & 0.077257 & 0.5408 & 0.295547 \tabularnewline
18 & -0.005615 & -0.0393 & 0.484404 \tabularnewline
19 & -0.173403 & -1.2138 & 0.115317 \tabularnewline
20 & 0.045421 & 0.3179 & 0.375938 \tabularnewline
21 & 0.047047 & 0.3293 & 0.371656 \tabularnewline
22 & -0.088768 & -0.6214 & 0.268617 \tabularnewline
23 & 0.147985 & 1.0359 & 0.152668 \tabularnewline
24 & -0.227465 & -1.5923 & 0.058879 \tabularnewline
25 & -0.057211 & -0.4005 & 0.345274 \tabularnewline
26 & 0.06898 & 0.4829 & 0.315674 \tabularnewline
27 & -0.042467 & -0.2973 & 0.383758 \tabularnewline
28 & -0.111628 & -0.7814 & 0.219165 \tabularnewline
29 & -0.049038 & -0.3433 & 0.366433 \tabularnewline
30 & -0.008711 & -0.061 & 0.475812 \tabularnewline
31 & -0.00264 & -0.0185 & 0.492664 \tabularnewline
32 & -0.018942 & -0.1326 & 0.447529 \tabularnewline
33 & -0.085709 & -0.6 & 0.275648 \tabularnewline
34 & -0.057204 & -0.4004 & 0.345291 \tabularnewline
35 & 0.118051 & 0.8264 & 0.206304 \tabularnewline
36 & -0.005256 & -0.0368 & 0.485401 \tabularnewline
\hline
\end{tabular}
%Source: https://freestatistics.org/blog/index.php?pk=63835&T=1

[TABLE]
[ROW][C]Autocorrelation Function[/C][/ROW]
[ROW][C]Time lag k[/C][C]ACF(k)[/C][C]T-STAT[/C][C]P-value[/C][/ROW]
[ROW][C]1[/C][C]-0.127157[/C][C]-0.8901[/C][C]0.188881[/C][/ROW]
[ROW][C]2[/C][C]0.073764[/C][C]0.5163[/C][C]0.303967[/C][/ROW]
[ROW][C]3[/C][C]0.216166[/C][C]1.5132[/C][C]0.068331[/C][/ROW]
[ROW][C]4[/C][C]-0.099882[/C][C]-0.6992[/C][C]0.243874[/C][/ROW]
[ROW][C]5[/C][C]0.220374[/C][C]1.5426[/C][C]0.064679[/C][/ROW]
[ROW][C]6[/C][C]0.005185[/C][C]0.0363[/C][C]0.485599[/C][/ROW]
[ROW][C]7[/C][C]-0.187678[/C][C]-1.3137[/C][C]0.097525[/C][/ROW]
[ROW][C]8[/C][C]0.056593[/C][C]0.3961[/C][C]0.346858[/C][/ROW]
[ROW][C]9[/C][C]0.007313[/C][C]0.0512[/C][C]0.479692[/C][/ROW]
[ROW][C]10[/C][C]-0.047209[/C][C]-0.3305[/C][C]0.371229[/C][/ROW]
[ROW][C]11[/C][C]-0.164321[/C][C]-1.1502[/C][C]0.127812[/C][/ROW]
[ROW][C]12[/C][C]-0.055426[/C][C]-0.388[/C][C]0.349855[/C][/ROW]
[ROW][C]13[/C][C]-0.091129[/C][C]-0.6379[/C][C]0.263254[/C][/ROW]
[ROW][C]14[/C][C]0.096374[/C][C]0.6746[/C][C]0.251544[/C][/ROW]
[ROW][C]15[/C][C]-0.072134[/C][C]-0.5049[/C][C]0.307932[/C][/ROW]
[ROW][C]16[/C][C]-0.086544[/C][C]-0.6058[/C][C]0.27372[/C][/ROW]
[ROW][C]17[/C][C]0.077257[/C][C]0.5408[/C][C]0.295547[/C][/ROW]
[ROW][C]18[/C][C]-0.005615[/C][C]-0.0393[/C][C]0.484404[/C][/ROW]
[ROW][C]19[/C][C]-0.173403[/C][C]-1.2138[/C][C]0.115317[/C][/ROW]
[ROW][C]20[/C][C]0.045421[/C][C]0.3179[/C][C]0.375938[/C][/ROW]
[ROW][C]21[/C][C]0.047047[/C][C]0.3293[/C][C]0.371656[/C][/ROW]
[ROW][C]22[/C][C]-0.088768[/C][C]-0.6214[/C][C]0.268617[/C][/ROW]
[ROW][C]23[/C][C]0.147985[/C][C]1.0359[/C][C]0.152668[/C][/ROW]
[ROW][C]24[/C][C]-0.227465[/C][C]-1.5923[/C][C]0.058879[/C][/ROW]
[ROW][C]25[/C][C]-0.057211[/C][C]-0.4005[/C][C]0.345274[/C][/ROW]
[ROW][C]26[/C][C]0.06898[/C][C]0.4829[/C][C]0.315674[/C][/ROW]
[ROW][C]27[/C][C]-0.042467[/C][C]-0.2973[/C][C]0.383758[/C][/ROW]
[ROW][C]28[/C][C]-0.111628[/C][C]-0.7814[/C][C]0.219165[/C][/ROW]
[ROW][C]29[/C][C]-0.049038[/C][C]-0.3433[/C][C]0.366433[/C][/ROW]
[ROW][C]30[/C][C]-0.008711[/C][C]-0.061[/C][C]0.475812[/C][/ROW]
[ROW][C]31[/C][C]-0.00264[/C][C]-0.0185[/C][C]0.492664[/C][/ROW]
[ROW][C]32[/C][C]-0.018942[/C][C]-0.1326[/C][C]0.447529[/C][/ROW]
[ROW][C]33[/C][C]-0.085709[/C][C]-0.6[/C][C]0.275648[/C][/ROW]
[ROW][C]34[/C][C]-0.057204[/C][C]-0.4004[/C][C]0.345291[/C][/ROW]
[ROW][C]35[/C][C]0.118051[/C][C]0.8264[/C][C]0.206304[/C][/ROW]
[ROW][C]36[/C][C]-0.005256[/C][C]-0.0368[/C][C]0.485401[/C][/ROW]
[/TABLE]
Source: https://freestatistics.org/blog/index.php?pk=63835&T=1

Globally Unique Identifier (entire table): ba.freestatistics.org/blog/index.php?pk=63835&T=1

As an alternative you can also use a QR Code:  

The GUIDs for individual cells are displayed in the table below:

Autocorrelation Function
Time lag kACF(k)T-STATP-value
1-0.127157-0.89010.188881
20.0737640.51630.303967
30.2161661.51320.068331
4-0.099882-0.69920.243874
50.2203741.54260.064679
60.0051850.03630.485599
7-0.187678-1.31370.097525
80.0565930.39610.346858
90.0073130.05120.479692
10-0.047209-0.33050.371229
11-0.164321-1.15020.127812
12-0.055426-0.3880.349855
13-0.091129-0.63790.263254
140.0963740.67460.251544
15-0.072134-0.50490.307932
16-0.086544-0.60580.27372
170.0772570.54080.295547
18-0.005615-0.03930.484404
19-0.173403-1.21380.115317
200.0454210.31790.375938
210.0470470.32930.371656
22-0.088768-0.62140.268617
230.1479851.03590.152668
24-0.227465-1.59230.058879
25-0.057211-0.40050.345274
260.068980.48290.315674
27-0.042467-0.29730.383758
28-0.111628-0.78140.219165
29-0.049038-0.34330.366433
30-0.008711-0.0610.475812
31-0.00264-0.01850.492664
32-0.018942-0.13260.447529
33-0.085709-0.60.275648
34-0.057204-0.40040.345291
350.1180510.82640.206304
36-0.005256-0.03680.485401


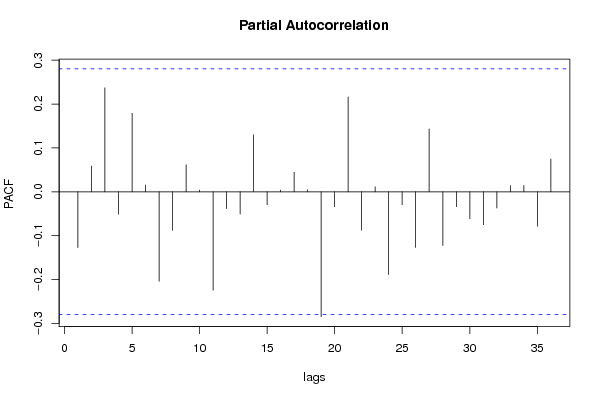
Partial Autocorrelation Function
Time lag kPACF(k)T-STATP-value
1-0.127157-0.89010.188881
20.0585410.40980.341873
30.2370731.65950.0517
4-0.051083-0.35760.361095
50.1787891.25150.108343
60.015240.10670.457738
7-0.203828-1.42680.07999
8-0.087869-0.61510.270673
90.0615370.43080.334266
100.0040180.02810.488839
11-0.224432-1.5710.061307
12-0.038226-0.26760.395071
13-0.050806-0.35560.361817
140.129920.90940.183785
15-0.029456-0.20620.418748
160.003940.02760.489054
170.044250.30970.379033
180.0044120.03090.487745
19-0.284662-1.99260.025944
20-0.034307-0.24020.405607
210.2162621.51380.068246
22-0.087681-0.61380.271105
230.0112950.07910.468651
24-0.188589-1.32010.096464
25-0.029718-0.2080.418035
26-0.127006-0.8890.189161
270.1432041.00240.160531
28-0.12234-0.85640.197978
29-0.033877-0.23710.406768
30-0.06125-0.42880.334992
31-0.07492-0.52440.301169
32-0.036699-0.25690.399167
330.0140680.09850.460977
340.0145570.10190.459627
35-0.078533-0.54970.2925
360.0746310.52240.301866

\begin{tabular}{lllllllll}
\hline
Partial Autocorrelation Function \tabularnewline
Time lag k & PACF(k) & T-STAT & P-value \tabularnewline
1 & -0.127157 & -0.8901 & 0.188881 \tabularnewline
2 & 0.058541 & 0.4098 & 0.341873 \tabularnewline
3 & 0.237073 & 1.6595 & 0.0517 \tabularnewline
4 & -0.051083 & -0.3576 & 0.361095 \tabularnewline
5 & 0.178789 & 1.2515 & 0.108343 \tabularnewline
6 & 0.01524 & 0.1067 & 0.457738 \tabularnewline
7 & -0.203828 & -1.4268 & 0.07999 \tabularnewline
8 & -0.087869 & -0.6151 & 0.270673 \tabularnewline
9 & 0.061537 & 0.4308 & 0.334266 \tabularnewline
10 & 0.004018 & 0.0281 & 0.488839 \tabularnewline
11 & -0.224432 & -1.571 & 0.061307 \tabularnewline
12 & -0.038226 & -0.2676 & 0.395071 \tabularnewline
13 & -0.050806 & -0.3556 & 0.361817 \tabularnewline
14 & 0.12992 & 0.9094 & 0.183785 \tabularnewline
15 & -0.029456 & -0.2062 & 0.418748 \tabularnewline
16 & 0.00394 & 0.0276 & 0.489054 \tabularnewline
17 & 0.04425 & 0.3097 & 0.379033 \tabularnewline
18 & 0.004412 & 0.0309 & 0.487745 \tabularnewline
19 & -0.284662 & -1.9926 & 0.025944 \tabularnewline
20 & -0.034307 & -0.2402 & 0.405607 \tabularnewline
21 & 0.216262 & 1.5138 & 0.068246 \tabularnewline
22 & -0.087681 & -0.6138 & 0.271105 \tabularnewline
23 & 0.011295 & 0.0791 & 0.468651 \tabularnewline
24 & -0.188589 & -1.3201 & 0.096464 \tabularnewline
25 & -0.029718 & -0.208 & 0.418035 \tabularnewline
26 & -0.127006 & -0.889 & 0.189161 \tabularnewline
27 & 0.143204 & 1.0024 & 0.160531 \tabularnewline
28 & -0.12234 & -0.8564 & 0.197978 \tabularnewline
29 & -0.033877 & -0.2371 & 0.406768 \tabularnewline
30 & -0.06125 & -0.4288 & 0.334992 \tabularnewline
31 & -0.07492 & -0.5244 & 0.301169 \tabularnewline
32 & -0.036699 & -0.2569 & 0.399167 \tabularnewline
33 & 0.014068 & 0.0985 & 0.460977 \tabularnewline
34 & 0.014557 & 0.1019 & 0.459627 \tabularnewline
35 & -0.078533 & -0.5497 & 0.2925 \tabularnewline
36 & 0.074631 & 0.5224 & 0.301866 \tabularnewline
\hline
\end{tabular}
%Source: https://freestatistics.org/blog/index.php?pk=63835&T=2

[TABLE]
[ROW][C]Partial Autocorrelation Function[/C][/ROW]
[ROW][C]Time lag k[/C][C]PACF(k)[/C][C]T-STAT[/C][C]P-value[/C][/ROW]
[ROW][C]1[/C][C]-0.127157[/C][C]-0.8901[/C][C]0.188881[/C][/ROW]
[ROW][C]2[/C][C]0.058541[/C][C]0.4098[/C][C]0.341873[/C][/ROW]
[ROW][C]3[/C][C]0.237073[/C][C]1.6595[/C][C]0.0517[/C][/ROW]
[ROW][C]4[/C][C]-0.051083[/C][C]-0.3576[/C][C]0.361095[/C][/ROW]
[ROW][C]5[/C][C]0.178789[/C][C]1.2515[/C][C]0.108343[/C][/ROW]
[ROW][C]6[/C][C]0.01524[/C][C]0.1067[/C][C]0.457738[/C][/ROW]
[ROW][C]7[/C][C]-0.203828[/C][C]-1.4268[/C][C]0.07999[/C][/ROW]
[ROW][C]8[/C][C]-0.087869[/C][C]-0.6151[/C][C]0.270673[/C][/ROW]
[ROW][C]9[/C][C]0.061537[/C][C]0.4308[/C][C]0.334266[/C][/ROW]
[ROW][C]10[/C][C]0.004018[/C][C]0.0281[/C][C]0.488839[/C][/ROW]
[ROW][C]11[/C][C]-0.224432[/C][C]-1.571[/C][C]0.061307[/C][/ROW]
[ROW][C]12[/C][C]-0.038226[/C][C]-0.2676[/C][C]0.395071[/C][/ROW]
[ROW][C]13[/C][C]-0.050806[/C][C]-0.3556[/C][C]0.361817[/C][/ROW]
[ROW][C]14[/C][C]0.12992[/C][C]0.9094[/C][C]0.183785[/C][/ROW]
[ROW][C]15[/C][C]-0.029456[/C][C]-0.2062[/C][C]0.418748[/C][/ROW]
[ROW][C]16[/C][C]0.00394[/C][C]0.0276[/C][C]0.489054[/C][/ROW]
[ROW][C]17[/C][C]0.04425[/C][C]0.3097[/C][C]0.379033[/C][/ROW]
[ROW][C]18[/C][C]0.004412[/C][C]0.0309[/C][C]0.487745[/C][/ROW]
[ROW][C]19[/C][C]-0.284662[/C][C]-1.9926[/C][C]0.025944[/C][/ROW]
[ROW][C]20[/C][C]-0.034307[/C][C]-0.2402[/C][C]0.405607[/C][/ROW]
[ROW][C]21[/C][C]0.216262[/C][C]1.5138[/C][C]0.068246[/C][/ROW]
[ROW][C]22[/C][C]-0.087681[/C][C]-0.6138[/C][C]0.271105[/C][/ROW]
[ROW][C]23[/C][C]0.011295[/C][C]0.0791[/C][C]0.468651[/C][/ROW]
[ROW][C]24[/C][C]-0.188589[/C][C]-1.3201[/C][C]0.096464[/C][/ROW]
[ROW][C]25[/C][C]-0.029718[/C][C]-0.208[/C][C]0.418035[/C][/ROW]
[ROW][C]26[/C][C]-0.127006[/C][C]-0.889[/C][C]0.189161[/C][/ROW]
[ROW][C]27[/C][C]0.143204[/C][C]1.0024[/C][C]0.160531[/C][/ROW]
[ROW][C]28[/C][C]-0.12234[/C][C]-0.8564[/C][C]0.197978[/C][/ROW]
[ROW][C]29[/C][C]-0.033877[/C][C]-0.2371[/C][C]0.406768[/C][/ROW]
[ROW][C]30[/C][C]-0.06125[/C][C]-0.4288[/C][C]0.334992[/C][/ROW]
[ROW][C]31[/C][C]-0.07492[/C][C]-0.5244[/C][C]0.301169[/C][/ROW]
[ROW][C]32[/C][C]-0.036699[/C][C]-0.2569[/C][C]0.399167[/C][/ROW]
[ROW][C]33[/C][C]0.014068[/C][C]0.0985[/C][C]0.460977[/C][/ROW]
[ROW][C]34[/C][C]0.014557[/C][C]0.1019[/C][C]0.459627[/C][/ROW]
[ROW][C]35[/C][C]-0.078533[/C][C]-0.5497[/C][C]0.2925[/C][/ROW]
[ROW][C]36[/C][C]0.074631[/C][C]0.5224[/C][C]0.301866[/C][/ROW]
[/TABLE]
Source: https://freestatistics.org/blog/index.php?pk=63835&T=2

Globally Unique Identifier (entire table): ba.freestatistics.org/blog/index.php?pk=63835&T=2

As an alternative you can also use a QR Code:  

The GUIDs for individual cells are displayed in the table below:

Partial Autocorrelation Function
Time lag kPACF(k)T-STATP-value
1-0.127157-0.89010.188881
20.0585410.40980.341873
30.2370731.65950.0517
4-0.051083-0.35760.361095
50.1787891.25150.108343
60.015240.10670.457738
7-0.203828-1.42680.07999
8-0.087869-0.61510.270673
90.0615370.43080.334266
100.0040180.02810.488839
11-0.224432-1.5710.061307
12-0.038226-0.26760.395071
13-0.050806-0.35560.361817
140.129920.90940.183785
15-0.029456-0.20620.418748
160.003940.02760.489054
170.044250.30970.379033
180.0044120.03090.487745
19-0.284662-1.99260.025944
20-0.034307-0.24020.405607
210.2162621.51380.068246
22-0.087681-0.61380.271105
230.0112950.07910.468651
24-0.188589-1.32010.096464
25-0.029718-0.2080.418035
26-0.127006-0.8890.189161
270.1432041.00240.160531
28-0.12234-0.85640.197978
29-0.033877-0.23710.406768
30-0.06125-0.42880.334992
31-0.07492-0.52440.301169
32-0.036699-0.25690.399167
330.0140680.09850.460977
340.0145570.10190.459627
35-0.078533-0.54970.2925
360.0746310.52240.301866


Parameters (Session):
par1 = 36 ; par2 = 1 ; par3 = 0 ; par4 = 1 ; par5 = 12 ; par6 = MA ; par7 = 0.95 ;
Parameters (R input):
par1 = 36 ; par2 = 1 ; par3 = 0 ; par4 = 1 ; par5 = 12 ; par6 = MA ; par7 = 0.95 ;
R code (references can be found in the software module):
if (par1 == 'Default') {
par1 = 10*log10(length(x))
} else {
par1 <- as.numeric(par1)
}
par2 <- as.numeric(par2)
par3 <- as.numeric(par3)
par4 <- as.numeric(par4)
par5 <- as.numeric(par5)
if (par6 == 'White Noise') par6 <- 'white' else par6 <- 'ma'
par7 <- as.numeric(par7)
if (par2 == 0) {
x <- log(x)
} else {
x <- (x ^ par2 - 1) / par2
}
if (par3 > 0) x <- diff(x,lag=1,difference=par3)
if (par4 > 0) x <- diff(x,lag=par5,difference=par4)
bitmap(file='pic1.png')
racf <- acf(x, par1, main='Autocorrelation', xlab='time lag', ylab='ACF', ci.type=par6, ci=par7, sub=paste('(lambda=',par2,', d=',par3,', D=',par4,', CI=', par7, ', CI type=',par6,')',sep=''))
dev.off()
bitmap(file='pic2.png')
rpacf <- pacf(x,par1,main='Partial Autocorrelation',xlab='lags',ylab='PACF')
dev.off()
(myacf <- c(racf$acf))
(mypacf <- c(rpacf$acf))
lengthx <- length(x)
sqrtn <- sqrt(lengthx)
load(file='createtable')
a<-table.start()
a<-table.row.start(a)
a<-table.element(a,'Autocorrelation Function',4,TRUE)
a<-table.row.end(a)
a<-table.row.start(a)
a<-table.element(a,'Time lag k',header=TRUE)
a<-table.element(a,hyperlink('basics.htm','ACF(k)','click here for more information about the Autocorrelation Function'),header=TRUE)
a<-table.element(a,'T-STAT',header=TRUE)
a<-table.element(a,'P-value',header=TRUE)
a<-table.row.end(a)
for (i in 2:(par1+1)) {
a<-table.row.start(a)
a<-table.element(a,i-1,header=TRUE)
a<-table.element(a,round(myacf[i],6))
mytstat <- myacf[i]*sqrtn
a<-table.element(a,round(mytstat,4))
a<-table.element(a,round(1-pt(abs(mytstat),lengthx),6))
a<-table.row.end(a)
}
a<-table.end(a)
table.save(a,file='mytable.tab')
a<-table.start()
a<-table.row.start(a)
a<-table.element(a,'Partial Autocorrelation Function',4,TRUE)
a<-table.row.end(a)
a<-table.row.start(a)
a<-table.element(a,'Time lag k',header=TRUE)
a<-table.element(a,hyperlink('basics.htm','PACF(k)','click here for more information about the Partial Autocorrelation Function'),header=TRUE)
a<-table.element(a,'T-STAT',header=TRUE)
a<-table.element(a,'P-value',header=TRUE)
a<-table.row.end(a)
for (i in 1:par1) {
a<-table.row.start(a)
a<-table.element(a,i,header=TRUE)
a<-table.element(a,round(mypacf[i],6))
mytstat <- mypacf[i]*sqrtn
a<-table.element(a,round(mytstat,4))
a<-table.element(a,round(1-pt(abs(mytstat),lengthx),6))
a<-table.row.end(a)
}
a<-table.end(a)
table.save(a,file='mytable1.tab')