Free Statistics

of Irreproducible Research!

Author's title

Author*The author of this computation has been verified*
R Software Modulerwasp_exponentialsmoothing.wasp
Title produced by softwareExponential Smoothing
Date of computationFri, 04 Dec 2009 09:17:53 -0700
Cite this page as followsStatistical Computations at FreeStatistics.org, Office for Research Development and Education, URL https://freestatistics.org/blog/index.php?v=date/2009/Dec/04/t1259943512us42vfa8d2o431f.htm/, Retrieved Sun, 28 Apr 2024 13:05:30 +0000
Statistical Computations at FreeStatistics.org, Office for Research Development and Education, URL https://freestatistics.org/blog/index.php?pk=63844, Retrieved Sun, 28 Apr 2024 13:05:30 +0000
QR Codes:

Original text written by user:
IsPrivate?No (this computation is public)
User-defined keywords
Estimated Impact138
Family? (F = Feedback message, R = changed R code, M = changed R Module, P = changed Parameters, D = changed Data)
-     [Univariate Data Series] [data set] [2008-12-01 19:54:57] [b98453cac15ba1066b407e146608df68]
- RMP   [Exponential Smoothing] [] [2009-11-27 15:04:36] [b98453cac15ba1066b407e146608df68]
-    D    [Exponential Smoothing] [Exponential smoot...] [2009-12-03 16:44:51] [d46757a0a8c9b00540ab7e7e0c34bfc4]
-    D        [Exponential Smoothing] [Exponential smoot...] [2009-12-04 16:17:53] [371dc2189c569d90e2c1567f632c3ec0] [Current]
-   PD          [Exponential Smoothing] [Exponential smoot...] [2009-12-16 22:59:52] [34d27ebe78dc2d31581e8710befe8733]
Feedback Forum

Post a new message
Dataseries X:
462
455
461
461
463
462
456
455
456
472
472
471
465
459
465
468
467
463
460
462
461
476
476
471
453
443
442
444
438
427
424
416
406
431
434
418
412
404
409
412
406
398
397
385
390
413
413
401
397
397
409
419
424
428
430
424
433
456
459
446
441


Summary of computational transaction
Raw Inputview raw input (R code)
Raw Outputview raw output of R engine
Computing time1 seconds
R Server'Gwilym Jenkins' @ 72.249.127.135

\begin{tabular}{lllllllll}
\hline
Summary of computational transaction \tabularnewline
Raw Input & view raw input (R code)  \tabularnewline
Raw Output & view raw output of R engine  \tabularnewline
Computing time & 1 seconds \tabularnewline
R Server & 'Gwilym Jenkins' @ 72.249.127.135 \tabularnewline
\hline
\end{tabular}
%Source: https://freestatistics.org/blog/index.php?pk=63844&T=0

[TABLE]
[ROW][C]Summary of computational transaction[/C][/ROW]
[ROW][C]Raw Input[/C][C]view raw input (R code) [/C][/ROW]
[ROW][C]Raw Output[/C][C]view raw output of R engine [/C][/ROW]
[ROW][C]Computing time[/C][C]1 seconds[/C][/ROW]
[ROW][C]R Server[/C][C]'Gwilym Jenkins' @ 72.249.127.135[/C][/ROW]
[/TABLE]
Source: https://freestatistics.org/blog/index.php?pk=63844&T=0

Globally Unique Identifier (entire table): ba.freestatistics.org/blog/index.php?pk=63844&T=0

As an alternative you can also use a QR Code:  

The GUIDs for individual cells are displayed in the table below:

Summary of computational transaction
Raw Inputview raw input (R code)
Raw Outputview raw output of R engine
Computing time1 seconds
R Server'Gwilym Jenkins' @ 72.249.127.135


Estimated Parameters of Exponential Smoothing
ParameterValue
alpha0.425497132234063
beta0.750351434132633
gamma1

\begin{tabular}{lllllllll}
\hline
Estimated Parameters of Exponential Smoothing \tabularnewline
Parameter & Value \tabularnewline
alpha & 0.425497132234063 \tabularnewline
beta & 0.750351434132633 \tabularnewline
gamma & 1 \tabularnewline
\hline
\end{tabular}
%Source: https://freestatistics.org/blog/index.php?pk=63844&T=1

[TABLE]
[ROW][C]Estimated Parameters of Exponential Smoothing[/C][/ROW]
[ROW][C]Parameter[/C][C]Value[/C][/ROW]
[ROW][C]alpha[/C][C]0.425497132234063[/C][/ROW]
[ROW][C]beta[/C][C]0.750351434132633[/C][/ROW]
[ROW][C]gamma[/C][C]1[/C][/ROW]
[/TABLE]
Source: https://freestatistics.org/blog/index.php?pk=63844&T=1

Globally Unique Identifier (entire table): ba.freestatistics.org/blog/index.php?pk=63844&T=1

As an alternative you can also use a QR Code:  

The GUIDs for individual cells are displayed in the table below:

Estimated Parameters of Exponential Smoothing
ParameterValue
alpha0.425497132234063
beta0.750351434132633
gamma1


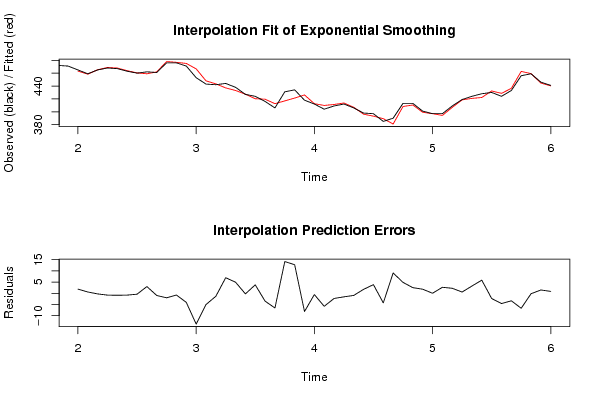
Interpolation Forecasts of Exponential Smoothing
tObservedFittedResiduals
13465463.1629417113691.83705828863145
14459458.4386036768330.56139632316706
15465465.2984471025-0.298447102499665
16468468.830611719609-0.83061171960918
17467467.909466193403-0.909466193403148
18463463.825386794596-0.825386794596454
19460460.419032995802-0.419032995802013
20462459.0160086407272.98399135927286
21461461.993485896885-0.99348589688526
22476478.029037775497-2.02903777549699
23476476.781658147538-0.781658147537769
24471475.06452024124-4.06452024123956
25453466.714795056054-13.7147950560544
26443448.038636565858-5.0386365658581
27442443.333552989163-1.33355298916308
28444437.0882690046346.91173099536582
29438433.0688553387234.9311446612769
30427427.274180244202-0.274180244201943
31424420.2497792920693.75022070793068
32416419.523401440320-3.52340144031962
33406412.541952806296-6.54195280629597
34431416.88494865603514.1150513439655
35434421.29444619790812.7055538020916
36418426.133221355773-8.13322135577312
37412412.579570703811-0.579570703811328
38404409.810577625581-5.81057762558117
39409411.315704326062-2.31570432606202
40412413.593992012247-1.59399201224704
41406406.958288904532-0.958288904532367
42398396.2511966170571.74880338294253
43397393.1629604107343.837039589266
44385389.289314676407-4.28931467640746
45390380.9448140751839.05518592481712
46413408.1552273559124.84477264408798
47413410.4999783016782.50002169832152
48401399.1926275876881.80737241231230
49397396.9948577425180.00514225748213448
50397394.3388409939352.66115900606525
51409406.7849282002582.21507179974157
52419418.4532720287060.546727971294331
53424420.7799744261393.22002557386071
54428422.1585124699195.84148753008111
55430432.323650740407-2.32365074040723
56424428.580034262214-4.58003426221427
57433436.350283797238-3.35028379723821
58456462.684911396768-6.68491139676786
59459459.205190194173-0.205190194172587
60446444.5336599831811.46634001681929
61441440.1646656779830.835334322016934

\begin{tabular}{lllllllll}
\hline
Interpolation Forecasts of Exponential Smoothing \tabularnewline
t & Observed & Fitted & Residuals \tabularnewline
13 & 465 & 463.162941711369 & 1.83705828863145 \tabularnewline
14 & 459 & 458.438603676833 & 0.56139632316706 \tabularnewline
15 & 465 & 465.2984471025 & -0.298447102499665 \tabularnewline
16 & 468 & 468.830611719609 & -0.83061171960918 \tabularnewline
17 & 467 & 467.909466193403 & -0.909466193403148 \tabularnewline
18 & 463 & 463.825386794596 & -0.825386794596454 \tabularnewline
19 & 460 & 460.419032995802 & -0.419032995802013 \tabularnewline
20 & 462 & 459.016008640727 & 2.98399135927286 \tabularnewline
21 & 461 & 461.993485896885 & -0.99348589688526 \tabularnewline
22 & 476 & 478.029037775497 & -2.02903777549699 \tabularnewline
23 & 476 & 476.781658147538 & -0.781658147537769 \tabularnewline
24 & 471 & 475.06452024124 & -4.06452024123956 \tabularnewline
25 & 453 & 466.714795056054 & -13.7147950560544 \tabularnewline
26 & 443 & 448.038636565858 & -5.0386365658581 \tabularnewline
27 & 442 & 443.333552989163 & -1.33355298916308 \tabularnewline
28 & 444 & 437.088269004634 & 6.91173099536582 \tabularnewline
29 & 438 & 433.068855338723 & 4.9311446612769 \tabularnewline
30 & 427 & 427.274180244202 & -0.274180244201943 \tabularnewline
31 & 424 & 420.249779292069 & 3.75022070793068 \tabularnewline
32 & 416 & 419.523401440320 & -3.52340144031962 \tabularnewline
33 & 406 & 412.541952806296 & -6.54195280629597 \tabularnewline
34 & 431 & 416.884948656035 & 14.1150513439655 \tabularnewline
35 & 434 & 421.294446197908 & 12.7055538020916 \tabularnewline
36 & 418 & 426.133221355773 & -8.13322135577312 \tabularnewline
37 & 412 & 412.579570703811 & -0.579570703811328 \tabularnewline
38 & 404 & 409.810577625581 & -5.81057762558117 \tabularnewline
39 & 409 & 411.315704326062 & -2.31570432606202 \tabularnewline
40 & 412 & 413.593992012247 & -1.59399201224704 \tabularnewline
41 & 406 & 406.958288904532 & -0.958288904532367 \tabularnewline
42 & 398 & 396.251196617057 & 1.74880338294253 \tabularnewline
43 & 397 & 393.162960410734 & 3.837039589266 \tabularnewline
44 & 385 & 389.289314676407 & -4.28931467640746 \tabularnewline
45 & 390 & 380.944814075183 & 9.05518592481712 \tabularnewline
46 & 413 & 408.155227355912 & 4.84477264408798 \tabularnewline
47 & 413 & 410.499978301678 & 2.50002169832152 \tabularnewline
48 & 401 & 399.192627587688 & 1.80737241231230 \tabularnewline
49 & 397 & 396.994857742518 & 0.00514225748213448 \tabularnewline
50 & 397 & 394.338840993935 & 2.66115900606525 \tabularnewline
51 & 409 & 406.784928200258 & 2.21507179974157 \tabularnewline
52 & 419 & 418.453272028706 & 0.546727971294331 \tabularnewline
53 & 424 & 420.779974426139 & 3.22002557386071 \tabularnewline
54 & 428 & 422.158512469919 & 5.84148753008111 \tabularnewline
55 & 430 & 432.323650740407 & -2.32365074040723 \tabularnewline
56 & 424 & 428.580034262214 & -4.58003426221427 \tabularnewline
57 & 433 & 436.350283797238 & -3.35028379723821 \tabularnewline
58 & 456 & 462.684911396768 & -6.68491139676786 \tabularnewline
59 & 459 & 459.205190194173 & -0.205190194172587 \tabularnewline
60 & 446 & 444.533659983181 & 1.46634001681929 \tabularnewline
61 & 441 & 440.164665677983 & 0.835334322016934 \tabularnewline
\hline
\end{tabular}
%Source: https://freestatistics.org/blog/index.php?pk=63844&T=2

[TABLE]
[ROW][C]Interpolation Forecasts of Exponential Smoothing[/C][/ROW]
[ROW][C]t[/C][C]Observed[/C][C]Fitted[/C][C]Residuals[/C][/ROW]
[ROW][C]13[/C][C]465[/C][C]463.162941711369[/C][C]1.83705828863145[/C][/ROW]
[ROW][C]14[/C][C]459[/C][C]458.438603676833[/C][C]0.56139632316706[/C][/ROW]
[ROW][C]15[/C][C]465[/C][C]465.2984471025[/C][C]-0.298447102499665[/C][/ROW]
[ROW][C]16[/C][C]468[/C][C]468.830611719609[/C][C]-0.83061171960918[/C][/ROW]
[ROW][C]17[/C][C]467[/C][C]467.909466193403[/C][C]-0.909466193403148[/C][/ROW]
[ROW][C]18[/C][C]463[/C][C]463.825386794596[/C][C]-0.825386794596454[/C][/ROW]
[ROW][C]19[/C][C]460[/C][C]460.419032995802[/C][C]-0.419032995802013[/C][/ROW]
[ROW][C]20[/C][C]462[/C][C]459.016008640727[/C][C]2.98399135927286[/C][/ROW]
[ROW][C]21[/C][C]461[/C][C]461.993485896885[/C][C]-0.99348589688526[/C][/ROW]
[ROW][C]22[/C][C]476[/C][C]478.029037775497[/C][C]-2.02903777549699[/C][/ROW]
[ROW][C]23[/C][C]476[/C][C]476.781658147538[/C][C]-0.781658147537769[/C][/ROW]
[ROW][C]24[/C][C]471[/C][C]475.06452024124[/C][C]-4.06452024123956[/C][/ROW]
[ROW][C]25[/C][C]453[/C][C]466.714795056054[/C][C]-13.7147950560544[/C][/ROW]
[ROW][C]26[/C][C]443[/C][C]448.038636565858[/C][C]-5.0386365658581[/C][/ROW]
[ROW][C]27[/C][C]442[/C][C]443.333552989163[/C][C]-1.33355298916308[/C][/ROW]
[ROW][C]28[/C][C]444[/C][C]437.088269004634[/C][C]6.91173099536582[/C][/ROW]
[ROW][C]29[/C][C]438[/C][C]433.068855338723[/C][C]4.9311446612769[/C][/ROW]
[ROW][C]30[/C][C]427[/C][C]427.274180244202[/C][C]-0.274180244201943[/C][/ROW]
[ROW][C]31[/C][C]424[/C][C]420.249779292069[/C][C]3.75022070793068[/C][/ROW]
[ROW][C]32[/C][C]416[/C][C]419.523401440320[/C][C]-3.52340144031962[/C][/ROW]
[ROW][C]33[/C][C]406[/C][C]412.541952806296[/C][C]-6.54195280629597[/C][/ROW]
[ROW][C]34[/C][C]431[/C][C]416.884948656035[/C][C]14.1150513439655[/C][/ROW]
[ROW][C]35[/C][C]434[/C][C]421.294446197908[/C][C]12.7055538020916[/C][/ROW]
[ROW][C]36[/C][C]418[/C][C]426.133221355773[/C][C]-8.13322135577312[/C][/ROW]
[ROW][C]37[/C][C]412[/C][C]412.579570703811[/C][C]-0.579570703811328[/C][/ROW]
[ROW][C]38[/C][C]404[/C][C]409.810577625581[/C][C]-5.81057762558117[/C][/ROW]
[ROW][C]39[/C][C]409[/C][C]411.315704326062[/C][C]-2.31570432606202[/C][/ROW]
[ROW][C]40[/C][C]412[/C][C]413.593992012247[/C][C]-1.59399201224704[/C][/ROW]
[ROW][C]41[/C][C]406[/C][C]406.958288904532[/C][C]-0.958288904532367[/C][/ROW]
[ROW][C]42[/C][C]398[/C][C]396.251196617057[/C][C]1.74880338294253[/C][/ROW]
[ROW][C]43[/C][C]397[/C][C]393.162960410734[/C][C]3.837039589266[/C][/ROW]
[ROW][C]44[/C][C]385[/C][C]389.289314676407[/C][C]-4.28931467640746[/C][/ROW]
[ROW][C]45[/C][C]390[/C][C]380.944814075183[/C][C]9.05518592481712[/C][/ROW]
[ROW][C]46[/C][C]413[/C][C]408.155227355912[/C][C]4.84477264408798[/C][/ROW]
[ROW][C]47[/C][C]413[/C][C]410.499978301678[/C][C]2.50002169832152[/C][/ROW]
[ROW][C]48[/C][C]401[/C][C]399.192627587688[/C][C]1.80737241231230[/C][/ROW]
[ROW][C]49[/C][C]397[/C][C]396.994857742518[/C][C]0.00514225748213448[/C][/ROW]
[ROW][C]50[/C][C]397[/C][C]394.338840993935[/C][C]2.66115900606525[/C][/ROW]
[ROW][C]51[/C][C]409[/C][C]406.784928200258[/C][C]2.21507179974157[/C][/ROW]
[ROW][C]52[/C][C]419[/C][C]418.453272028706[/C][C]0.546727971294331[/C][/ROW]
[ROW][C]53[/C][C]424[/C][C]420.779974426139[/C][C]3.22002557386071[/C][/ROW]
[ROW][C]54[/C][C]428[/C][C]422.158512469919[/C][C]5.84148753008111[/C][/ROW]
[ROW][C]55[/C][C]430[/C][C]432.323650740407[/C][C]-2.32365074040723[/C][/ROW]
[ROW][C]56[/C][C]424[/C][C]428.580034262214[/C][C]-4.58003426221427[/C][/ROW]
[ROW][C]57[/C][C]433[/C][C]436.350283797238[/C][C]-3.35028379723821[/C][/ROW]
[ROW][C]58[/C][C]456[/C][C]462.684911396768[/C][C]-6.68491139676786[/C][/ROW]
[ROW][C]59[/C][C]459[/C][C]459.205190194173[/C][C]-0.205190194172587[/C][/ROW]
[ROW][C]60[/C][C]446[/C][C]444.533659983181[/C][C]1.46634001681929[/C][/ROW]
[ROW][C]61[/C][C]441[/C][C]440.164665677983[/C][C]0.835334322016934[/C][/ROW]
[/TABLE]
Source: https://freestatistics.org/blog/index.php?pk=63844&T=2

Globally Unique Identifier (entire table): ba.freestatistics.org/blog/index.php?pk=63844&T=2

As an alternative you can also use a QR Code:  

The GUIDs for individual cells are displayed in the table below:

Interpolation Forecasts of Exponential Smoothing
tObservedFittedResiduals
13465463.1629417113691.83705828863145
14459458.4386036768330.56139632316706
15465465.2984471025-0.298447102499665
16468468.830611719609-0.83061171960918
17467467.909466193403-0.909466193403148
18463463.825386794596-0.825386794596454
19460460.419032995802-0.419032995802013
20462459.0160086407272.98399135927286
21461461.993485896885-0.99348589688526
22476478.029037775497-2.02903777549699
23476476.781658147538-0.781658147537769
24471475.06452024124-4.06452024123956
25453466.714795056054-13.7147950560544
26443448.038636565858-5.0386365658581
27442443.333552989163-1.33355298916308
28444437.0882690046346.91173099536582
29438433.0688553387234.9311446612769
30427427.274180244202-0.274180244201943
31424420.2497792920693.75022070793068
32416419.523401440320-3.52340144031962
33406412.541952806296-6.54195280629597
34431416.88494865603514.1150513439655
35434421.29444619790812.7055538020916
36418426.133221355773-8.13322135577312
37412412.579570703811-0.579570703811328
38404409.810577625581-5.81057762558117
39409411.315704326062-2.31570432606202
40412413.593992012247-1.59399201224704
41406406.958288904532-0.958288904532367
42398396.2511966170571.74880338294253
43397393.1629604107343.837039589266
44385389.289314676407-4.28931467640746
45390380.9448140751839.05518592481712
46413408.1552273559124.84477264408798
47413410.4999783016782.50002169832152
48401399.1926275876881.80737241231230
49397396.9948577425180.00514225748213448
50397394.3388409939352.66115900606525
51409406.7849282002582.21507179974157
52419418.4532720287060.546727971294331
53424420.7799744261393.22002557386071
54428422.1585124699195.84148753008111
55430432.323650740407-2.32365074040723
56424428.580034262214-4.58003426221427
57433436.350283797238-3.35028379723821
58456462.684911396768-6.68491139676786
59459459.205190194173-0.205190194172587
60446444.5336599831811.46634001681929
61441440.1646656779830.835334322016934


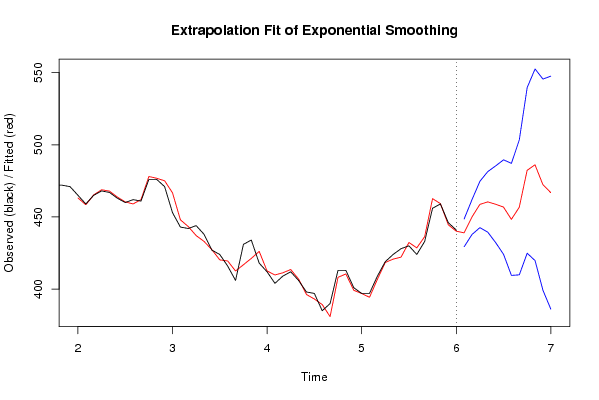
Extrapolation Forecasts of Exponential Smoothing
tForecast95% Lower Bound95% Upper Bound
62438.977121235833429.358138622567448.596103849099
63449.959818637493437.879824477006462.039812797979
64458.672292641558442.625022915679474.719562367438
65460.438380994200439.448550022769481.42821196563
66458.801946609596432.220326222380485.383566996812
67456.844595561333424.113858256671489.575332865995
68448.321099290396409.504376041661487.13782253913
69456.661703837808409.906279973285503.417127702331
70482.273770641975424.887167385101539.660373898848
71486.148892116373419.772623285923552.525160946822
72472.372587312214399.216318720857545.52885590357
73466.855442403412386.159178550149547.551706256674

\begin{tabular}{lllllllll}
\hline
Extrapolation Forecasts of Exponential Smoothing \tabularnewline
t & Forecast & 95% Lower Bound & 95% Upper Bound \tabularnewline
62 & 438.977121235833 & 429.358138622567 & 448.596103849099 \tabularnewline
63 & 449.959818637493 & 437.879824477006 & 462.039812797979 \tabularnewline
64 & 458.672292641558 & 442.625022915679 & 474.719562367438 \tabularnewline
65 & 460.438380994200 & 439.448550022769 & 481.42821196563 \tabularnewline
66 & 458.801946609596 & 432.220326222380 & 485.383566996812 \tabularnewline
67 & 456.844595561333 & 424.113858256671 & 489.575332865995 \tabularnewline
68 & 448.321099290396 & 409.504376041661 & 487.13782253913 \tabularnewline
69 & 456.661703837808 & 409.906279973285 & 503.417127702331 \tabularnewline
70 & 482.273770641975 & 424.887167385101 & 539.660373898848 \tabularnewline
71 & 486.148892116373 & 419.772623285923 & 552.525160946822 \tabularnewline
72 & 472.372587312214 & 399.216318720857 & 545.52885590357 \tabularnewline
73 & 466.855442403412 & 386.159178550149 & 547.551706256674 \tabularnewline
\hline
\end{tabular}
%Source: https://freestatistics.org/blog/index.php?pk=63844&T=3

[TABLE]
[ROW][C]Extrapolation Forecasts of Exponential Smoothing[/C][/ROW]
[ROW][C]t[/C][C]Forecast[/C][C]95% Lower Bound[/C][C]95% Upper Bound[/C][/ROW]
[ROW][C]62[/C][C]438.977121235833[/C][C]429.358138622567[/C][C]448.596103849099[/C][/ROW]
[ROW][C]63[/C][C]449.959818637493[/C][C]437.879824477006[/C][C]462.039812797979[/C][/ROW]
[ROW][C]64[/C][C]458.672292641558[/C][C]442.625022915679[/C][C]474.719562367438[/C][/ROW]
[ROW][C]65[/C][C]460.438380994200[/C][C]439.448550022769[/C][C]481.42821196563[/C][/ROW]
[ROW][C]66[/C][C]458.801946609596[/C][C]432.220326222380[/C][C]485.383566996812[/C][/ROW]
[ROW][C]67[/C][C]456.844595561333[/C][C]424.113858256671[/C][C]489.575332865995[/C][/ROW]
[ROW][C]68[/C][C]448.321099290396[/C][C]409.504376041661[/C][C]487.13782253913[/C][/ROW]
[ROW][C]69[/C][C]456.661703837808[/C][C]409.906279973285[/C][C]503.417127702331[/C][/ROW]
[ROW][C]70[/C][C]482.273770641975[/C][C]424.887167385101[/C][C]539.660373898848[/C][/ROW]
[ROW][C]71[/C][C]486.148892116373[/C][C]419.772623285923[/C][C]552.525160946822[/C][/ROW]
[ROW][C]72[/C][C]472.372587312214[/C][C]399.216318720857[/C][C]545.52885590357[/C][/ROW]
[ROW][C]73[/C][C]466.855442403412[/C][C]386.159178550149[/C][C]547.551706256674[/C][/ROW]
[/TABLE]
Source: https://freestatistics.org/blog/index.php?pk=63844&T=3

Globally Unique Identifier (entire table): ba.freestatistics.org/blog/index.php?pk=63844&T=3

As an alternative you can also use a QR Code:  

The GUIDs for individual cells are displayed in the table below:

Extrapolation Forecasts of Exponential Smoothing
tForecast95% Lower Bound95% Upper Bound
62438.977121235833429.358138622567448.596103849099
63449.959818637493437.879824477006462.039812797979
64458.672292641558442.625022915679474.719562367438
65460.438380994200439.448550022769481.42821196563
66458.801946609596432.220326222380485.383566996812
67456.844595561333424.113858256671489.575332865995
68448.321099290396409.504376041661487.13782253913
69456.661703837808409.906279973285503.417127702331
70482.273770641975424.887167385101539.660373898848
71486.148892116373419.772623285923552.525160946822
72472.372587312214399.216318720857545.52885590357
73466.855442403412386.159178550149547.551706256674


Parameters (Session):
par1 = 12 ; par2 = Triple ; par3 = multiplicative ;
Parameters (R input):
par1 = 12 ; par2 = Triple ; par3 = multiplicative ;
R code (references can be found in the software module):
par1 <- as.numeric(par1)
if (par2 == 'Single') K <- 1
if (par2 == 'Double') K <- 2
if (par2 == 'Triple') K <- par1
nx <- length(x)
nxmK <- nx - K
x <- ts(x, frequency = par1)
if (par2 == 'Single') fit <- HoltWinters(x, gamma=0, beta=0)
if (par2 == 'Double') fit <- HoltWinters(x, gamma=0)
if (par2 == 'Triple') fit <- HoltWinters(x, seasonal=par3)
fit
myresid <- x - fit$fitted[,'xhat']
bitmap(file='test1.png')
op <- par(mfrow=c(2,1))
plot(fit,ylab='Observed (black) / Fitted (red)',main='Interpolation Fit of Exponential Smoothing')
plot(myresid,ylab='Residuals',main='Interpolation Prediction Errors')
par(op)
dev.off()
bitmap(file='test2.png')
p <- predict(fit, par1, prediction.interval=TRUE)
np <- length(p[,1])
plot(fit,p,ylab='Observed (black) / Fitted (red)',main='Extrapolation Fit of Exponential Smoothing')
dev.off()
bitmap(file='test3.png')
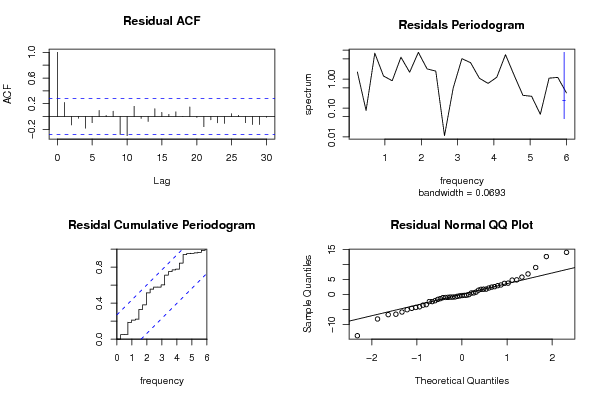
op <- par(mfrow = c(2,2))
acf(as.numeric(myresid),lag.max = nx/2,main='Residual ACF')
spectrum(myresid,main='Residals Periodogram')
cpgram(myresid,main='Residal Cumulative Periodogram')
qqnorm(myresid,main='Residual Normal QQ Plot')
qqline(myresid)
par(op)
dev.off()
load(file='createtable')
a<-table.start()
a<-table.row.start(a)
a<-table.element(a,'Estimated Parameters of Exponential Smoothing',2,TRUE)
a<-table.row.end(a)
a<-table.row.start(a)
a<-table.element(a,'Parameter',header=TRUE)
a<-table.element(a,'Value',header=TRUE)
a<-table.row.end(a)
a<-table.row.start(a)
a<-table.element(a,'alpha',header=TRUE)
a<-table.element(a,fit$alpha)
a<-table.row.end(a)
a<-table.row.start(a)
a<-table.element(a,'beta',header=TRUE)
a<-table.element(a,fit$beta)
a<-table.row.end(a)
a<-table.row.start(a)
a<-table.element(a,'gamma',header=TRUE)
a<-table.element(a,fit$gamma)
a<-table.row.end(a)
a<-table.end(a)
table.save(a,file='mytable.tab')
a<-table.start()
a<-table.row.start(a)
a<-table.element(a,'Interpolation Forecasts of Exponential Smoothing',4,TRUE)
a<-table.row.end(a)
a<-table.row.start(a)
a<-table.element(a,'t',header=TRUE)
a<-table.element(a,'Observed',header=TRUE)
a<-table.element(a,'Fitted',header=TRUE)
a<-table.element(a,'Residuals',header=TRUE)
a<-table.row.end(a)
for (i in 1:nxmK) {
a<-table.row.start(a)
a<-table.element(a,i+K,header=TRUE)
a<-table.element(a,x[i+K])
a<-table.element(a,fit$fitted[i,'xhat'])
a<-table.element(a,myresid[i])
a<-table.row.end(a)
}
a<-table.end(a)
table.save(a,file='mytable1.tab')
a<-table.start()
a<-table.row.start(a)
a<-table.element(a,'Extrapolation Forecasts of Exponential Smoothing',4,TRUE)
a<-table.row.end(a)
a<-table.row.start(a)
a<-table.element(a,'t',header=TRUE)
a<-table.element(a,'Forecast',header=TRUE)
a<-table.element(a,'95% Lower Bound',header=TRUE)
a<-table.element(a,'95% Upper Bound',header=TRUE)
a<-table.row.end(a)
for (i in 1:np) {
a<-table.row.start(a)
a<-table.element(a,nx+i,header=TRUE)
a<-table.element(a,p[i,'fit'])
a<-table.element(a,p[i,'lwr'])
a<-table.element(a,p[i,'upr'])
a<-table.row.end(a)
}
a<-table.end(a)
table.save(a,file='mytable2.tab')