Free Statistics

of Irreproducible Research!

Author's title

Author*Unverified author*
R Software Modulerwasp_autocorrelation.wasp
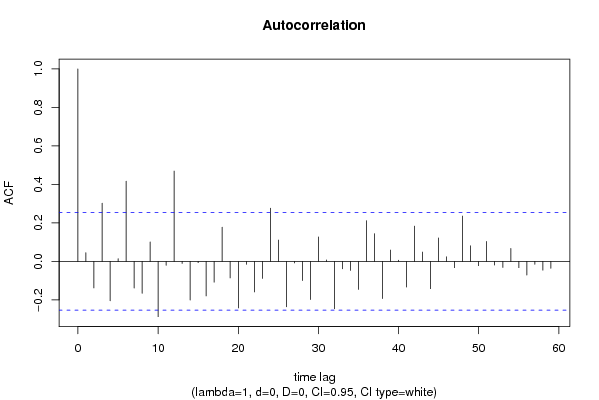
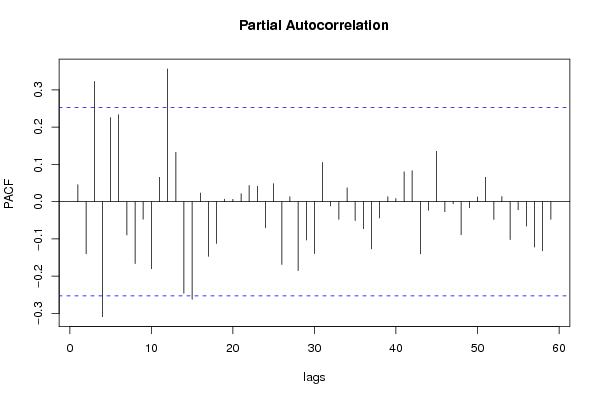
Title produced by software(Partial) Autocorrelation Function
Date of computationFri, 04 Dec 2009 09:22:01 -0700
Cite this page as followsStatistical Computations at FreeStatistics.org, Office for Research Development and Education, URL https://freestatistics.org/blog/index.php?v=date/2009/Dec/04/t1259943788iop5pam569ojhw9.htm/, Retrieved Sun, 28 Apr 2024 10:31:59 +0000
Statistical Computations at FreeStatistics.org, Office for Research Development and Education, URL https://freestatistics.org/blog/index.php?pk=63850, Retrieved Sun, 28 Apr 2024 10:31:59 +0000
QR Codes:

Original text written by user:
IsPrivate?No (this computation is public)
User-defined keywords
Estimated Impact110
Family? (F = Feedback message, R = changed R code, M = changed R Module, P = changed Parameters, D = changed Data)
-       [(Partial) Autocorrelation Function] [Industriële produ...] [2009-12-04 16:22:01] [f340d7563d07b81b9aae66c73f3e92ac] [Current]
Feedback Forum

Post a new message
Dataseries X:
103,5
104,6
118,6
106,3
110,7
121,6
107
107,6
125,6
113,5
129,2
130,9
104,7
115,2
124,5
112,3
127,5
120,6
117,5
117,7
120,4
125
131,6
121,1
114,2
112,1
127
116,8
112
129,7
113,6
115,7
119,5
125,8
129,6
128
112,8
101,6
123,9
118,8
109,1
130,6
112,4
111
116,2
119,8
117,2
127,3
107,7
97,5
120,1
110,6
111,3
119,8
105,5
108,7
128,7
119,5
121,1
128,4


Summary of computational transaction
Raw Inputview raw input (R code)
Raw Outputview raw output of R engine
Computing time1 seconds
R Server'Gwilym Jenkins' @ 72.249.127.135

\begin{tabular}{lllllllll}
\hline
Summary of computational transaction \tabularnewline
Raw Input & view raw input (R code)  \tabularnewline
Raw Output & view raw output of R engine  \tabularnewline
Computing time & 1 seconds \tabularnewline
R Server & 'Gwilym Jenkins' @ 72.249.127.135 \tabularnewline
\hline
\end{tabular}
%Source: https://freestatistics.org/blog/index.php?pk=63850&T=0

[TABLE]
[ROW][C]Summary of computational transaction[/C][/ROW]
[ROW][C]Raw Input[/C][C]view raw input (R code) [/C][/ROW]
[ROW][C]Raw Output[/C][C]view raw output of R engine [/C][/ROW]
[ROW][C]Computing time[/C][C]1 seconds[/C][/ROW]
[ROW][C]R Server[/C][C]'Gwilym Jenkins' @ 72.249.127.135[/C][/ROW]
[/TABLE]
Source: https://freestatistics.org/blog/index.php?pk=63850&T=0

Globally Unique Identifier (entire table): ba.freestatistics.org/blog/index.php?pk=63850&T=0

As an alternative you can also use a QR Code:  

The GUIDs for individual cells are displayed in the table below:

Summary of computational transaction
Raw Inputview raw input (R code)
Raw Outputview raw output of R engine
Computing time1 seconds
R Server'Gwilym Jenkins' @ 72.249.127.135


Autocorrelation Function
Time lag kACF(k)T-STATP-value
10.0455080.35250.362849
2-0.137553-1.06550.145463
30.3023222.34180.011265
4-0.204869-1.58690.058895
50.0141180.10940.456641
60.4171453.23120.001002
7-0.138398-1.0720.144001
8-0.165745-1.28390.102064
90.1011040.78310.21831
10-0.286897-2.22230.015022
11-0.020425-0.15820.437409
120.4697963.6390.000286
13-0.010395-0.08050.468047
14-0.200811-1.55550.062546
15-0.006552-0.05080.479845
16-0.179444-1.390.084837
17-0.107684-0.83410.203762
180.1777751.3770.086808
19-0.085561-0.66280.255013
20-0.241312-1.86920.03324
21-0.014686-0.11380.454906
22-0.158771-1.22980.111779
23-0.088369-0.68450.248145
240.2765732.14230.018117
250.1108860.85890.196902
26-0.235807-1.82660.036371
27-0.00757-0.05860.476719
28-0.099537-0.7710.221862
29-0.198184-1.53510.065005
300.1274760.98740.163701
310.0077080.05970.476295
32-0.246041-1.90580.030733
33-0.038615-0.29910.382945
34-0.046979-0.36390.358606
35-0.145449-1.12660.13219
360.2116841.63970.053151
370.1439641.11510.134619
38-0.192954-1.49460.070128
390.0590290.45720.324575
400.0062310.04830.480834
41-0.133269-1.03230.153038
420.1834651.42110.08023
430.0489610.37920.352921
44-0.141666-1.09730.138439
450.1223040.94740.173628
460.0239810.18580.426633
47-0.032762-0.25380.400269
480.2354771.8240.036567
490.0809870.62730.266415
50-0.022294-0.17270.431738
510.1040330.80580.211759
52-0.018746-0.14520.442517
53-0.031013-0.24020.405486
540.0674090.52220.301744
55-0.032257-0.24990.401775
56-0.071004-0.550.292183
57-0.014999-0.11620.453949
58-0.045337-0.35120.363343
59-0.035978-0.27870.390722
60NANANA

\begin{tabular}{lllllllll}
\hline
Autocorrelation Function \tabularnewline
Time lag k & ACF(k) & T-STAT & P-value \tabularnewline
1 & 0.045508 & 0.3525 & 0.362849 \tabularnewline
2 & -0.137553 & -1.0655 & 0.145463 \tabularnewline
3 & 0.302322 & 2.3418 & 0.011265 \tabularnewline
4 & -0.204869 & -1.5869 & 0.058895 \tabularnewline
5 & 0.014118 & 0.1094 & 0.456641 \tabularnewline
6 & 0.417145 & 3.2312 & 0.001002 \tabularnewline
7 & -0.138398 & -1.072 & 0.144001 \tabularnewline
8 & -0.165745 & -1.2839 & 0.102064 \tabularnewline
9 & 0.101104 & 0.7831 & 0.21831 \tabularnewline
10 & -0.286897 & -2.2223 & 0.015022 \tabularnewline
11 & -0.020425 & -0.1582 & 0.437409 \tabularnewline
12 & 0.469796 & 3.639 & 0.000286 \tabularnewline
13 & -0.010395 & -0.0805 & 0.468047 \tabularnewline
14 & -0.200811 & -1.5555 & 0.062546 \tabularnewline
15 & -0.006552 & -0.0508 & 0.479845 \tabularnewline
16 & -0.179444 & -1.39 & 0.084837 \tabularnewline
17 & -0.107684 & -0.8341 & 0.203762 \tabularnewline
18 & 0.177775 & 1.377 & 0.086808 \tabularnewline
19 & -0.085561 & -0.6628 & 0.255013 \tabularnewline
20 & -0.241312 & -1.8692 & 0.03324 \tabularnewline
21 & -0.014686 & -0.1138 & 0.454906 \tabularnewline
22 & -0.158771 & -1.2298 & 0.111779 \tabularnewline
23 & -0.088369 & -0.6845 & 0.248145 \tabularnewline
24 & 0.276573 & 2.1423 & 0.018117 \tabularnewline
25 & 0.110886 & 0.8589 & 0.196902 \tabularnewline
26 & -0.235807 & -1.8266 & 0.036371 \tabularnewline
27 & -0.00757 & -0.0586 & 0.476719 \tabularnewline
28 & -0.099537 & -0.771 & 0.221862 \tabularnewline
29 & -0.198184 & -1.5351 & 0.065005 \tabularnewline
30 & 0.127476 & 0.9874 & 0.163701 \tabularnewline
31 & 0.007708 & 0.0597 & 0.476295 \tabularnewline
32 & -0.246041 & -1.9058 & 0.030733 \tabularnewline
33 & -0.038615 & -0.2991 & 0.382945 \tabularnewline
34 & -0.046979 & -0.3639 & 0.358606 \tabularnewline
35 & -0.145449 & -1.1266 & 0.13219 \tabularnewline
36 & 0.211684 & 1.6397 & 0.053151 \tabularnewline
37 & 0.143964 & 1.1151 & 0.134619 \tabularnewline
38 & -0.192954 & -1.4946 & 0.070128 \tabularnewline
39 & 0.059029 & 0.4572 & 0.324575 \tabularnewline
40 & 0.006231 & 0.0483 & 0.480834 \tabularnewline
41 & -0.133269 & -1.0323 & 0.153038 \tabularnewline
42 & 0.183465 & 1.4211 & 0.08023 \tabularnewline
43 & 0.048961 & 0.3792 & 0.352921 \tabularnewline
44 & -0.141666 & -1.0973 & 0.138439 \tabularnewline
45 & 0.122304 & 0.9474 & 0.173628 \tabularnewline
46 & 0.023981 & 0.1858 & 0.426633 \tabularnewline
47 & -0.032762 & -0.2538 & 0.400269 \tabularnewline
48 & 0.235477 & 1.824 & 0.036567 \tabularnewline
49 & 0.080987 & 0.6273 & 0.266415 \tabularnewline
50 & -0.022294 & -0.1727 & 0.431738 \tabularnewline
51 & 0.104033 & 0.8058 & 0.211759 \tabularnewline
52 & -0.018746 & -0.1452 & 0.442517 \tabularnewline
53 & -0.031013 & -0.2402 & 0.405486 \tabularnewline
54 & 0.067409 & 0.5222 & 0.301744 \tabularnewline
55 & -0.032257 & -0.2499 & 0.401775 \tabularnewline
56 & -0.071004 & -0.55 & 0.292183 \tabularnewline
57 & -0.014999 & -0.1162 & 0.453949 \tabularnewline
58 & -0.045337 & -0.3512 & 0.363343 \tabularnewline
59 & -0.035978 & -0.2787 & 0.390722 \tabularnewline
60 & NA & NA & NA \tabularnewline
\hline
\end{tabular}
%Source: https://freestatistics.org/blog/index.php?pk=63850&T=1

[TABLE]
[ROW][C]Autocorrelation Function[/C][/ROW]
[ROW][C]Time lag k[/C][C]ACF(k)[/C][C]T-STAT[/C][C]P-value[/C][/ROW]
[ROW][C]1[/C][C]0.045508[/C][C]0.3525[/C][C]0.362849[/C][/ROW]
[ROW][C]2[/C][C]-0.137553[/C][C]-1.0655[/C][C]0.145463[/C][/ROW]
[ROW][C]3[/C][C]0.302322[/C][C]2.3418[/C][C]0.011265[/C][/ROW]
[ROW][C]4[/C][C]-0.204869[/C][C]-1.5869[/C][C]0.058895[/C][/ROW]
[ROW][C]5[/C][C]0.014118[/C][C]0.1094[/C][C]0.456641[/C][/ROW]
[ROW][C]6[/C][C]0.417145[/C][C]3.2312[/C][C]0.001002[/C][/ROW]
[ROW][C]7[/C][C]-0.138398[/C][C]-1.072[/C][C]0.144001[/C][/ROW]
[ROW][C]8[/C][C]-0.165745[/C][C]-1.2839[/C][C]0.102064[/C][/ROW]
[ROW][C]9[/C][C]0.101104[/C][C]0.7831[/C][C]0.21831[/C][/ROW]
[ROW][C]10[/C][C]-0.286897[/C][C]-2.2223[/C][C]0.015022[/C][/ROW]
[ROW][C]11[/C][C]-0.020425[/C][C]-0.1582[/C][C]0.437409[/C][/ROW]
[ROW][C]12[/C][C]0.469796[/C][C]3.639[/C][C]0.000286[/C][/ROW]
[ROW][C]13[/C][C]-0.010395[/C][C]-0.0805[/C][C]0.468047[/C][/ROW]
[ROW][C]14[/C][C]-0.200811[/C][C]-1.5555[/C][C]0.062546[/C][/ROW]
[ROW][C]15[/C][C]-0.006552[/C][C]-0.0508[/C][C]0.479845[/C][/ROW]
[ROW][C]16[/C][C]-0.179444[/C][C]-1.39[/C][C]0.084837[/C][/ROW]
[ROW][C]17[/C][C]-0.107684[/C][C]-0.8341[/C][C]0.203762[/C][/ROW]
[ROW][C]18[/C][C]0.177775[/C][C]1.377[/C][C]0.086808[/C][/ROW]
[ROW][C]19[/C][C]-0.085561[/C][C]-0.6628[/C][C]0.255013[/C][/ROW]
[ROW][C]20[/C][C]-0.241312[/C][C]-1.8692[/C][C]0.03324[/C][/ROW]
[ROW][C]21[/C][C]-0.014686[/C][C]-0.1138[/C][C]0.454906[/C][/ROW]
[ROW][C]22[/C][C]-0.158771[/C][C]-1.2298[/C][C]0.111779[/C][/ROW]
[ROW][C]23[/C][C]-0.088369[/C][C]-0.6845[/C][C]0.248145[/C][/ROW]
[ROW][C]24[/C][C]0.276573[/C][C]2.1423[/C][C]0.018117[/C][/ROW]
[ROW][C]25[/C][C]0.110886[/C][C]0.8589[/C][C]0.196902[/C][/ROW]
[ROW][C]26[/C][C]-0.235807[/C][C]-1.8266[/C][C]0.036371[/C][/ROW]
[ROW][C]27[/C][C]-0.00757[/C][C]-0.0586[/C][C]0.476719[/C][/ROW]
[ROW][C]28[/C][C]-0.099537[/C][C]-0.771[/C][C]0.221862[/C][/ROW]
[ROW][C]29[/C][C]-0.198184[/C][C]-1.5351[/C][C]0.065005[/C][/ROW]
[ROW][C]30[/C][C]0.127476[/C][C]0.9874[/C][C]0.163701[/C][/ROW]
[ROW][C]31[/C][C]0.007708[/C][C]0.0597[/C][C]0.476295[/C][/ROW]
[ROW][C]32[/C][C]-0.246041[/C][C]-1.9058[/C][C]0.030733[/C][/ROW]
[ROW][C]33[/C][C]-0.038615[/C][C]-0.2991[/C][C]0.382945[/C][/ROW]
[ROW][C]34[/C][C]-0.046979[/C][C]-0.3639[/C][C]0.358606[/C][/ROW]
[ROW][C]35[/C][C]-0.145449[/C][C]-1.1266[/C][C]0.13219[/C][/ROW]
[ROW][C]36[/C][C]0.211684[/C][C]1.6397[/C][C]0.053151[/C][/ROW]
[ROW][C]37[/C][C]0.143964[/C][C]1.1151[/C][C]0.134619[/C][/ROW]
[ROW][C]38[/C][C]-0.192954[/C][C]-1.4946[/C][C]0.070128[/C][/ROW]
[ROW][C]39[/C][C]0.059029[/C][C]0.4572[/C][C]0.324575[/C][/ROW]
[ROW][C]40[/C][C]0.006231[/C][C]0.0483[/C][C]0.480834[/C][/ROW]
[ROW][C]41[/C][C]-0.133269[/C][C]-1.0323[/C][C]0.153038[/C][/ROW]
[ROW][C]42[/C][C]0.183465[/C][C]1.4211[/C][C]0.08023[/C][/ROW]
[ROW][C]43[/C][C]0.048961[/C][C]0.3792[/C][C]0.352921[/C][/ROW]
[ROW][C]44[/C][C]-0.141666[/C][C]-1.0973[/C][C]0.138439[/C][/ROW]
[ROW][C]45[/C][C]0.122304[/C][C]0.9474[/C][C]0.173628[/C][/ROW]
[ROW][C]46[/C][C]0.023981[/C][C]0.1858[/C][C]0.426633[/C][/ROW]
[ROW][C]47[/C][C]-0.032762[/C][C]-0.2538[/C][C]0.400269[/C][/ROW]
[ROW][C]48[/C][C]0.235477[/C][C]1.824[/C][C]0.036567[/C][/ROW]
[ROW][C]49[/C][C]0.080987[/C][C]0.6273[/C][C]0.266415[/C][/ROW]
[ROW][C]50[/C][C]-0.022294[/C][C]-0.1727[/C][C]0.431738[/C][/ROW]
[ROW][C]51[/C][C]0.104033[/C][C]0.8058[/C][C]0.211759[/C][/ROW]
[ROW][C]52[/C][C]-0.018746[/C][C]-0.1452[/C][C]0.442517[/C][/ROW]
[ROW][C]53[/C][C]-0.031013[/C][C]-0.2402[/C][C]0.405486[/C][/ROW]
[ROW][C]54[/C][C]0.067409[/C][C]0.5222[/C][C]0.301744[/C][/ROW]
[ROW][C]55[/C][C]-0.032257[/C][C]-0.2499[/C][C]0.401775[/C][/ROW]
[ROW][C]56[/C][C]-0.071004[/C][C]-0.55[/C][C]0.292183[/C][/ROW]
[ROW][C]57[/C][C]-0.014999[/C][C]-0.1162[/C][C]0.453949[/C][/ROW]
[ROW][C]58[/C][C]-0.045337[/C][C]-0.3512[/C][C]0.363343[/C][/ROW]
[ROW][C]59[/C][C]-0.035978[/C][C]-0.2787[/C][C]0.390722[/C][/ROW]
[ROW][C]60[/C][C]NA[/C][C]NA[/C][C]NA[/C][/ROW]
[/TABLE]
Source: https://freestatistics.org/blog/index.php?pk=63850&T=1

Globally Unique Identifier (entire table): ba.freestatistics.org/blog/index.php?pk=63850&T=1

As an alternative you can also use a QR Code:  

The GUIDs for individual cells are displayed in the table below:

Autocorrelation Function
Time lag kACF(k)T-STATP-value
10.0455080.35250.362849
2-0.137553-1.06550.145463
30.3023222.34180.011265
4-0.204869-1.58690.058895
50.0141180.10940.456641
60.4171453.23120.001002
7-0.138398-1.0720.144001
8-0.165745-1.28390.102064
90.1011040.78310.21831
10-0.286897-2.22230.015022
11-0.020425-0.15820.437409
120.4697963.6390.000286
13-0.010395-0.08050.468047
14-0.200811-1.55550.062546
15-0.006552-0.05080.479845
16-0.179444-1.390.084837
17-0.107684-0.83410.203762
180.1777751.3770.086808
19-0.085561-0.66280.255013
20-0.241312-1.86920.03324
21-0.014686-0.11380.454906
22-0.158771-1.22980.111779
23-0.088369-0.68450.248145
240.2765732.14230.018117
250.1108860.85890.196902
26-0.235807-1.82660.036371
27-0.00757-0.05860.476719
28-0.099537-0.7710.221862
29-0.198184-1.53510.065005
300.1274760.98740.163701
310.0077080.05970.476295
32-0.246041-1.90580.030733
33-0.038615-0.29910.382945
34-0.046979-0.36390.358606
35-0.145449-1.12660.13219
360.2116841.63970.053151
370.1439641.11510.134619
38-0.192954-1.49460.070128
390.0590290.45720.324575
400.0062310.04830.480834
41-0.133269-1.03230.153038
420.1834651.42110.08023
430.0489610.37920.352921
44-0.141666-1.09730.138439
450.1223040.94740.173628
460.0239810.18580.426633
47-0.032762-0.25380.400269
480.2354771.8240.036567
490.0809870.62730.266415
50-0.022294-0.17270.431738
510.1040330.80580.211759
52-0.018746-0.14520.442517
53-0.031013-0.24020.405486
540.0674090.52220.301744
55-0.032257-0.24990.401775
56-0.071004-0.550.292183
57-0.014999-0.11620.453949
58-0.045337-0.35120.363343
59-0.035978-0.27870.390722
60NANANA


Partial Autocorrelation Function
Time lag kPACF(k)T-STATP-value
10.0455080.35250.362849
2-0.139914-1.08380.141401
30.3227992.50040.007578
4-0.30857-2.39020.009999
50.2256561.74790.042797
60.2333681.80770.037837
7-0.089216-0.69110.246095
8-0.166142-1.28690.101531
9-0.047066-0.36460.358357
10-0.179867-1.39320.084343
110.0654630.50710.306981
120.3562062.75920.003836
130.1325891.0270.154265
14-0.245904-1.90480.030804
15-0.261882-2.02850.023476
160.0230850.17880.429344
17-0.146801-1.13710.130006
18-0.111924-0.8670.19471
190.0067060.05190.479372
200.0062980.04880.480627
210.0215880.16720.433879
220.0435610.33740.368489
230.0411870.3190.375406
24-0.070167-0.54350.294395
250.0481830.37320.355148
26-0.168351-1.3040.0986
270.0133810.10370.458896
28-0.18487-1.4320.078667
29-0.103183-0.79930.213649
30-0.139229-1.07850.142572
310.1052120.8150.209157
32-0.011469-0.08880.464752
33-0.047208-0.36570.357948
340.0373320.28920.386722
35-0.05078-0.39330.347731
36-0.072461-0.56130.288349
37-0.126553-0.98030.165443
38-0.043518-0.33710.368614
390.0133010.1030.45914
400.0085230.0660.47379
410.0802920.62190.268168
420.0828310.64160.261786
43-0.139774-1.08270.141641
44-0.023069-0.17870.429391
450.1351751.04710.149635
46-0.026804-0.20760.418112
47-0.005416-0.0420.483338
48-0.088557-0.6860.247691
49-0.016363-0.12670.449782
500.0128890.09980.460402
510.0653980.50660.307156
52-0.04756-0.36840.356938
530.0136150.10550.458181
54-0.10166-0.78750.217057
55-0.021745-0.16840.433404
56-0.065494-0.50730.306898
57-0.12178-0.94330.174654
58-0.131907-1.02170.155501
59-0.047203-0.36560.357963
60NANANA

\begin{tabular}{lllllllll}
\hline
Partial Autocorrelation Function \tabularnewline
Time lag k & PACF(k) & T-STAT & P-value \tabularnewline
1 & 0.045508 & 0.3525 & 0.362849 \tabularnewline
2 & -0.139914 & -1.0838 & 0.141401 \tabularnewline
3 & 0.322799 & 2.5004 & 0.007578 \tabularnewline
4 & -0.30857 & -2.3902 & 0.009999 \tabularnewline
5 & 0.225656 & 1.7479 & 0.042797 \tabularnewline
6 & 0.233368 & 1.8077 & 0.037837 \tabularnewline
7 & -0.089216 & -0.6911 & 0.246095 \tabularnewline
8 & -0.166142 & -1.2869 & 0.101531 \tabularnewline
9 & -0.047066 & -0.3646 & 0.358357 \tabularnewline
10 & -0.179867 & -1.3932 & 0.084343 \tabularnewline
11 & 0.065463 & 0.5071 & 0.306981 \tabularnewline
12 & 0.356206 & 2.7592 & 0.003836 \tabularnewline
13 & 0.132589 & 1.027 & 0.154265 \tabularnewline
14 & -0.245904 & -1.9048 & 0.030804 \tabularnewline
15 & -0.261882 & -2.0285 & 0.023476 \tabularnewline
16 & 0.023085 & 0.1788 & 0.429344 \tabularnewline
17 & -0.146801 & -1.1371 & 0.130006 \tabularnewline
18 & -0.111924 & -0.867 & 0.19471 \tabularnewline
19 & 0.006706 & 0.0519 & 0.479372 \tabularnewline
20 & 0.006298 & 0.0488 & 0.480627 \tabularnewline
21 & 0.021588 & 0.1672 & 0.433879 \tabularnewline
22 & 0.043561 & 0.3374 & 0.368489 \tabularnewline
23 & 0.041187 & 0.319 & 0.375406 \tabularnewline
24 & -0.070167 & -0.5435 & 0.294395 \tabularnewline
25 & 0.048183 & 0.3732 & 0.355148 \tabularnewline
26 & -0.168351 & -1.304 & 0.0986 \tabularnewline
27 & 0.013381 & 0.1037 & 0.458896 \tabularnewline
28 & -0.18487 & -1.432 & 0.078667 \tabularnewline
29 & -0.103183 & -0.7993 & 0.213649 \tabularnewline
30 & -0.139229 & -1.0785 & 0.142572 \tabularnewline
31 & 0.105212 & 0.815 & 0.209157 \tabularnewline
32 & -0.011469 & -0.0888 & 0.464752 \tabularnewline
33 & -0.047208 & -0.3657 & 0.357948 \tabularnewline
34 & 0.037332 & 0.2892 & 0.386722 \tabularnewline
35 & -0.05078 & -0.3933 & 0.347731 \tabularnewline
36 & -0.072461 & -0.5613 & 0.288349 \tabularnewline
37 & -0.126553 & -0.9803 & 0.165443 \tabularnewline
38 & -0.043518 & -0.3371 & 0.368614 \tabularnewline
39 & 0.013301 & 0.103 & 0.45914 \tabularnewline
40 & 0.008523 & 0.066 & 0.47379 \tabularnewline
41 & 0.080292 & 0.6219 & 0.268168 \tabularnewline
42 & 0.082831 & 0.6416 & 0.261786 \tabularnewline
43 & -0.139774 & -1.0827 & 0.141641 \tabularnewline
44 & -0.023069 & -0.1787 & 0.429391 \tabularnewline
45 & 0.135175 & 1.0471 & 0.149635 \tabularnewline
46 & -0.026804 & -0.2076 & 0.418112 \tabularnewline
47 & -0.005416 & -0.042 & 0.483338 \tabularnewline
48 & -0.088557 & -0.686 & 0.247691 \tabularnewline
49 & -0.016363 & -0.1267 & 0.449782 \tabularnewline
50 & 0.012889 & 0.0998 & 0.460402 \tabularnewline
51 & 0.065398 & 0.5066 & 0.307156 \tabularnewline
52 & -0.04756 & -0.3684 & 0.356938 \tabularnewline
53 & 0.013615 & 0.1055 & 0.458181 \tabularnewline
54 & -0.10166 & -0.7875 & 0.217057 \tabularnewline
55 & -0.021745 & -0.1684 & 0.433404 \tabularnewline
56 & -0.065494 & -0.5073 & 0.306898 \tabularnewline
57 & -0.12178 & -0.9433 & 0.174654 \tabularnewline
58 & -0.131907 & -1.0217 & 0.155501 \tabularnewline
59 & -0.047203 & -0.3656 & 0.357963 \tabularnewline
60 & NA & NA & NA \tabularnewline
\hline
\end{tabular}
%Source: https://freestatistics.org/blog/index.php?pk=63850&T=2

[TABLE]
[ROW][C]Partial Autocorrelation Function[/C][/ROW]
[ROW][C]Time lag k[/C][C]PACF(k)[/C][C]T-STAT[/C][C]P-value[/C][/ROW]
[ROW][C]1[/C][C]0.045508[/C][C]0.3525[/C][C]0.362849[/C][/ROW]
[ROW][C]2[/C][C]-0.139914[/C][C]-1.0838[/C][C]0.141401[/C][/ROW]
[ROW][C]3[/C][C]0.322799[/C][C]2.5004[/C][C]0.007578[/C][/ROW]
[ROW][C]4[/C][C]-0.30857[/C][C]-2.3902[/C][C]0.009999[/C][/ROW]
[ROW][C]5[/C][C]0.225656[/C][C]1.7479[/C][C]0.042797[/C][/ROW]
[ROW][C]6[/C][C]0.233368[/C][C]1.8077[/C][C]0.037837[/C][/ROW]
[ROW][C]7[/C][C]-0.089216[/C][C]-0.6911[/C][C]0.246095[/C][/ROW]
[ROW][C]8[/C][C]-0.166142[/C][C]-1.2869[/C][C]0.101531[/C][/ROW]
[ROW][C]9[/C][C]-0.047066[/C][C]-0.3646[/C][C]0.358357[/C][/ROW]
[ROW][C]10[/C][C]-0.179867[/C][C]-1.3932[/C][C]0.084343[/C][/ROW]
[ROW][C]11[/C][C]0.065463[/C][C]0.5071[/C][C]0.306981[/C][/ROW]
[ROW][C]12[/C][C]0.356206[/C][C]2.7592[/C][C]0.003836[/C][/ROW]
[ROW][C]13[/C][C]0.132589[/C][C]1.027[/C][C]0.154265[/C][/ROW]
[ROW][C]14[/C][C]-0.245904[/C][C]-1.9048[/C][C]0.030804[/C][/ROW]
[ROW][C]15[/C][C]-0.261882[/C][C]-2.0285[/C][C]0.023476[/C][/ROW]
[ROW][C]16[/C][C]0.023085[/C][C]0.1788[/C][C]0.429344[/C][/ROW]
[ROW][C]17[/C][C]-0.146801[/C][C]-1.1371[/C][C]0.130006[/C][/ROW]
[ROW][C]18[/C][C]-0.111924[/C][C]-0.867[/C][C]0.19471[/C][/ROW]
[ROW][C]19[/C][C]0.006706[/C][C]0.0519[/C][C]0.479372[/C][/ROW]
[ROW][C]20[/C][C]0.006298[/C][C]0.0488[/C][C]0.480627[/C][/ROW]
[ROW][C]21[/C][C]0.021588[/C][C]0.1672[/C][C]0.433879[/C][/ROW]
[ROW][C]22[/C][C]0.043561[/C][C]0.3374[/C][C]0.368489[/C][/ROW]
[ROW][C]23[/C][C]0.041187[/C][C]0.319[/C][C]0.375406[/C][/ROW]
[ROW][C]24[/C][C]-0.070167[/C][C]-0.5435[/C][C]0.294395[/C][/ROW]
[ROW][C]25[/C][C]0.048183[/C][C]0.3732[/C][C]0.355148[/C][/ROW]
[ROW][C]26[/C][C]-0.168351[/C][C]-1.304[/C][C]0.0986[/C][/ROW]
[ROW][C]27[/C][C]0.013381[/C][C]0.1037[/C][C]0.458896[/C][/ROW]
[ROW][C]28[/C][C]-0.18487[/C][C]-1.432[/C][C]0.078667[/C][/ROW]
[ROW][C]29[/C][C]-0.103183[/C][C]-0.7993[/C][C]0.213649[/C][/ROW]
[ROW][C]30[/C][C]-0.139229[/C][C]-1.0785[/C][C]0.142572[/C][/ROW]
[ROW][C]31[/C][C]0.105212[/C][C]0.815[/C][C]0.209157[/C][/ROW]
[ROW][C]32[/C][C]-0.011469[/C][C]-0.0888[/C][C]0.464752[/C][/ROW]
[ROW][C]33[/C][C]-0.047208[/C][C]-0.3657[/C][C]0.357948[/C][/ROW]
[ROW][C]34[/C][C]0.037332[/C][C]0.2892[/C][C]0.386722[/C][/ROW]
[ROW][C]35[/C][C]-0.05078[/C][C]-0.3933[/C][C]0.347731[/C][/ROW]
[ROW][C]36[/C][C]-0.072461[/C][C]-0.5613[/C][C]0.288349[/C][/ROW]
[ROW][C]37[/C][C]-0.126553[/C][C]-0.9803[/C][C]0.165443[/C][/ROW]
[ROW][C]38[/C][C]-0.043518[/C][C]-0.3371[/C][C]0.368614[/C][/ROW]
[ROW][C]39[/C][C]0.013301[/C][C]0.103[/C][C]0.45914[/C][/ROW]
[ROW][C]40[/C][C]0.008523[/C][C]0.066[/C][C]0.47379[/C][/ROW]
[ROW][C]41[/C][C]0.080292[/C][C]0.6219[/C][C]0.268168[/C][/ROW]
[ROW][C]42[/C][C]0.082831[/C][C]0.6416[/C][C]0.261786[/C][/ROW]
[ROW][C]43[/C][C]-0.139774[/C][C]-1.0827[/C][C]0.141641[/C][/ROW]
[ROW][C]44[/C][C]-0.023069[/C][C]-0.1787[/C][C]0.429391[/C][/ROW]
[ROW][C]45[/C][C]0.135175[/C][C]1.0471[/C][C]0.149635[/C][/ROW]
[ROW][C]46[/C][C]-0.026804[/C][C]-0.2076[/C][C]0.418112[/C][/ROW]
[ROW][C]47[/C][C]-0.005416[/C][C]-0.042[/C][C]0.483338[/C][/ROW]
[ROW][C]48[/C][C]-0.088557[/C][C]-0.686[/C][C]0.247691[/C][/ROW]
[ROW][C]49[/C][C]-0.016363[/C][C]-0.1267[/C][C]0.449782[/C][/ROW]
[ROW][C]50[/C][C]0.012889[/C][C]0.0998[/C][C]0.460402[/C][/ROW]
[ROW][C]51[/C][C]0.065398[/C][C]0.5066[/C][C]0.307156[/C][/ROW]
[ROW][C]52[/C][C]-0.04756[/C][C]-0.3684[/C][C]0.356938[/C][/ROW]
[ROW][C]53[/C][C]0.013615[/C][C]0.1055[/C][C]0.458181[/C][/ROW]
[ROW][C]54[/C][C]-0.10166[/C][C]-0.7875[/C][C]0.217057[/C][/ROW]
[ROW][C]55[/C][C]-0.021745[/C][C]-0.1684[/C][C]0.433404[/C][/ROW]
[ROW][C]56[/C][C]-0.065494[/C][C]-0.5073[/C][C]0.306898[/C][/ROW]
[ROW][C]57[/C][C]-0.12178[/C][C]-0.9433[/C][C]0.174654[/C][/ROW]
[ROW][C]58[/C][C]-0.131907[/C][C]-1.0217[/C][C]0.155501[/C][/ROW]
[ROW][C]59[/C][C]-0.047203[/C][C]-0.3656[/C][C]0.357963[/C][/ROW]
[ROW][C]60[/C][C]NA[/C][C]NA[/C][C]NA[/C][/ROW]
[/TABLE]
Source: https://freestatistics.org/blog/index.php?pk=63850&T=2

Globally Unique Identifier (entire table): ba.freestatistics.org/blog/index.php?pk=63850&T=2

As an alternative you can also use a QR Code:  

The GUIDs for individual cells are displayed in the table below:

Partial Autocorrelation Function
Time lag kPACF(k)T-STATP-value
10.0455080.35250.362849
2-0.139914-1.08380.141401
30.3227992.50040.007578
4-0.30857-2.39020.009999
50.2256561.74790.042797
60.2333681.80770.037837
7-0.089216-0.69110.246095
8-0.166142-1.28690.101531
9-0.047066-0.36460.358357
10-0.179867-1.39320.084343
110.0654630.50710.306981
120.3562062.75920.003836
130.1325891.0270.154265
14-0.245904-1.90480.030804
15-0.261882-2.02850.023476
160.0230850.17880.429344
17-0.146801-1.13710.130006
18-0.111924-0.8670.19471
190.0067060.05190.479372
200.0062980.04880.480627
210.0215880.16720.433879
220.0435610.33740.368489
230.0411870.3190.375406
24-0.070167-0.54350.294395
250.0481830.37320.355148
26-0.168351-1.3040.0986
270.0133810.10370.458896
28-0.18487-1.4320.078667
29-0.103183-0.79930.213649
30-0.139229-1.07850.142572
310.1052120.8150.209157
32-0.011469-0.08880.464752
33-0.047208-0.36570.357948
340.0373320.28920.386722
35-0.05078-0.39330.347731
36-0.072461-0.56130.288349
37-0.126553-0.98030.165443
38-0.043518-0.33710.368614
390.0133010.1030.45914
400.0085230.0660.47379
410.0802920.62190.268168
420.0828310.64160.261786
43-0.139774-1.08270.141641
44-0.023069-0.17870.429391
450.1351751.04710.149635
46-0.026804-0.20760.418112
47-0.005416-0.0420.483338
48-0.088557-0.6860.247691
49-0.016363-0.12670.449782
500.0128890.09980.460402
510.0653980.50660.307156
52-0.04756-0.36840.356938
530.0136150.10550.458181
54-0.10166-0.78750.217057
55-0.021745-0.16840.433404
56-0.065494-0.50730.306898
57-0.12178-0.94330.174654
58-0.131907-1.02170.155501
59-0.047203-0.36560.357963
60NANANA


Parameters (Session):
par1 = 60 ; par2 = 1 ; par3 = 0 ; par4 = 0 ; par5 = 12 ; par6 = White Noise ; par7 = 0.95 ;
Parameters (R input):
par1 = 60 ; par2 = 1 ; par3 = 0 ; par4 = 0 ; par5 = 12 ; par6 = White Noise ; par7 = 0.95 ;
R code (references can be found in the software module):
if (par1 == 'Default') {
par1 = 10*log10(length(x))
} else {
par1 <- as.numeric(par1)
}
par2 <- as.numeric(par2)
par3 <- as.numeric(par3)
par4 <- as.numeric(par4)
par5 <- as.numeric(par5)
if (par6 == 'White Noise') par6 <- 'white' else par6 <- 'ma'
par7 <- as.numeric(par7)
if (par2 == 0) {
x <- log(x)
} else {
x <- (x ^ par2 - 1) / par2
}
if (par3 > 0) x <- diff(x,lag=1,difference=par3)
if (par4 > 0) x <- diff(x,lag=par5,difference=par4)
bitmap(file='pic1.png')
racf <- acf(x, par1, main='Autocorrelation', xlab='time lag', ylab='ACF', ci.type=par6, ci=par7, sub=paste('(lambda=',par2,', d=',par3,', D=',par4,', CI=', par7, ', CI type=',par6,')',sep=''))
dev.off()
bitmap(file='pic2.png')
rpacf <- pacf(x,par1,main='Partial Autocorrelation',xlab='lags',ylab='PACF')
dev.off()
(myacf <- c(racf$acf))
(mypacf <- c(rpacf$acf))
lengthx <- length(x)
sqrtn <- sqrt(lengthx)
load(file='createtable')
a<-table.start()
a<-table.row.start(a)
a<-table.element(a,'Autocorrelation Function',4,TRUE)
a<-table.row.end(a)
a<-table.row.start(a)
a<-table.element(a,'Time lag k',header=TRUE)
a<-table.element(a,hyperlink('basics.htm','ACF(k)','click here for more information about the Autocorrelation Function'),header=TRUE)
a<-table.element(a,'T-STAT',header=TRUE)
a<-table.element(a,'P-value',header=TRUE)
a<-table.row.end(a)
for (i in 2:(par1+1)) {
a<-table.row.start(a)
a<-table.element(a,i-1,header=TRUE)
a<-table.element(a,round(myacf[i],6))
mytstat <- myacf[i]*sqrtn
a<-table.element(a,round(mytstat,4))
a<-table.element(a,round(1-pt(abs(mytstat),lengthx),6))
a<-table.row.end(a)
}
a<-table.end(a)
table.save(a,file='mytable.tab')
a<-table.start()
a<-table.row.start(a)
a<-table.element(a,'Partial Autocorrelation Function',4,TRUE)
a<-table.row.end(a)
a<-table.row.start(a)
a<-table.element(a,'Time lag k',header=TRUE)
a<-table.element(a,hyperlink('basics.htm','PACF(k)','click here for more information about the Partial Autocorrelation Function'),header=TRUE)
a<-table.element(a,'T-STAT',header=TRUE)
a<-table.element(a,'P-value',header=TRUE)
a<-table.row.end(a)
for (i in 1:par1) {
a<-table.row.start(a)
a<-table.element(a,i,header=TRUE)
a<-table.element(a,round(mypacf[i],6))
mytstat <- mypacf[i]*sqrtn
a<-table.element(a,round(mytstat,4))
a<-table.element(a,round(1-pt(abs(mytstat),lengthx),6))
a<-table.row.end(a)
}
a<-table.end(a)
table.save(a,file='mytable1.tab')