Free Statistics

of Irreproducible Research!

Author's title

Author*The author of this computation has been verified*
R Software Modulerwasp_exponentialsmoothing.wasp
Title produced by softwareExponential Smoothing
Date of computationFri, 04 Dec 2009 09:21:26 -0700
Cite this page as followsStatistical Computations at FreeStatistics.org, Office for Research Development and Education, URL https://freestatistics.org/blog/index.php?v=date/2009/Dec/04/t1259943812af6q7n4ypzh24ce.htm/, Retrieved Sat, 27 Apr 2024 19:07:56 +0000
Statistical Computations at FreeStatistics.org, Office for Research Development and Education, URL https://freestatistics.org/blog/index.php?pk=63851, Retrieved Sat, 27 Apr 2024 19:07:56 +0000
QR Codes:

Original text written by user:
IsPrivate?No (this computation is public)
User-defined keywords
Estimated Impact99
Family? (F = Feedback message, R = changed R code, M = changed R Module, P = changed Parameters, D = changed Data)
-     [Univariate Data Series] [data set] [2008-12-01 19:54:57] [b98453cac15ba1066b407e146608df68]
- RMP   [Exponential Smoothing] [] [2009-11-27 15:04:36] [b98453cac15ba1066b407e146608df68]
-    D      [Exponential Smoothing] [WS 9, Populair mo...] [2009-12-04 16:21:26] [e31f2fa83f4a5291b9a51009566cf69b] [Current]
Feedback Forum

Post a new message
Dataseries X:
95.1
97
112.7
102.9
97.4
111.4
87.4
96.8
114.1
110.3
103.9
101.6
94.6
95.9
104.7
102.8
98.1
113.9
80.9
95.7
113.2
105.9
108.8
102.3
99
100.7
115.5
100.7
109.9
114.6
85.4
100.5
114.8
116.5
112.9
102
106
105.3
118.8
106.1
109.3
117.2
92.5
104.2
112.5
122.4
113.3
100
110.7
112.8
109.8
117.3
109.1
115.9
96
99.8
116.8
115.7
99.4
94.3


Summary of computational transaction
Raw Inputview raw input (R code)
Raw Outputview raw output of R engine
Computing time1 seconds
R Server'Gwilym Jenkins' @ 72.249.127.135

\begin{tabular}{lllllllll}
\hline
Summary of computational transaction \tabularnewline
Raw Input & view raw input (R code)  \tabularnewline
Raw Output & view raw output of R engine  \tabularnewline
Computing time & 1 seconds \tabularnewline
R Server & 'Gwilym Jenkins' @ 72.249.127.135 \tabularnewline
\hline
\end{tabular}
%Source: https://freestatistics.org/blog/index.php?pk=63851&T=0

[TABLE]
[ROW][C]Summary of computational transaction[/C][/ROW]
[ROW][C]Raw Input[/C][C]view raw input (R code) [/C][/ROW]
[ROW][C]Raw Output[/C][C]view raw output of R engine [/C][/ROW]
[ROW][C]Computing time[/C][C]1 seconds[/C][/ROW]
[ROW][C]R Server[/C][C]'Gwilym Jenkins' @ 72.249.127.135[/C][/ROW]
[/TABLE]
Source: https://freestatistics.org/blog/index.php?pk=63851&T=0

Globally Unique Identifier (entire table): ba.freestatistics.org/blog/index.php?pk=63851&T=0

As an alternative you can also use a QR Code:  

The GUIDs for individual cells are displayed in the table below:

Summary of computational transaction
Raw Inputview raw input (R code)
Raw Outputview raw output of R engine
Computing time1 seconds
R Server'Gwilym Jenkins' @ 72.249.127.135


Estimated Parameters of Exponential Smoothing
ParameterValue
alpha0.149518688899873
beta0
gamma1

\begin{tabular}{lllllllll}
\hline
Estimated Parameters of Exponential Smoothing \tabularnewline
Parameter & Value \tabularnewline
alpha & 0.149518688899873 \tabularnewline
beta & 0 \tabularnewline
gamma & 1 \tabularnewline
\hline
\end{tabular}
%Source: https://freestatistics.org/blog/index.php?pk=63851&T=1

[TABLE]
[ROW][C]Estimated Parameters of Exponential Smoothing[/C][/ROW]
[ROW][C]Parameter[/C][C]Value[/C][/ROW]
[ROW][C]alpha[/C][C]0.149518688899873[/C][/ROW]
[ROW][C]beta[/C][C]0[/C][/ROW]
[ROW][C]gamma[/C][C]1[/C][/ROW]
[/TABLE]
Source: https://freestatistics.org/blog/index.php?pk=63851&T=1

Globally Unique Identifier (entire table): ba.freestatistics.org/blog/index.php?pk=63851&T=1

As an alternative you can also use a QR Code:  

The GUIDs for individual cells are displayed in the table below:

Estimated Parameters of Exponential Smoothing
ParameterValue
alpha0.149518688899873
beta0
gamma1


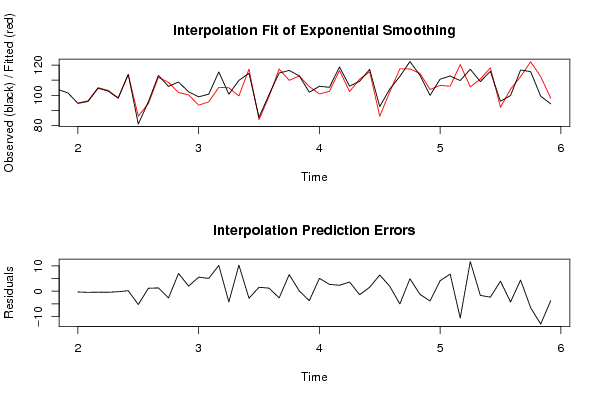
Interpolation Forecasts of Exponential Smoothing
tObservedFittedResiduals
1394.694.919856849353-0.319856849352945
1495.996.3617041743281-0.461704174328105
15104.7105.090201458249-0.390201458249422
16102.8103.228104975216-0.428104975216129
1798.198.3098622055097-0.209862205509722
18113.9113.708693266720.191306733280030
1980.986.186058175999-5.28605817599895
2095.794.52740952043021.17259047956985
21113.2111.9073542750411.29264572495933
22105.9108.595572393490-2.69557239349042
23108.8101.7663113665487.0336886334517
24102.3100.2898019165552.01019808344506
259993.4322302979965.56776970200396
26100.795.6282129934955.07178700650498
27115.5105.29027100168610.2097289983143
28100.7104.945952689777-4.2459526897772
29109.999.57551896353410.3244810364659
30114.6117.380159869492-2.78015986949163
3185.483.84813894430581.55186105569418
32100.599.28236144160821.21763855839184
33114.8117.455317038801-2.6553170388012
34116.5109.9218033656376.57819663436301
35112.9112.7831568564690.116843143531099
36102105.749217937900-3.74921793790038
37106100.8997908785175.10020912148258
38105.3102.5977153713572.70228462864254
39118.8116.4547596177932.34524038220671
40106.1102.4592780558133.64072194418722
41109.3110.700874128831-1.40087412883109
42117.2115.6269018078801.5730981921198
4392.586.10334727243476.39665272756531
44104.2102.2679748635191.93202513648102
45112.5117.549583435051-5.04958343505081
46122.4117.4753247437494.92467525625108
47113.3114.542942131052-1.24294213105208
48100103.868557811495-3.86855781149458
49110.7106.5371124152014.16288758479921
50112.8106.0356394346076.76436056539315
51109.8120.410727400431-10.6107274004306
52117.3105.56082638985411.7391736101455
53109.1110.763744612496-1.66374461249593
54115.9118.263731328191-2.36373132819064
559692.03890674130263.96109325869742
5699.8104.054004442563-4.25400444256285
57116.8112.3764768516704.42352314833039
58115.7122.219811614452-6.51981161445212
5999.4112.412014768593-13.0120147685929
6094.398.0422085770475-3.74220857704752

\begin{tabular}{lllllllll}
\hline
Interpolation Forecasts of Exponential Smoothing \tabularnewline
t & Observed & Fitted & Residuals \tabularnewline
13 & 94.6 & 94.919856849353 & -0.319856849352945 \tabularnewline
14 & 95.9 & 96.3617041743281 & -0.461704174328105 \tabularnewline
15 & 104.7 & 105.090201458249 & -0.390201458249422 \tabularnewline
16 & 102.8 & 103.228104975216 & -0.428104975216129 \tabularnewline
17 & 98.1 & 98.3098622055097 & -0.209862205509722 \tabularnewline
18 & 113.9 & 113.70869326672 & 0.191306733280030 \tabularnewline
19 & 80.9 & 86.186058175999 & -5.28605817599895 \tabularnewline
20 & 95.7 & 94.5274095204302 & 1.17259047956985 \tabularnewline
21 & 113.2 & 111.907354275041 & 1.29264572495933 \tabularnewline
22 & 105.9 & 108.595572393490 & -2.69557239349042 \tabularnewline
23 & 108.8 & 101.766311366548 & 7.0336886334517 \tabularnewline
24 & 102.3 & 100.289801916555 & 2.01019808344506 \tabularnewline
25 & 99 & 93.432230297996 & 5.56776970200396 \tabularnewline
26 & 100.7 & 95.628212993495 & 5.07178700650498 \tabularnewline
27 & 115.5 & 105.290271001686 & 10.2097289983143 \tabularnewline
28 & 100.7 & 104.945952689777 & -4.2459526897772 \tabularnewline
29 & 109.9 & 99.575518963534 & 10.3244810364659 \tabularnewline
30 & 114.6 & 117.380159869492 & -2.78015986949163 \tabularnewline
31 & 85.4 & 83.8481389443058 & 1.55186105569418 \tabularnewline
32 & 100.5 & 99.2823614416082 & 1.21763855839184 \tabularnewline
33 & 114.8 & 117.455317038801 & -2.6553170388012 \tabularnewline
34 & 116.5 & 109.921803365637 & 6.57819663436301 \tabularnewline
35 & 112.9 & 112.783156856469 & 0.116843143531099 \tabularnewline
36 & 102 & 105.749217937900 & -3.74921793790038 \tabularnewline
37 & 106 & 100.899790878517 & 5.10020912148258 \tabularnewline
38 & 105.3 & 102.597715371357 & 2.70228462864254 \tabularnewline
39 & 118.8 & 116.454759617793 & 2.34524038220671 \tabularnewline
40 & 106.1 & 102.459278055813 & 3.64072194418722 \tabularnewline
41 & 109.3 & 110.700874128831 & -1.40087412883109 \tabularnewline
42 & 117.2 & 115.626901807880 & 1.5730981921198 \tabularnewline
43 & 92.5 & 86.1033472724347 & 6.39665272756531 \tabularnewline
44 & 104.2 & 102.267974863519 & 1.93202513648102 \tabularnewline
45 & 112.5 & 117.549583435051 & -5.04958343505081 \tabularnewline
46 & 122.4 & 117.475324743749 & 4.92467525625108 \tabularnewline
47 & 113.3 & 114.542942131052 & -1.24294213105208 \tabularnewline
48 & 100 & 103.868557811495 & -3.86855781149458 \tabularnewline
49 & 110.7 & 106.537112415201 & 4.16288758479921 \tabularnewline
50 & 112.8 & 106.035639434607 & 6.76436056539315 \tabularnewline
51 & 109.8 & 120.410727400431 & -10.6107274004306 \tabularnewline
52 & 117.3 & 105.560826389854 & 11.7391736101455 \tabularnewline
53 & 109.1 & 110.763744612496 & -1.66374461249593 \tabularnewline
54 & 115.9 & 118.263731328191 & -2.36373132819064 \tabularnewline
55 & 96 & 92.0389067413026 & 3.96109325869742 \tabularnewline
56 & 99.8 & 104.054004442563 & -4.25400444256285 \tabularnewline
57 & 116.8 & 112.376476851670 & 4.42352314833039 \tabularnewline
58 & 115.7 & 122.219811614452 & -6.51981161445212 \tabularnewline
59 & 99.4 & 112.412014768593 & -13.0120147685929 \tabularnewline
60 & 94.3 & 98.0422085770475 & -3.74220857704752 \tabularnewline
\hline
\end{tabular}
%Source: https://freestatistics.org/blog/index.php?pk=63851&T=2

[TABLE]
[ROW][C]Interpolation Forecasts of Exponential Smoothing[/C][/ROW]
[ROW][C]t[/C][C]Observed[/C][C]Fitted[/C][C]Residuals[/C][/ROW]
[ROW][C]13[/C][C]94.6[/C][C]94.919856849353[/C][C]-0.319856849352945[/C][/ROW]
[ROW][C]14[/C][C]95.9[/C][C]96.3617041743281[/C][C]-0.461704174328105[/C][/ROW]
[ROW][C]15[/C][C]104.7[/C][C]105.090201458249[/C][C]-0.390201458249422[/C][/ROW]
[ROW][C]16[/C][C]102.8[/C][C]103.228104975216[/C][C]-0.428104975216129[/C][/ROW]
[ROW][C]17[/C][C]98.1[/C][C]98.3098622055097[/C][C]-0.209862205509722[/C][/ROW]
[ROW][C]18[/C][C]113.9[/C][C]113.70869326672[/C][C]0.191306733280030[/C][/ROW]
[ROW][C]19[/C][C]80.9[/C][C]86.186058175999[/C][C]-5.28605817599895[/C][/ROW]
[ROW][C]20[/C][C]95.7[/C][C]94.5274095204302[/C][C]1.17259047956985[/C][/ROW]
[ROW][C]21[/C][C]113.2[/C][C]111.907354275041[/C][C]1.29264572495933[/C][/ROW]
[ROW][C]22[/C][C]105.9[/C][C]108.595572393490[/C][C]-2.69557239349042[/C][/ROW]
[ROW][C]23[/C][C]108.8[/C][C]101.766311366548[/C][C]7.0336886334517[/C][/ROW]
[ROW][C]24[/C][C]102.3[/C][C]100.289801916555[/C][C]2.01019808344506[/C][/ROW]
[ROW][C]25[/C][C]99[/C][C]93.432230297996[/C][C]5.56776970200396[/C][/ROW]
[ROW][C]26[/C][C]100.7[/C][C]95.628212993495[/C][C]5.07178700650498[/C][/ROW]
[ROW][C]27[/C][C]115.5[/C][C]105.290271001686[/C][C]10.2097289983143[/C][/ROW]
[ROW][C]28[/C][C]100.7[/C][C]104.945952689777[/C][C]-4.2459526897772[/C][/ROW]
[ROW][C]29[/C][C]109.9[/C][C]99.575518963534[/C][C]10.3244810364659[/C][/ROW]
[ROW][C]30[/C][C]114.6[/C][C]117.380159869492[/C][C]-2.78015986949163[/C][/ROW]
[ROW][C]31[/C][C]85.4[/C][C]83.8481389443058[/C][C]1.55186105569418[/C][/ROW]
[ROW][C]32[/C][C]100.5[/C][C]99.2823614416082[/C][C]1.21763855839184[/C][/ROW]
[ROW][C]33[/C][C]114.8[/C][C]117.455317038801[/C][C]-2.6553170388012[/C][/ROW]
[ROW][C]34[/C][C]116.5[/C][C]109.921803365637[/C][C]6.57819663436301[/C][/ROW]
[ROW][C]35[/C][C]112.9[/C][C]112.783156856469[/C][C]0.116843143531099[/C][/ROW]
[ROW][C]36[/C][C]102[/C][C]105.749217937900[/C][C]-3.74921793790038[/C][/ROW]
[ROW][C]37[/C][C]106[/C][C]100.899790878517[/C][C]5.10020912148258[/C][/ROW]
[ROW][C]38[/C][C]105.3[/C][C]102.597715371357[/C][C]2.70228462864254[/C][/ROW]
[ROW][C]39[/C][C]118.8[/C][C]116.454759617793[/C][C]2.34524038220671[/C][/ROW]
[ROW][C]40[/C][C]106.1[/C][C]102.459278055813[/C][C]3.64072194418722[/C][/ROW]
[ROW][C]41[/C][C]109.3[/C][C]110.700874128831[/C][C]-1.40087412883109[/C][/ROW]
[ROW][C]42[/C][C]117.2[/C][C]115.626901807880[/C][C]1.5730981921198[/C][/ROW]
[ROW][C]43[/C][C]92.5[/C][C]86.1033472724347[/C][C]6.39665272756531[/C][/ROW]
[ROW][C]44[/C][C]104.2[/C][C]102.267974863519[/C][C]1.93202513648102[/C][/ROW]
[ROW][C]45[/C][C]112.5[/C][C]117.549583435051[/C][C]-5.04958343505081[/C][/ROW]
[ROW][C]46[/C][C]122.4[/C][C]117.475324743749[/C][C]4.92467525625108[/C][/ROW]
[ROW][C]47[/C][C]113.3[/C][C]114.542942131052[/C][C]-1.24294213105208[/C][/ROW]
[ROW][C]48[/C][C]100[/C][C]103.868557811495[/C][C]-3.86855781149458[/C][/ROW]
[ROW][C]49[/C][C]110.7[/C][C]106.537112415201[/C][C]4.16288758479921[/C][/ROW]
[ROW][C]50[/C][C]112.8[/C][C]106.035639434607[/C][C]6.76436056539315[/C][/ROW]
[ROW][C]51[/C][C]109.8[/C][C]120.410727400431[/C][C]-10.6107274004306[/C][/ROW]
[ROW][C]52[/C][C]117.3[/C][C]105.560826389854[/C][C]11.7391736101455[/C][/ROW]
[ROW][C]53[/C][C]109.1[/C][C]110.763744612496[/C][C]-1.66374461249593[/C][/ROW]
[ROW][C]54[/C][C]115.9[/C][C]118.263731328191[/C][C]-2.36373132819064[/C][/ROW]
[ROW][C]55[/C][C]96[/C][C]92.0389067413026[/C][C]3.96109325869742[/C][/ROW]
[ROW][C]56[/C][C]99.8[/C][C]104.054004442563[/C][C]-4.25400444256285[/C][/ROW]
[ROW][C]57[/C][C]116.8[/C][C]112.376476851670[/C][C]4.42352314833039[/C][/ROW]
[ROW][C]58[/C][C]115.7[/C][C]122.219811614452[/C][C]-6.51981161445212[/C][/ROW]
[ROW][C]59[/C][C]99.4[/C][C]112.412014768593[/C][C]-13.0120147685929[/C][/ROW]
[ROW][C]60[/C][C]94.3[/C][C]98.0422085770475[/C][C]-3.74220857704752[/C][/ROW]
[/TABLE]
Source: https://freestatistics.org/blog/index.php?pk=63851&T=2

Globally Unique Identifier (entire table): ba.freestatistics.org/blog/index.php?pk=63851&T=2

As an alternative you can also use a QR Code:  

The GUIDs for individual cells are displayed in the table below:

Interpolation Forecasts of Exponential Smoothing
tObservedFittedResiduals
1394.694.919856849353-0.319856849352945
1495.996.3617041743281-0.461704174328105
15104.7105.090201458249-0.390201458249422
16102.8103.228104975216-0.428104975216129
1798.198.3098622055097-0.209862205509722
18113.9113.708693266720.191306733280030
1980.986.186058175999-5.28605817599895
2095.794.52740952043021.17259047956985
21113.2111.9073542750411.29264572495933
22105.9108.595572393490-2.69557239349042
23108.8101.7663113665487.0336886334517
24102.3100.2898019165552.01019808344506
259993.4322302979965.56776970200396
26100.795.6282129934955.07178700650498
27115.5105.29027100168610.2097289983143
28100.7104.945952689777-4.2459526897772
29109.999.57551896353410.3244810364659
30114.6117.380159869492-2.78015986949163
3185.483.84813894430581.55186105569418
32100.599.28236144160821.21763855839184
33114.8117.455317038801-2.6553170388012
34116.5109.9218033656376.57819663436301
35112.9112.7831568564690.116843143531099
36102105.749217937900-3.74921793790038
37106100.8997908785175.10020912148258
38105.3102.5977153713572.70228462864254
39118.8116.4547596177932.34524038220671
40106.1102.4592780558133.64072194418722
41109.3110.700874128831-1.40087412883109
42117.2115.6269018078801.5730981921198
4392.586.10334727243476.39665272756531
44104.2102.2679748635191.93202513648102
45112.5117.549583435051-5.04958343505081
46122.4117.4753247437494.92467525625108
47113.3114.542942131052-1.24294213105208
48100103.868557811495-3.86855781149458
49110.7106.5371124152014.16288758479921
50112.8106.0356394346076.76436056539315
51109.8120.410727400431-10.6107274004306
52117.3105.56082638985411.7391736101455
53109.1110.763744612496-1.66374461249593
54115.9118.263731328191-2.36373132819064
559692.03890674130263.96109325869742
5699.8104.054004442563-4.25400444256285
57116.8112.3764768516704.42352314833039
58115.7122.219811614452-6.51981161445212
5999.4112.412014768593-13.0120147685929
6094.398.0422085770475-3.74220857704752


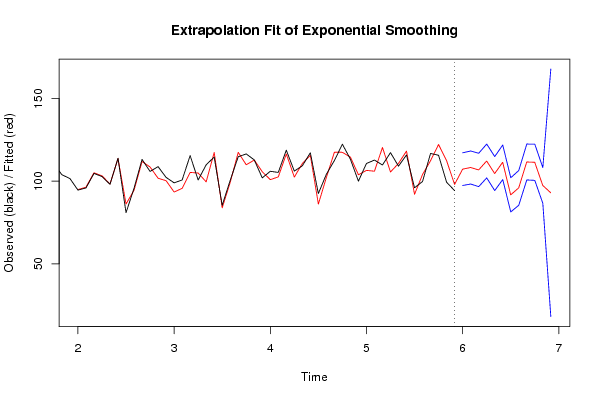
Extrapolation Forecasts of Exponential Smoothing
tForecast95% Lower Bound95% Upper Bound
61107.28332410770697.392467790993117.17418042442
62108.28169339963198.2785808314555118.284805967807
63106.80408190988396.6976633658894116.910500453877
64112.229636447467101.981675390702122.477597504231
65104.61367513230594.3181698332825114.909180431328
66111.461710351872100.992108041063121.931312662682
6791.729288570586781.3700653732765102.088511767897
6895.941646717166285.4236820238656106.459611410467
69111.622270349227100.752042590325122.492498108128
70111.454141710823100.484419359337122.423864062309
7197.43441971684386.6295328862718108.239306547414
7292.963626289401917.9729655925062167.954286986298

\begin{tabular}{lllllllll}
\hline
Extrapolation Forecasts of Exponential Smoothing \tabularnewline
t & Forecast & 95% Lower Bound & 95% Upper Bound \tabularnewline
61 & 107.283324107706 & 97.392467790993 & 117.17418042442 \tabularnewline
62 & 108.281693399631 & 98.2785808314555 & 118.284805967807 \tabularnewline
63 & 106.804081909883 & 96.6976633658894 & 116.910500453877 \tabularnewline
64 & 112.229636447467 & 101.981675390702 & 122.477597504231 \tabularnewline
65 & 104.613675132305 & 94.3181698332825 & 114.909180431328 \tabularnewline
66 & 111.461710351872 & 100.992108041063 & 121.931312662682 \tabularnewline
67 & 91.7292885705867 & 81.3700653732765 & 102.088511767897 \tabularnewline
68 & 95.9416467171662 & 85.4236820238656 & 106.459611410467 \tabularnewline
69 & 111.622270349227 & 100.752042590325 & 122.492498108128 \tabularnewline
70 & 111.454141710823 & 100.484419359337 & 122.423864062309 \tabularnewline
71 & 97.434419716843 & 86.6295328862718 & 108.239306547414 \tabularnewline
72 & 92.9636262894019 & 17.9729655925062 & 167.954286986298 \tabularnewline
\hline
\end{tabular}
%Source: https://freestatistics.org/blog/index.php?pk=63851&T=3

[TABLE]
[ROW][C]Extrapolation Forecasts of Exponential Smoothing[/C][/ROW]
[ROW][C]t[/C][C]Forecast[/C][C]95% Lower Bound[/C][C]95% Upper Bound[/C][/ROW]
[ROW][C]61[/C][C]107.283324107706[/C][C]97.392467790993[/C][C]117.17418042442[/C][/ROW]
[ROW][C]62[/C][C]108.281693399631[/C][C]98.2785808314555[/C][C]118.284805967807[/C][/ROW]
[ROW][C]63[/C][C]106.804081909883[/C][C]96.6976633658894[/C][C]116.910500453877[/C][/ROW]
[ROW][C]64[/C][C]112.229636447467[/C][C]101.981675390702[/C][C]122.477597504231[/C][/ROW]
[ROW][C]65[/C][C]104.613675132305[/C][C]94.3181698332825[/C][C]114.909180431328[/C][/ROW]
[ROW][C]66[/C][C]111.461710351872[/C][C]100.992108041063[/C][C]121.931312662682[/C][/ROW]
[ROW][C]67[/C][C]91.7292885705867[/C][C]81.3700653732765[/C][C]102.088511767897[/C][/ROW]
[ROW][C]68[/C][C]95.9416467171662[/C][C]85.4236820238656[/C][C]106.459611410467[/C][/ROW]
[ROW][C]69[/C][C]111.622270349227[/C][C]100.752042590325[/C][C]122.492498108128[/C][/ROW]
[ROW][C]70[/C][C]111.454141710823[/C][C]100.484419359337[/C][C]122.423864062309[/C][/ROW]
[ROW][C]71[/C][C]97.434419716843[/C][C]86.6295328862718[/C][C]108.239306547414[/C][/ROW]
[ROW][C]72[/C][C]92.9636262894019[/C][C]17.9729655925062[/C][C]167.954286986298[/C][/ROW]
[/TABLE]
Source: https://freestatistics.org/blog/index.php?pk=63851&T=3

Globally Unique Identifier (entire table): ba.freestatistics.org/blog/index.php?pk=63851&T=3

As an alternative you can also use a QR Code:  

The GUIDs for individual cells are displayed in the table below:

Extrapolation Forecasts of Exponential Smoothing
tForecast95% Lower Bound95% Upper Bound
61107.28332410770697.392467790993117.17418042442
62108.28169339963198.2785808314555118.284805967807
63106.80408190988396.6976633658894116.910500453877
64112.229636447467101.981675390702122.477597504231
65104.61367513230594.3181698332825114.909180431328
66111.461710351872100.992108041063121.931312662682
6791.729288570586781.3700653732765102.088511767897
6895.941646717166285.4236820238656106.459611410467
69111.622270349227100.752042590325122.492498108128
70111.454141710823100.484419359337122.423864062309
7197.43441971684386.6295328862718108.239306547414
7292.963626289401917.9729655925062167.954286986298


Parameters (Session):
par1 = 12 ; par2 = Triple ; par3 = multiplicative ;
Parameters (R input):
par1 = 12 ; par2 = Triple ; par3 = multiplicative ;
R code (references can be found in the software module):
par1 <- as.numeric(par1)
if (par2 == 'Single') K <- 1
if (par2 == 'Double') K <- 2
if (par2 == 'Triple') K <- par1
nx <- length(x)
nxmK <- nx - K
x <- ts(x, frequency = par1)
if (par2 == 'Single') fit <- HoltWinters(x, gamma=0, beta=0)
if (par2 == 'Double') fit <- HoltWinters(x, gamma=0)
if (par2 == 'Triple') fit <- HoltWinters(x, seasonal=par3)
fit
myresid <- x - fit$fitted[,'xhat']
bitmap(file='test1.png')
op <- par(mfrow=c(2,1))
plot(fit,ylab='Observed (black) / Fitted (red)',main='Interpolation Fit of Exponential Smoothing')
plot(myresid,ylab='Residuals',main='Interpolation Prediction Errors')
par(op)
dev.off()
bitmap(file='test2.png')
p <- predict(fit, par1, prediction.interval=TRUE)
np <- length(p[,1])
plot(fit,p,ylab='Observed (black) / Fitted (red)',main='Extrapolation Fit of Exponential Smoothing')
dev.off()
bitmap(file='test3.png')
op <- par(mfrow = c(2,2))
acf(as.numeric(myresid),lag.max = nx/2,main='Residual ACF')
spectrum(myresid,main='Residals Periodogram')
cpgram(myresid,main='Residal Cumulative Periodogram')
qqnorm(myresid,main='Residual Normal QQ Plot')
qqline(myresid)
par(op)
dev.off()
load(file='createtable')
a<-table.start()
a<-table.row.start(a)
a<-table.element(a,'Estimated Parameters of Exponential Smoothing',2,TRUE)
a<-table.row.end(a)
a<-table.row.start(a)
a<-table.element(a,'Parameter',header=TRUE)
a<-table.element(a,'Value',header=TRUE)
a<-table.row.end(a)
a<-table.row.start(a)
a<-table.element(a,'alpha',header=TRUE)
a<-table.element(a,fit$alpha)
a<-table.row.end(a)
a<-table.row.start(a)
a<-table.element(a,'beta',header=TRUE)
a<-table.element(a,fit$beta)
a<-table.row.end(a)
a<-table.row.start(a)
a<-table.element(a,'gamma',header=TRUE)
a<-table.element(a,fit$gamma)
a<-table.row.end(a)
a<-table.end(a)
table.save(a,file='mytable.tab')
a<-table.start()
a<-table.row.start(a)
a<-table.element(a,'Interpolation Forecasts of Exponential Smoothing',4,TRUE)
a<-table.row.end(a)
a<-table.row.start(a)
a<-table.element(a,'t',header=TRUE)
a<-table.element(a,'Observed',header=TRUE)
a<-table.element(a,'Fitted',header=TRUE)
a<-table.element(a,'Residuals',header=TRUE)
a<-table.row.end(a)
for (i in 1:nxmK) {
a<-table.row.start(a)
a<-table.element(a,i+K,header=TRUE)
a<-table.element(a,x[i+K])
a<-table.element(a,fit$fitted[i,'xhat'])
a<-table.element(a,myresid[i])
a<-table.row.end(a)
}
a<-table.end(a)
table.save(a,file='mytable1.tab')
a<-table.start()
a<-table.row.start(a)
a<-table.element(a,'Extrapolation Forecasts of Exponential Smoothing',4,TRUE)
a<-table.row.end(a)
a<-table.row.start(a)
a<-table.element(a,'t',header=TRUE)
a<-table.element(a,'Forecast',header=TRUE)
a<-table.element(a,'95% Lower Bound',header=TRUE)
a<-table.element(a,'95% Upper Bound',header=TRUE)
a<-table.row.end(a)
for (i in 1:np) {
a<-table.row.start(a)
a<-table.element(a,nx+i,header=TRUE)
a<-table.element(a,p[i,'fit'])
a<-table.element(a,p[i,'lwr'])
a<-table.element(a,p[i,'upr'])
a<-table.row.end(a)
}
a<-table.end(a)
table.save(a,file='mytable2.tab')