Free Statistics

of Irreproducible Research!

Author's title

Author*The author of this computation has been verified*
R Software Modulerwasp_exponentialsmoothing.wasp
Title produced by softwareExponential Smoothing
Date of computationFri, 04 Dec 2009 09:26:41 -0700
Cite this page as followsStatistical Computations at FreeStatistics.org, Office for Research Development and Education, URL https://freestatistics.org/blog/index.php?v=date/2009/Dec/04/t12599441177rshu7589pavlx6.htm/, Retrieved Sat, 27 Apr 2024 17:43:24 +0000
Statistical Computations at FreeStatistics.org, Office for Research Development and Education, URL https://freestatistics.org/blog/index.php?pk=63860, Retrieved Sat, 27 Apr 2024 17:43:24 +0000
QR Codes:

Original text written by user:
IsPrivate?No (this computation is public)
User-defined keywordsShwWs9forcasting4
Estimated Impact117
Family? (F = Feedback message, R = changed R code, M = changed R Module, P = changed Parameters, D = changed Data)
-     [Univariate Data Series] [data set] [2008-12-01 19:54:57] [b98453cac15ba1066b407e146608df68]
- RMP   [Exponential Smoothing] [] [2009-11-27 15:04:36] [b98453cac15ba1066b407e146608df68]
-    D      [Exponential Smoothing] [Ws9forcasting4] [2009-12-04 16:26:41] [51108381f3361ca8af49c4f74052c840] [Current]
Feedback Forum

Post a new message
Dataseries X:
58608
46865
51378
46235
47206
45382
41227
33795
31295
42625
33625
21538
56421
53152
53536
52408
41454
38271
35306
26414
31917
38030
27534
18387
50556
43901
48572
43899
37532
40357
35489
29027
34485
42598
30306
26451
47460
50104
61465
53726
39477
43895
31481
29896
33842
39120
33702
25094
51442
45594
52518
48564
41745
49585
32747
33379
35645
37034
35681
20972


Summary of computational transaction
Raw Inputview raw input (R code)
Raw Outputview raw output of R engine
Computing time1 seconds
R Server'Gwilym Jenkins' @ 72.249.127.135

\begin{tabular}{lllllllll}
\hline
Summary of computational transaction \tabularnewline
Raw Input & view raw input (R code)  \tabularnewline
Raw Output & view raw output of R engine  \tabularnewline
Computing time & 1 seconds \tabularnewline
R Server & 'Gwilym Jenkins' @ 72.249.127.135 \tabularnewline
\hline
\end{tabular}
%Source: https://freestatistics.org/blog/index.php?pk=63860&T=0

[TABLE]
[ROW][C]Summary of computational transaction[/C][/ROW]
[ROW][C]Raw Input[/C][C]view raw input (R code) [/C][/ROW]
[ROW][C]Raw Output[/C][C]view raw output of R engine [/C][/ROW]
[ROW][C]Computing time[/C][C]1 seconds[/C][/ROW]
[ROW][C]R Server[/C][C]'Gwilym Jenkins' @ 72.249.127.135[/C][/ROW]
[/TABLE]
Source: https://freestatistics.org/blog/index.php?pk=63860&T=0

Globally Unique Identifier (entire table): ba.freestatistics.org/blog/index.php?pk=63860&T=0

As an alternative you can also use a QR Code:  

The GUIDs for individual cells are displayed in the table below:

Summary of computational transaction
Raw Inputview raw input (R code)
Raw Outputview raw output of R engine
Computing time1 seconds
R Server'Gwilym Jenkins' @ 72.249.127.135


Estimated Parameters of Exponential Smoothing
ParameterValue
alpha0.199376799003901
beta0
gamma0.684151704720979

\begin{tabular}{lllllllll}
\hline
Estimated Parameters of Exponential Smoothing \tabularnewline
Parameter & Value \tabularnewline
alpha & 0.199376799003901 \tabularnewline
beta & 0 \tabularnewline
gamma & 0.684151704720979 \tabularnewline
\hline
\end{tabular}
%Source: https://freestatistics.org/blog/index.php?pk=63860&T=1

[TABLE]
[ROW][C]Estimated Parameters of Exponential Smoothing[/C][/ROW]
[ROW][C]Parameter[/C][C]Value[/C][/ROW]
[ROW][C]alpha[/C][C]0.199376799003901[/C][/ROW]
[ROW][C]beta[/C][C]0[/C][/ROW]
[ROW][C]gamma[/C][C]0.684151704720979[/C][/ROW]
[/TABLE]
Source: https://freestatistics.org/blog/index.php?pk=63860&T=1

Globally Unique Identifier (entire table): ba.freestatistics.org/blog/index.php?pk=63860&T=1

As an alternative you can also use a QR Code:  

The GUIDs for individual cells are displayed in the table below:

Estimated Parameters of Exponential Smoothing
ParameterValue
alpha0.199376799003901
beta0
gamma0.684151704720979


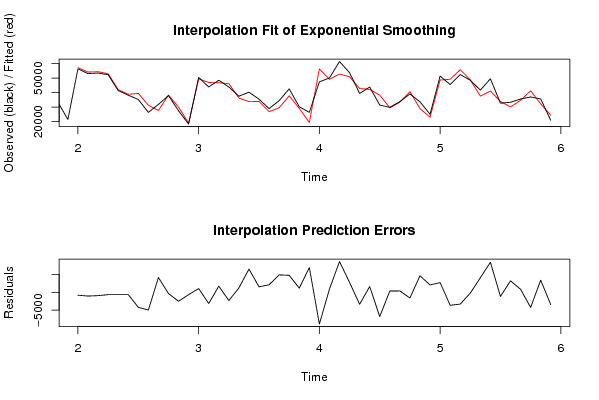
Interpolation Forecasts of Exponential Smoothing
tObservedFittedResiduals
135642157234.381038922-813.381038922009
145315254201.1357606105-1049.13576061049
155353654461.1980064574-925.198006457373
165240853057.4198218257-649.419821825708
174145442097.387400011-643.387400011001
183827138905.0556552769-634.05565527692
193530639515.6186778861-4209.61867788613
202641431391.1847454938-4977.18474549379
213191727746.50526794114170.49473205891
223803038378.6830845338-348.683084533761
232753430028.7838410811-2494.7838410811
241838719041.5831630339-654.583163033851
255055649491.95617106551064.04382893450
264390147033.0895712692-3132.08957126924
274857246834.94875034281737.05124965725
284389946207.4166924274-2308.41669242737
293753236294.37357746421237.62642253582
304035733827.7981178826529.201882118
313548933949.12381060131539.87618939874
322902726905.01628168682121.98371831315
333448529589.10740656044895.89259343959
344259837817.49392423954780.50607576048
353030629132.37820283291173.62179716713
362645119482.33120147276968.66879852731
374746056370.3845567696-8910.3845567696
385010449197.7801417312906.219858268814
396146552820.07575127378644.92424872626
405372650952.42120214462773.5787978554
413947742841.3859745836-3364.38597458358
424389542261.99704770721633.00295229285
433148138295.1509791512-6814.15097915116
442989629526.4138223395369.586177660527
453384233446.4831296276395.51687037239
463912040711.7028193735-1591.70281937352
473370229050.39416519474651.6058348053
482509423021.05135823802072.94864176204
495144248708.45592825712733.54407174286
504559449230.1589700954-3636.15897009538
515251855820.2128373136-3302.21283731356
524856448791.8887243184-227.888724318414
534174537645.42392788654099.57607211349
544958541142.86003563998442.13996436012
553274733903.1120178406-1156.11201784058
563337930150.25749781253228.74250218748
573564534789.0996927706855.900307229422
583703441279.1139050477-4245.11390504766
593568132249.75736723783431.24263276219
602097224441.1266246407-3469.12662464072

\begin{tabular}{lllllllll}
\hline
Interpolation Forecasts of Exponential Smoothing \tabularnewline
t & Observed & Fitted & Residuals \tabularnewline
13 & 56421 & 57234.381038922 & -813.381038922009 \tabularnewline
14 & 53152 & 54201.1357606105 & -1049.13576061049 \tabularnewline
15 & 53536 & 54461.1980064574 & -925.198006457373 \tabularnewline
16 & 52408 & 53057.4198218257 & -649.419821825708 \tabularnewline
17 & 41454 & 42097.387400011 & -643.387400011001 \tabularnewline
18 & 38271 & 38905.0556552769 & -634.05565527692 \tabularnewline
19 & 35306 & 39515.6186778861 & -4209.61867788613 \tabularnewline
20 & 26414 & 31391.1847454938 & -4977.18474549379 \tabularnewline
21 & 31917 & 27746.5052679411 & 4170.49473205891 \tabularnewline
22 & 38030 & 38378.6830845338 & -348.683084533761 \tabularnewline
23 & 27534 & 30028.7838410811 & -2494.7838410811 \tabularnewline
24 & 18387 & 19041.5831630339 & -654.583163033851 \tabularnewline
25 & 50556 & 49491.9561710655 & 1064.04382893450 \tabularnewline
26 & 43901 & 47033.0895712692 & -3132.08957126924 \tabularnewline
27 & 48572 & 46834.9487503428 & 1737.05124965725 \tabularnewline
28 & 43899 & 46207.4166924274 & -2308.41669242737 \tabularnewline
29 & 37532 & 36294.3735774642 & 1237.62642253582 \tabularnewline
30 & 40357 & 33827.798117882 & 6529.201882118 \tabularnewline
31 & 35489 & 33949.1238106013 & 1539.87618939874 \tabularnewline
32 & 29027 & 26905.0162816868 & 2121.98371831315 \tabularnewline
33 & 34485 & 29589.1074065604 & 4895.89259343959 \tabularnewline
34 & 42598 & 37817.4939242395 & 4780.50607576048 \tabularnewline
35 & 30306 & 29132.3782028329 & 1173.62179716713 \tabularnewline
36 & 26451 & 19482.3312014727 & 6968.66879852731 \tabularnewline
37 & 47460 & 56370.3845567696 & -8910.3845567696 \tabularnewline
38 & 50104 & 49197.7801417312 & 906.219858268814 \tabularnewline
39 & 61465 & 52820.0757512737 & 8644.92424872626 \tabularnewline
40 & 53726 & 50952.4212021446 & 2773.5787978554 \tabularnewline
41 & 39477 & 42841.3859745836 & -3364.38597458358 \tabularnewline
42 & 43895 & 42261.9970477072 & 1633.00295229285 \tabularnewline
43 & 31481 & 38295.1509791512 & -6814.15097915116 \tabularnewline
44 & 29896 & 29526.4138223395 & 369.586177660527 \tabularnewline
45 & 33842 & 33446.4831296276 & 395.51687037239 \tabularnewline
46 & 39120 & 40711.7028193735 & -1591.70281937352 \tabularnewline
47 & 33702 & 29050.3941651947 & 4651.6058348053 \tabularnewline
48 & 25094 & 23021.0513582380 & 2072.94864176204 \tabularnewline
49 & 51442 & 48708.4559282571 & 2733.54407174286 \tabularnewline
50 & 45594 & 49230.1589700954 & -3636.15897009538 \tabularnewline
51 & 52518 & 55820.2128373136 & -3302.21283731356 \tabularnewline
52 & 48564 & 48791.8887243184 & -227.888724318414 \tabularnewline
53 & 41745 & 37645.4239278865 & 4099.57607211349 \tabularnewline
54 & 49585 & 41142.8600356399 & 8442.13996436012 \tabularnewline
55 & 32747 & 33903.1120178406 & -1156.11201784058 \tabularnewline
56 & 33379 & 30150.2574978125 & 3228.74250218748 \tabularnewline
57 & 35645 & 34789.0996927706 & 855.900307229422 \tabularnewline
58 & 37034 & 41279.1139050477 & -4245.11390504766 \tabularnewline
59 & 35681 & 32249.7573672378 & 3431.24263276219 \tabularnewline
60 & 20972 & 24441.1266246407 & -3469.12662464072 \tabularnewline
\hline
\end{tabular}
%Source: https://freestatistics.org/blog/index.php?pk=63860&T=2

[TABLE]
[ROW][C]Interpolation Forecasts of Exponential Smoothing[/C][/ROW]
[ROW][C]t[/C][C]Observed[/C][C]Fitted[/C][C]Residuals[/C][/ROW]
[ROW][C]13[/C][C]56421[/C][C]57234.381038922[/C][C]-813.381038922009[/C][/ROW]
[ROW][C]14[/C][C]53152[/C][C]54201.1357606105[/C][C]-1049.13576061049[/C][/ROW]
[ROW][C]15[/C][C]53536[/C][C]54461.1980064574[/C][C]-925.198006457373[/C][/ROW]
[ROW][C]16[/C][C]52408[/C][C]53057.4198218257[/C][C]-649.419821825708[/C][/ROW]
[ROW][C]17[/C][C]41454[/C][C]42097.387400011[/C][C]-643.387400011001[/C][/ROW]
[ROW][C]18[/C][C]38271[/C][C]38905.0556552769[/C][C]-634.05565527692[/C][/ROW]
[ROW][C]19[/C][C]35306[/C][C]39515.6186778861[/C][C]-4209.61867788613[/C][/ROW]
[ROW][C]20[/C][C]26414[/C][C]31391.1847454938[/C][C]-4977.18474549379[/C][/ROW]
[ROW][C]21[/C][C]31917[/C][C]27746.5052679411[/C][C]4170.49473205891[/C][/ROW]
[ROW][C]22[/C][C]38030[/C][C]38378.6830845338[/C][C]-348.683084533761[/C][/ROW]
[ROW][C]23[/C][C]27534[/C][C]30028.7838410811[/C][C]-2494.7838410811[/C][/ROW]
[ROW][C]24[/C][C]18387[/C][C]19041.5831630339[/C][C]-654.583163033851[/C][/ROW]
[ROW][C]25[/C][C]50556[/C][C]49491.9561710655[/C][C]1064.04382893450[/C][/ROW]
[ROW][C]26[/C][C]43901[/C][C]47033.0895712692[/C][C]-3132.08957126924[/C][/ROW]
[ROW][C]27[/C][C]48572[/C][C]46834.9487503428[/C][C]1737.05124965725[/C][/ROW]
[ROW][C]28[/C][C]43899[/C][C]46207.4166924274[/C][C]-2308.41669242737[/C][/ROW]
[ROW][C]29[/C][C]37532[/C][C]36294.3735774642[/C][C]1237.62642253582[/C][/ROW]
[ROW][C]30[/C][C]40357[/C][C]33827.798117882[/C][C]6529.201882118[/C][/ROW]
[ROW][C]31[/C][C]35489[/C][C]33949.1238106013[/C][C]1539.87618939874[/C][/ROW]
[ROW][C]32[/C][C]29027[/C][C]26905.0162816868[/C][C]2121.98371831315[/C][/ROW]
[ROW][C]33[/C][C]34485[/C][C]29589.1074065604[/C][C]4895.89259343959[/C][/ROW]
[ROW][C]34[/C][C]42598[/C][C]37817.4939242395[/C][C]4780.50607576048[/C][/ROW]
[ROW][C]35[/C][C]30306[/C][C]29132.3782028329[/C][C]1173.62179716713[/C][/ROW]
[ROW][C]36[/C][C]26451[/C][C]19482.3312014727[/C][C]6968.66879852731[/C][/ROW]
[ROW][C]37[/C][C]47460[/C][C]56370.3845567696[/C][C]-8910.3845567696[/C][/ROW]
[ROW][C]38[/C][C]50104[/C][C]49197.7801417312[/C][C]906.219858268814[/C][/ROW]
[ROW][C]39[/C][C]61465[/C][C]52820.0757512737[/C][C]8644.92424872626[/C][/ROW]
[ROW][C]40[/C][C]53726[/C][C]50952.4212021446[/C][C]2773.5787978554[/C][/ROW]
[ROW][C]41[/C][C]39477[/C][C]42841.3859745836[/C][C]-3364.38597458358[/C][/ROW]
[ROW][C]42[/C][C]43895[/C][C]42261.9970477072[/C][C]1633.00295229285[/C][/ROW]
[ROW][C]43[/C][C]31481[/C][C]38295.1509791512[/C][C]-6814.15097915116[/C][/ROW]
[ROW][C]44[/C][C]29896[/C][C]29526.4138223395[/C][C]369.586177660527[/C][/ROW]
[ROW][C]45[/C][C]33842[/C][C]33446.4831296276[/C][C]395.51687037239[/C][/ROW]
[ROW][C]46[/C][C]39120[/C][C]40711.7028193735[/C][C]-1591.70281937352[/C][/ROW]
[ROW][C]47[/C][C]33702[/C][C]29050.3941651947[/C][C]4651.6058348053[/C][/ROW]
[ROW][C]48[/C][C]25094[/C][C]23021.0513582380[/C][C]2072.94864176204[/C][/ROW]
[ROW][C]49[/C][C]51442[/C][C]48708.4559282571[/C][C]2733.54407174286[/C][/ROW]
[ROW][C]50[/C][C]45594[/C][C]49230.1589700954[/C][C]-3636.15897009538[/C][/ROW]
[ROW][C]51[/C][C]52518[/C][C]55820.2128373136[/C][C]-3302.21283731356[/C][/ROW]
[ROW][C]52[/C][C]48564[/C][C]48791.8887243184[/C][C]-227.888724318414[/C][/ROW]
[ROW][C]53[/C][C]41745[/C][C]37645.4239278865[/C][C]4099.57607211349[/C][/ROW]
[ROW][C]54[/C][C]49585[/C][C]41142.8600356399[/C][C]8442.13996436012[/C][/ROW]
[ROW][C]55[/C][C]32747[/C][C]33903.1120178406[/C][C]-1156.11201784058[/C][/ROW]
[ROW][C]56[/C][C]33379[/C][C]30150.2574978125[/C][C]3228.74250218748[/C][/ROW]
[ROW][C]57[/C][C]35645[/C][C]34789.0996927706[/C][C]855.900307229422[/C][/ROW]
[ROW][C]58[/C][C]37034[/C][C]41279.1139050477[/C][C]-4245.11390504766[/C][/ROW]
[ROW][C]59[/C][C]35681[/C][C]32249.7573672378[/C][C]3431.24263276219[/C][/ROW]
[ROW][C]60[/C][C]20972[/C][C]24441.1266246407[/C][C]-3469.12662464072[/C][/ROW]
[/TABLE]
Source: https://freestatistics.org/blog/index.php?pk=63860&T=2

Globally Unique Identifier (entire table): ba.freestatistics.org/blog/index.php?pk=63860&T=2

As an alternative you can also use a QR Code:  

The GUIDs for individual cells are displayed in the table below:

Interpolation Forecasts of Exponential Smoothing
tObservedFittedResiduals
135642157234.381038922-813.381038922009
145315254201.1357606105-1049.13576061049
155353654461.1980064574-925.198006457373
165240853057.4198218257-649.419821825708
174145442097.387400011-643.387400011001
183827138905.0556552769-634.05565527692
193530639515.6186778861-4209.61867788613
202641431391.1847454938-4977.18474549379
213191727746.50526794114170.49473205891
223803038378.6830845338-348.683084533761
232753430028.7838410811-2494.7838410811
241838719041.5831630339-654.583163033851
255055649491.95617106551064.04382893450
264390147033.0895712692-3132.08957126924
274857246834.94875034281737.05124965725
284389946207.4166924274-2308.41669242737
293753236294.37357746421237.62642253582
304035733827.7981178826529.201882118
313548933949.12381060131539.87618939874
322902726905.01628168682121.98371831315
333448529589.10740656044895.89259343959
344259837817.49392423954780.50607576048
353030629132.37820283291173.62179716713
362645119482.33120147276968.66879852731
374746056370.3845567696-8910.3845567696
385010449197.7801417312906.219858268814
396146552820.07575127378644.92424872626
405372650952.42120214462773.5787978554
413947742841.3859745836-3364.38597458358
424389542261.99704770721633.00295229285
433148138295.1509791512-6814.15097915116
442989629526.4138223395369.586177660527
453384233446.4831296276395.51687037239
463912040711.7028193735-1591.70281937352
473370229050.39416519474651.6058348053
482509423021.05135823802072.94864176204
495144248708.45592825712733.54407174286
504559449230.1589700954-3636.15897009538
515251855820.2128373136-3302.21283731356
524856448791.8887243184-227.888724318414
534174537645.42392788654099.57607211349
544958541142.86003563998442.13996436012
553274733903.1120178406-1156.11201784058
563337930150.25749781253228.74250218748
573564534789.0996927706855.900307229422
583703441279.1139050477-4245.11390504766
593568132249.75736723783431.24263276219
602097224441.1266246407-3469.12662464072


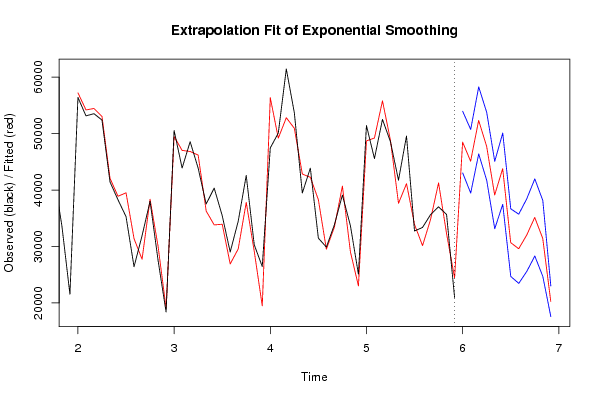
Extrapolation Forecasts of Exponential Smoothing
tForecast95% Lower Bound95% Upper Bound
6148503.759474482543039.819901516853967.6990474481
6245106.489798565139474.835990222850738.1436069073
6352347.084416231546406.579008329858287.5898241332
6447743.847868085441725.434118879253762.2616172915
6539119.603426089633150.810696055145088.396156124
6643795.682091894337480.927190181450110.4369936071
6730688.798567068724697.668038167536679.92909597
6829600.455275402423472.966538069135727.9440127356
6932030.24402297325588.568025085338471.9200208608
7035152.042699997928322.245542608041981.8398573878
7131430.763457610724709.735775116238151.7911401052
7220288.178576902417574.940520777323001.4166330275

\begin{tabular}{lllllllll}
\hline
Extrapolation Forecasts of Exponential Smoothing \tabularnewline
t & Forecast & 95% Lower Bound & 95% Upper Bound \tabularnewline
61 & 48503.7594744825 & 43039.8199015168 & 53967.6990474481 \tabularnewline
62 & 45106.4897985651 & 39474.8359902228 & 50738.1436069073 \tabularnewline
63 & 52347.0844162315 & 46406.5790083298 & 58287.5898241332 \tabularnewline
64 & 47743.8478680854 & 41725.4341188792 & 53762.2616172915 \tabularnewline
65 & 39119.6034260896 & 33150.8106960551 & 45088.396156124 \tabularnewline
66 & 43795.6820918943 & 37480.9271901814 & 50110.4369936071 \tabularnewline
67 & 30688.7985670687 & 24697.6680381675 & 36679.92909597 \tabularnewline
68 & 29600.4552754024 & 23472.9665380691 & 35727.9440127356 \tabularnewline
69 & 32030.244022973 & 25588.5680250853 & 38471.9200208608 \tabularnewline
70 & 35152.0426999979 & 28322.2455426080 & 41981.8398573878 \tabularnewline
71 & 31430.7634576107 & 24709.7357751162 & 38151.7911401052 \tabularnewline
72 & 20288.1785769024 & 17574.9405207773 & 23001.4166330275 \tabularnewline
\hline
\end{tabular}
%Source: https://freestatistics.org/blog/index.php?pk=63860&T=3

[TABLE]
[ROW][C]Extrapolation Forecasts of Exponential Smoothing[/C][/ROW]
[ROW][C]t[/C][C]Forecast[/C][C]95% Lower Bound[/C][C]95% Upper Bound[/C][/ROW]
[ROW][C]61[/C][C]48503.7594744825[/C][C]43039.8199015168[/C][C]53967.6990474481[/C][/ROW]
[ROW][C]62[/C][C]45106.4897985651[/C][C]39474.8359902228[/C][C]50738.1436069073[/C][/ROW]
[ROW][C]63[/C][C]52347.0844162315[/C][C]46406.5790083298[/C][C]58287.5898241332[/C][/ROW]
[ROW][C]64[/C][C]47743.8478680854[/C][C]41725.4341188792[/C][C]53762.2616172915[/C][/ROW]
[ROW][C]65[/C][C]39119.6034260896[/C][C]33150.8106960551[/C][C]45088.396156124[/C][/ROW]
[ROW][C]66[/C][C]43795.6820918943[/C][C]37480.9271901814[/C][C]50110.4369936071[/C][/ROW]
[ROW][C]67[/C][C]30688.7985670687[/C][C]24697.6680381675[/C][C]36679.92909597[/C][/ROW]
[ROW][C]68[/C][C]29600.4552754024[/C][C]23472.9665380691[/C][C]35727.9440127356[/C][/ROW]
[ROW][C]69[/C][C]32030.244022973[/C][C]25588.5680250853[/C][C]38471.9200208608[/C][/ROW]
[ROW][C]70[/C][C]35152.0426999979[/C][C]28322.2455426080[/C][C]41981.8398573878[/C][/ROW]
[ROW][C]71[/C][C]31430.7634576107[/C][C]24709.7357751162[/C][C]38151.7911401052[/C][/ROW]
[ROW][C]72[/C][C]20288.1785769024[/C][C]17574.9405207773[/C][C]23001.4166330275[/C][/ROW]
[/TABLE]
Source: https://freestatistics.org/blog/index.php?pk=63860&T=3

Globally Unique Identifier (entire table): ba.freestatistics.org/blog/index.php?pk=63860&T=3

As an alternative you can also use a QR Code:  

The GUIDs for individual cells are displayed in the table below:

Extrapolation Forecasts of Exponential Smoothing
tForecast95% Lower Bound95% Upper Bound
6148503.759474482543039.819901516853967.6990474481
6245106.489798565139474.835990222850738.1436069073
6352347.084416231546406.579008329858287.5898241332
6447743.847868085441725.434118879253762.2616172915
6539119.603426089633150.810696055145088.396156124
6643795.682091894337480.927190181450110.4369936071
6730688.798567068724697.668038167536679.92909597
6829600.455275402423472.966538069135727.9440127356
6932030.24402297325588.568025085338471.9200208608
7035152.042699997928322.245542608041981.8398573878
7131430.763457610724709.735775116238151.7911401052
7220288.178576902417574.940520777323001.4166330275


Parameters (Session):
par1 = 12 ; par2 = Triple ; par3 = multiplicative ;
Parameters (R input):
par1 = 12 ; par2 = Triple ; par3 = multiplicative ;
R code (references can be found in the software module):
par1 <- as.numeric(par1)
if (par2 == 'Single') K <- 1
if (par2 == 'Double') K <- 2
if (par2 == 'Triple') K <- par1
nx <- length(x)
nxmK <- nx - K
x <- ts(x, frequency = par1)
if (par2 == 'Single') fit <- HoltWinters(x, gamma=0, beta=0)
if (par2 == 'Double') fit <- HoltWinters(x, gamma=0)
if (par2 == 'Triple') fit <- HoltWinters(x, seasonal=par3)
fit
myresid <- x - fit$fitted[,'xhat']
bitmap(file='test1.png')
op <- par(mfrow=c(2,1))
plot(fit,ylab='Observed (black) / Fitted (red)',main='Interpolation Fit of Exponential Smoothing')
plot(myresid,ylab='Residuals',main='Interpolation Prediction Errors')
par(op)
dev.off()
bitmap(file='test2.png')
p <- predict(fit, par1, prediction.interval=TRUE)
np <- length(p[,1])
plot(fit,p,ylab='Observed (black) / Fitted (red)',main='Extrapolation Fit of Exponential Smoothing')
dev.off()
bitmap(file='test3.png')
op <- par(mfrow = c(2,2))
acf(as.numeric(myresid),lag.max = nx/2,main='Residual ACF')
spectrum(myresid,main='Residals Periodogram')
cpgram(myresid,main='Residal Cumulative Periodogram')
qqnorm(myresid,main='Residual Normal QQ Plot')
qqline(myresid)
par(op)
dev.off()
load(file='createtable')
a<-table.start()
a<-table.row.start(a)
a<-table.element(a,'Estimated Parameters of Exponential Smoothing',2,TRUE)
a<-table.row.end(a)
a<-table.row.start(a)
a<-table.element(a,'Parameter',header=TRUE)
a<-table.element(a,'Value',header=TRUE)
a<-table.row.end(a)
a<-table.row.start(a)
a<-table.element(a,'alpha',header=TRUE)
a<-table.element(a,fit$alpha)
a<-table.row.end(a)
a<-table.row.start(a)
a<-table.element(a,'beta',header=TRUE)
a<-table.element(a,fit$beta)
a<-table.row.end(a)
a<-table.row.start(a)
a<-table.element(a,'gamma',header=TRUE)
a<-table.element(a,fit$gamma)
a<-table.row.end(a)
a<-table.end(a)
table.save(a,file='mytable.tab')
a<-table.start()
a<-table.row.start(a)
a<-table.element(a,'Interpolation Forecasts of Exponential Smoothing',4,TRUE)
a<-table.row.end(a)
a<-table.row.start(a)
a<-table.element(a,'t',header=TRUE)
a<-table.element(a,'Observed',header=TRUE)
a<-table.element(a,'Fitted',header=TRUE)
a<-table.element(a,'Residuals',header=TRUE)
a<-table.row.end(a)
for (i in 1:nxmK) {
a<-table.row.start(a)
a<-table.element(a,i+K,header=TRUE)
a<-table.element(a,x[i+K])
a<-table.element(a,fit$fitted[i,'xhat'])
a<-table.element(a,myresid[i])
a<-table.row.end(a)
}
a<-table.end(a)
table.save(a,file='mytable1.tab')
a<-table.start()
a<-table.row.start(a)
a<-table.element(a,'Extrapolation Forecasts of Exponential Smoothing',4,TRUE)
a<-table.row.end(a)
a<-table.row.start(a)
a<-table.element(a,'t',header=TRUE)
a<-table.element(a,'Forecast',header=TRUE)
a<-table.element(a,'95% Lower Bound',header=TRUE)
a<-table.element(a,'95% Upper Bound',header=TRUE)
a<-table.row.end(a)
for (i in 1:np) {
a<-table.row.start(a)
a<-table.element(a,nx+i,header=TRUE)
a<-table.element(a,p[i,'fit'])
a<-table.element(a,p[i,'lwr'])
a<-table.element(a,p[i,'upr'])
a<-table.row.end(a)
}
a<-table.end(a)
table.save(a,file='mytable2.tab')