Free Statistics

of Irreproducible Research!

Author's title

Author*The author of this computation has been verified*
R Software Modulerwasp_arimabackwardselection.wasp
Title produced by softwareARIMA Backward Selection
Date of computationFri, 04 Dec 2009 09:29:13 -0700
Cite this page as followsStatistical Computations at FreeStatistics.org, Office for Research Development and Education, URL https://freestatistics.org/blog/index.php?v=date/2009/Dec/04/t125994419938ultn2irez5u04.htm/, Retrieved Sun, 28 Apr 2024 15:01:56 +0000
Statistical Computations at FreeStatistics.org, Office for Research Development and Education, URL https://freestatistics.org/blog/index.php?pk=63863, Retrieved Sun, 28 Apr 2024 15:01:56 +0000
QR Codes:

Original text written by user:
IsPrivate?No (this computation is public)
User-defined keywords
Estimated Impact126
Family? (F = Feedback message, R = changed R code, M = changed R Module, P = changed Parameters, D = changed Data)
-     [Univariate Data Series] [data set] [2008-12-01 19:54:57] [b98453cac15ba1066b407e146608df68]
- RMP   [ARIMA Backward Selection] [] [2009-11-27 14:53:14] [b98453cac15ba1066b407e146608df68]
-   PD      [ARIMA Backward Selection] [Workshop 9: ARIMA...] [2009-12-04 16:29:13] [3d2053c5f7c50d3c075d87ce0bd87294] [Current]
Feedback Forum

Post a new message
Dataseries X:
267413
267366
264777
258863
254844
254868
277267
285351
286602
283042
276687
277915
277128
277103
275037
270150
267140
264993
287259
291186
292300
288186
281477
282656
280190
280408
276836
275216
274352
271311
289802
290726
292300
278506
269826
265861
269034
264176
255198
253353
246057
235372
258556
260993
254663
250643
243422
247105
248541
245039
237080
237085
225554
226839
247934
248333
246969
245098
246263
255765
264319
268347
273046
273963
267430
271993
292710
295881
293299


Summary of computational transaction
Raw Inputview raw input (R code)
Raw Outputview raw output of R engine
Computing time8 seconds
R Server'Gwilym Jenkins' @ 72.249.127.135

\begin{tabular}{lllllllll}
\hline
Summary of computational transaction \tabularnewline
Raw Input & view raw input (R code)  \tabularnewline
Raw Output & view raw output of R engine  \tabularnewline
Computing time & 8 seconds \tabularnewline
R Server & 'Gwilym Jenkins' @ 72.249.127.135 \tabularnewline
\hline
\end{tabular}
%Source: https://freestatistics.org/blog/index.php?pk=63863&T=0

[TABLE]
[ROW][C]Summary of computational transaction[/C][/ROW]
[ROW][C]Raw Input[/C][C]view raw input (R code) [/C][/ROW]
[ROW][C]Raw Output[/C][C]view raw output of R engine [/C][/ROW]
[ROW][C]Computing time[/C][C]8 seconds[/C][/ROW]
[ROW][C]R Server[/C][C]'Gwilym Jenkins' @ 72.249.127.135[/C][/ROW]
[/TABLE]
Source: https://freestatistics.org/blog/index.php?pk=63863&T=0

Globally Unique Identifier (entire table): ba.freestatistics.org/blog/index.php?pk=63863&T=0

As an alternative you can also use a QR Code:  

The GUIDs for individual cells are displayed in the table below:

Summary of computational transaction
Raw Inputview raw input (R code)
Raw Outputview raw output of R engine
Computing time8 seconds
R Server'Gwilym Jenkins' @ 72.249.127.135


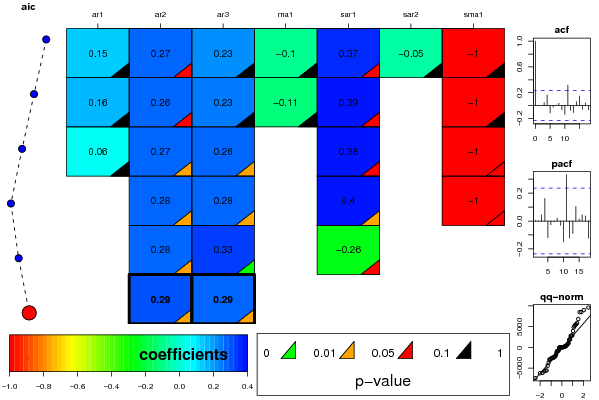
ARIMA Parameter Estimation and Backward Selection
Iterationar1ar2ar3ma1sar1sar2sma1
Estimates ( 1 )0.14580.26540.2304-0.09790.3657-0.0484-0.9996
(p-val)(0.6839 )(0.0513 )(0.1802 )(0.7845 )(0.095 )(0.817 )(0.2646 )
Estimates ( 2 )0.16050.2610.2338-0.11080.38810-0.9993
(p-val)(0.643 )(0.0536 )(0.1691 )(0.7494 )(0.0526 )(NA )(0.1086 )
Estimates ( 3 )0.05940.27480.264100.37990-1
(p-val)(0.648 )(0.0288 )(0.0416 )(NA )(0.0537 )(NA )(0.0784 )
Estimates ( 4 )00.28490.282300.39720-0.9999
(p-val)(NA )(0.0214 )(0.0221 )(NA )(0.0432 )(NA )(0.0837 )
Estimates ( 5 )00.27880.32550-0.259700
(p-val)(NA )(0.0213 )(0.0079 )(NA )(0.0516 )(NA )(NA )
Estimates ( 6 )00.29180.28590000
(p-val)(NA )(0.0158 )(0.0171 )(NA )(NA )(NA )(NA )
Estimates ( 7 )NANANANANANANA
(p-val)(NA )(NA )(NA )(NA )(NA )(NA )(NA )
Estimates ( 8 )NANANANANANANA
(p-val)(NA )(NA )(NA )(NA )(NA )(NA )(NA )
Estimates ( 9 )NANANANANANANA
(p-val)(NA )(NA )(NA )(NA )(NA )(NA )(NA )
Estimates ( 10 )NANANANANANANA
(p-val)(NA )(NA )(NA )(NA )(NA )(NA )(NA )
Estimates ( 11 )NANANANANANANA
(p-val)(NA )(NA )(NA )(NA )(NA )(NA )(NA )
Estimates ( 12 )NANANANANANANA
(p-val)(NA )(NA )(NA )(NA )(NA )(NA )(NA )
Estimates ( 13 )NANANANANANANA
(p-val)(NA )(NA )(NA )(NA )(NA )(NA )(NA )

\begin{tabular}{lllllllll}
\hline
ARIMA Parameter Estimation and Backward Selection \tabularnewline
Iteration & ar1 & ar2 & ar3 & ma1 & sar1 & sar2 & sma1 \tabularnewline
Estimates ( 1 ) & 0.1458 & 0.2654 & 0.2304 & -0.0979 & 0.3657 & -0.0484 & -0.9996 \tabularnewline
(p-val) & (0.6839 ) & (0.0513 ) & (0.1802 ) & (0.7845 ) & (0.095 ) & (0.817 ) & (0.2646 ) \tabularnewline
Estimates ( 2 ) & 0.1605 & 0.261 & 0.2338 & -0.1108 & 0.3881 & 0 & -0.9993 \tabularnewline
(p-val) & (0.643 ) & (0.0536 ) & (0.1691 ) & (0.7494 ) & (0.0526 ) & (NA ) & (0.1086 ) \tabularnewline
Estimates ( 3 ) & 0.0594 & 0.2748 & 0.2641 & 0 & 0.3799 & 0 & -1 \tabularnewline
(p-val) & (0.648 ) & (0.0288 ) & (0.0416 ) & (NA ) & (0.0537 ) & (NA ) & (0.0784 ) \tabularnewline
Estimates ( 4 ) & 0 & 0.2849 & 0.2823 & 0 & 0.3972 & 0 & -0.9999 \tabularnewline
(p-val) & (NA ) & (0.0214 ) & (0.0221 ) & (NA ) & (0.0432 ) & (NA ) & (0.0837 ) \tabularnewline
Estimates ( 5 ) & 0 & 0.2788 & 0.3255 & 0 & -0.2597 & 0 & 0 \tabularnewline
(p-val) & (NA ) & (0.0213 ) & (0.0079 ) & (NA ) & (0.0516 ) & (NA ) & (NA ) \tabularnewline
Estimates ( 6 ) & 0 & 0.2918 & 0.2859 & 0 & 0 & 0 & 0 \tabularnewline
(p-val) & (NA ) & (0.0158 ) & (0.0171 ) & (NA ) & (NA ) & (NA ) & (NA ) \tabularnewline
Estimates ( 7 ) & NA & NA & NA & NA & NA & NA & NA \tabularnewline
(p-val) & (NA ) & (NA ) & (NA ) & (NA ) & (NA ) & (NA ) & (NA ) \tabularnewline
Estimates ( 8 ) & NA & NA & NA & NA & NA & NA & NA \tabularnewline
(p-val) & (NA ) & (NA ) & (NA ) & (NA ) & (NA ) & (NA ) & (NA ) \tabularnewline
Estimates ( 9 ) & NA & NA & NA & NA & NA & NA & NA \tabularnewline
(p-val) & (NA ) & (NA ) & (NA ) & (NA ) & (NA ) & (NA ) & (NA ) \tabularnewline
Estimates ( 10 ) & NA & NA & NA & NA & NA & NA & NA \tabularnewline
(p-val) & (NA ) & (NA ) & (NA ) & (NA ) & (NA ) & (NA ) & (NA ) \tabularnewline
Estimates ( 11 ) & NA & NA & NA & NA & NA & NA & NA \tabularnewline
(p-val) & (NA ) & (NA ) & (NA ) & (NA ) & (NA ) & (NA ) & (NA ) \tabularnewline
Estimates ( 12 ) & NA & NA & NA & NA & NA & NA & NA \tabularnewline
(p-val) & (NA ) & (NA ) & (NA ) & (NA ) & (NA ) & (NA ) & (NA ) \tabularnewline
Estimates ( 13 ) & NA & NA & NA & NA & NA & NA & NA \tabularnewline
(p-val) & (NA ) & (NA ) & (NA ) & (NA ) & (NA ) & (NA ) & (NA ) \tabularnewline
\hline
\end{tabular}
%Source: https://freestatistics.org/blog/index.php?pk=63863&T=1

[TABLE]
[ROW][C]ARIMA Parameter Estimation and Backward Selection[/C][/ROW]
[ROW][C]Iteration[/C][C]ar1[/C][C]ar2[/C][C]ar3[/C][C]ma1[/C][C]sar1[/C][C]sar2[/C][C]sma1[/C][/ROW]
[ROW][C]Estimates ( 1 )[/C][C]0.1458[/C][C]0.2654[/C][C]0.2304[/C][C]-0.0979[/C][C]0.3657[/C][C]-0.0484[/C][C]-0.9996[/C][/ROW]
[ROW][C](p-val)[/C][C](0.6839 )[/C][C](0.0513 )[/C][C](0.1802 )[/C][C](0.7845 )[/C][C](0.095 )[/C][C](0.817 )[/C][C](0.2646 )[/C][/ROW]
[ROW][C]Estimates ( 2 )[/C][C]0.1605[/C][C]0.261[/C][C]0.2338[/C][C]-0.1108[/C][C]0.3881[/C][C]0[/C][C]-0.9993[/C][/ROW]
[ROW][C](p-val)[/C][C](0.643 )[/C][C](0.0536 )[/C][C](0.1691 )[/C][C](0.7494 )[/C][C](0.0526 )[/C][C](NA )[/C][C](0.1086 )[/C][/ROW]
[ROW][C]Estimates ( 3 )[/C][C]0.0594[/C][C]0.2748[/C][C]0.2641[/C][C]0[/C][C]0.3799[/C][C]0[/C][C]-1[/C][/ROW]
[ROW][C](p-val)[/C][C](0.648 )[/C][C](0.0288 )[/C][C](0.0416 )[/C][C](NA )[/C][C](0.0537 )[/C][C](NA )[/C][C](0.0784 )[/C][/ROW]
[ROW][C]Estimates ( 4 )[/C][C]0[/C][C]0.2849[/C][C]0.2823[/C][C]0[/C][C]0.3972[/C][C]0[/C][C]-0.9999[/C][/ROW]
[ROW][C](p-val)[/C][C](NA )[/C][C](0.0214 )[/C][C](0.0221 )[/C][C](NA )[/C][C](0.0432 )[/C][C](NA )[/C][C](0.0837 )[/C][/ROW]
[ROW][C]Estimates ( 5 )[/C][C]0[/C][C]0.2788[/C][C]0.3255[/C][C]0[/C][C]-0.2597[/C][C]0[/C][C]0[/C][/ROW]
[ROW][C](p-val)[/C][C](NA )[/C][C](0.0213 )[/C][C](0.0079 )[/C][C](NA )[/C][C](0.0516 )[/C][C](NA )[/C][C](NA )[/C][/ROW]
[ROW][C]Estimates ( 6 )[/C][C]0[/C][C]0.2918[/C][C]0.2859[/C][C]0[/C][C]0[/C][C]0[/C][C]0[/C][/ROW]
[ROW][C](p-val)[/C][C](NA )[/C][C](0.0158 )[/C][C](0.0171 )[/C][C](NA )[/C][C](NA )[/C][C](NA )[/C][C](NA )[/C][/ROW]
[ROW][C]Estimates ( 7 )[/C][C]NA[/C][C]NA[/C][C]NA[/C][C]NA[/C][C]NA[/C][C]NA[/C][C]NA[/C][/ROW]
[ROW][C](p-val)[/C][C](NA )[/C][C](NA )[/C][C](NA )[/C][C](NA )[/C][C](NA )[/C][C](NA )[/C][C](NA )[/C][/ROW]
[ROW][C]Estimates ( 8 )[/C][C]NA[/C][C]NA[/C][C]NA[/C][C]NA[/C][C]NA[/C][C]NA[/C][C]NA[/C][/ROW]
[ROW][C](p-val)[/C][C](NA )[/C][C](NA )[/C][C](NA )[/C][C](NA )[/C][C](NA )[/C][C](NA )[/C][C](NA )[/C][/ROW]
[ROW][C]Estimates ( 9 )[/C][C]NA[/C][C]NA[/C][C]NA[/C][C]NA[/C][C]NA[/C][C]NA[/C][C]NA[/C][/ROW]
[ROW][C](p-val)[/C][C](NA )[/C][C](NA )[/C][C](NA )[/C][C](NA )[/C][C](NA )[/C][C](NA )[/C][C](NA )[/C][/ROW]
[ROW][C]Estimates ( 10 )[/C][C]NA[/C][C]NA[/C][C]NA[/C][C]NA[/C][C]NA[/C][C]NA[/C][C]NA[/C][/ROW]
[ROW][C](p-val)[/C][C](NA )[/C][C](NA )[/C][C](NA )[/C][C](NA )[/C][C](NA )[/C][C](NA )[/C][C](NA )[/C][/ROW]
[ROW][C]Estimates ( 11 )[/C][C]NA[/C][C]NA[/C][C]NA[/C][C]NA[/C][C]NA[/C][C]NA[/C][C]NA[/C][/ROW]
[ROW][C](p-val)[/C][C](NA )[/C][C](NA )[/C][C](NA )[/C][C](NA )[/C][C](NA )[/C][C](NA )[/C][C](NA )[/C][/ROW]
[ROW][C]Estimates ( 12 )[/C][C]NA[/C][C]NA[/C][C]NA[/C][C]NA[/C][C]NA[/C][C]NA[/C][C]NA[/C][/ROW]
[ROW][C](p-val)[/C][C](NA )[/C][C](NA )[/C][C](NA )[/C][C](NA )[/C][C](NA )[/C][C](NA )[/C][C](NA )[/C][/ROW]
[ROW][C]Estimates ( 13 )[/C][C]NA[/C][C]NA[/C][C]NA[/C][C]NA[/C][C]NA[/C][C]NA[/C][C]NA[/C][/ROW]
[ROW][C](p-val)[/C][C](NA )[/C][C](NA )[/C][C](NA )[/C][C](NA )[/C][C](NA )[/C][C](NA )[/C][C](NA )[/C][/ROW]
[/TABLE]
Source: https://freestatistics.org/blog/index.php?pk=63863&T=1

Globally Unique Identifier (entire table): ba.freestatistics.org/blog/index.php?pk=63863&T=1

As an alternative you can also use a QR Code:  

The GUIDs for individual cells are displayed in the table below:

ARIMA Parameter Estimation and Backward Selection
Iterationar1ar2ar3ma1sar1sar2sma1
Estimates ( 1 )0.14580.26540.2304-0.09790.3657-0.0484-0.9996
(p-val)(0.6839 )(0.0513 )(0.1802 )(0.7845 )(0.095 )(0.817 )(0.2646 )
Estimates ( 2 )0.16050.2610.2338-0.11080.38810-0.9993
(p-val)(0.643 )(0.0536 )(0.1691 )(0.7494 )(0.0526 )(NA )(0.1086 )
Estimates ( 3 )0.05940.27480.264100.37990-1
(p-val)(0.648 )(0.0288 )(0.0416 )(NA )(0.0537 )(NA )(0.0784 )
Estimates ( 4 )00.28490.282300.39720-0.9999
(p-val)(NA )(0.0214 )(0.0221 )(NA )(0.0432 )(NA )(0.0837 )
Estimates ( 5 )00.27880.32550-0.259700
(p-val)(NA )(0.0213 )(0.0079 )(NA )(0.0516 )(NA )(NA )
Estimates ( 6 )00.29180.28590000
(p-val)(NA )(0.0158 )(0.0171 )(NA )(NA )(NA )(NA )
Estimates ( 7 )NANANANANANANA
(p-val)(NA )(NA )(NA )(NA )(NA )(NA )(NA )
Estimates ( 8 )NANANANANANANA
(p-val)(NA )(NA )(NA )(NA )(NA )(NA )(NA )
Estimates ( 9 )NANANANANANANA
(p-val)(NA )(NA )(NA )(NA )(NA )(NA )(NA )
Estimates ( 10 )NANANANANANANA
(p-val)(NA )(NA )(NA )(NA )(NA )(NA )(NA )
Estimates ( 11 )NANANANANANANA
(p-val)(NA )(NA )(NA )(NA )(NA )(NA )(NA )
Estimates ( 12 )NANANANANANANA
(p-val)(NA )(NA )(NA )(NA )(NA )(NA )(NA )
Estimates ( 13 )NANANANANANANA
(p-val)(NA )(NA )(NA )(NA )(NA )(NA )(NA )


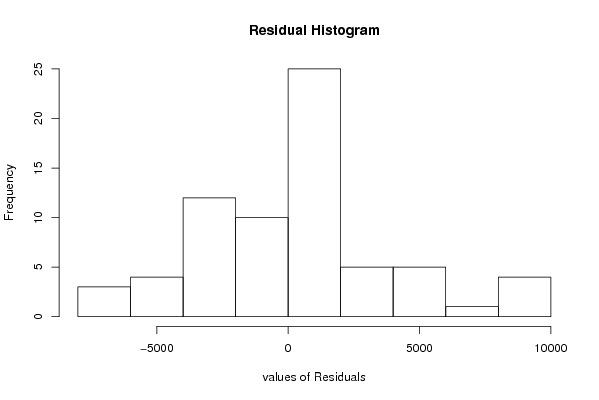
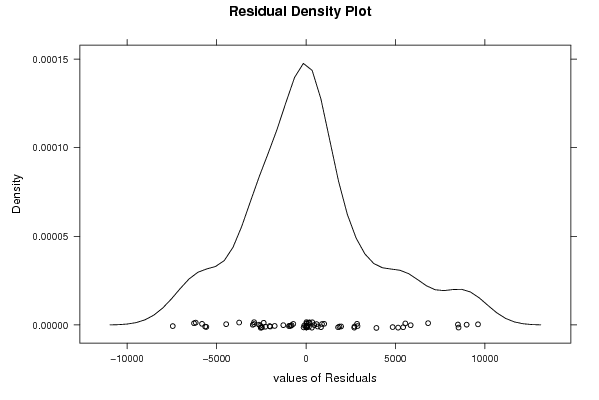
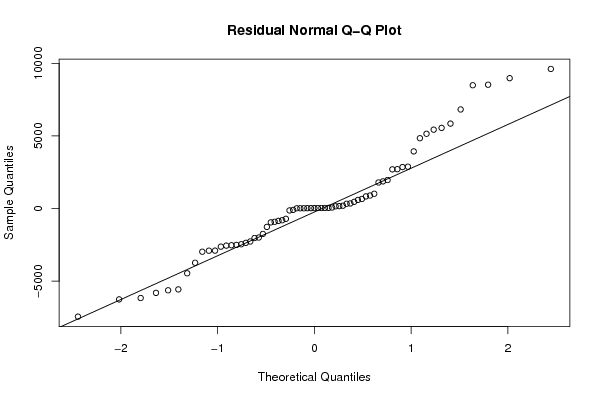
Estimated ARIMA Residuals
Value
-913.740926996227
23.0418667002614
458.437698291686
894.2385850766
836.040750491515
-2529.33707821336
-709.250675964114
-3734.91996277199
590.496330659738
656.886459109069
1015.09288744419
163.661670494401
-1266.87138313661
350.099934431325
-952.12955814736
3933.94753878156
2709.08333486605
-1997.03652476531
-5631.01924217591
-4460.10867854955
1960.92087006318
-7445.81161878078
-852.402053991336
-2556.26267179943
8975.49066563848
-2903.89042805394
-5569.15351571484
327.557960365169
-2626.91756931821
-6163.16287020995
5147.18091949687
4840.72832864674
-6255.87924731605
5847.03173383536
2878.56184570765
6821.83396199829
-2899.24815972638
-2030.25451895065
-2363.64967694611
1869.72548165571
-5810.50281753111
9610.47719446676
193.153380555101
-2506.21838428764
-94.238829461654
5429.46027006585
8488.32295876939
5550.56645888966
2697.66299801980
2853.43156187079
8523.61345763667
-2974.73912487039
-2269.96912891019
1792.78893268996
-2460.48180701826
-806.607267956133
-1750.38242494356

\begin{tabular}{lllllllll}
\hline
Estimated ARIMA Residuals \tabularnewline
Value \tabularnewline
-913.740926996227 \tabularnewline
23.0418667002614 \tabularnewline
458.437698291686 \tabularnewline
894.2385850766 \tabularnewline
836.040750491515 \tabularnewline
-2529.33707821336 \tabularnewline
-709.250675964114 \tabularnewline
-3734.91996277199 \tabularnewline
590.496330659738 \tabularnewline
656.886459109069 \tabularnewline
1015.09288744419 \tabularnewline
163.661670494401 \tabularnewline
-1266.87138313661 \tabularnewline
350.099934431325 \tabularnewline
-952.12955814736 \tabularnewline
3933.94753878156 \tabularnewline
2709.08333486605 \tabularnewline
-1997.03652476531 \tabularnewline
-5631.01924217591 \tabularnewline
-4460.10867854955 \tabularnewline
1960.92087006318 \tabularnewline
-7445.81161878078 \tabularnewline
-852.402053991336 \tabularnewline
-2556.26267179943 \tabularnewline
8975.49066563848 \tabularnewline
-2903.89042805394 \tabularnewline
-5569.15351571484 \tabularnewline
327.557960365169 \tabularnewline
-2626.91756931821 \tabularnewline
-6163.16287020995 \tabularnewline
5147.18091949687 \tabularnewline
4840.72832864674 \tabularnewline
-6255.87924731605 \tabularnewline
5847.03173383536 \tabularnewline
2878.56184570765 \tabularnewline
6821.83396199829 \tabularnewline
-2899.24815972638 \tabularnewline
-2030.25451895065 \tabularnewline
-2363.64967694611 \tabularnewline
1869.72548165571 \tabularnewline
-5810.50281753111 \tabularnewline
9610.47719446676 \tabularnewline
193.153380555101 \tabularnewline
-2506.21838428764 \tabularnewline
-94.238829461654 \tabularnewline
5429.46027006585 \tabularnewline
8488.32295876939 \tabularnewline
5550.56645888966 \tabularnewline
2697.66299801980 \tabularnewline
2853.43156187079 \tabularnewline
8523.61345763667 \tabularnewline
-2974.73912487039 \tabularnewline
-2269.96912891019 \tabularnewline
1792.78893268996 \tabularnewline
-2460.48180701826 \tabularnewline
-806.607267956133 \tabularnewline
-1750.38242494356 \tabularnewline
\hline
\end{tabular}
%Source: https://freestatistics.org/blog/index.php?pk=63863&T=2

[TABLE]
[ROW][C]Estimated ARIMA Residuals[/C][/ROW]
[ROW][C]Value[/C][/ROW]
[ROW][C]-913.740926996227[/C][/ROW]
[ROW][C]23.0418667002614[/C][/ROW]
[ROW][C]458.437698291686[/C][/ROW]
[ROW][C]894.2385850766[/C][/ROW]
[ROW][C]836.040750491515[/C][/ROW]
[ROW][C]-2529.33707821336[/C][/ROW]
[ROW][C]-709.250675964114[/C][/ROW]
[ROW][C]-3734.91996277199[/C][/ROW]
[ROW][C]590.496330659738[/C][/ROW]
[ROW][C]656.886459109069[/C][/ROW]
[ROW][C]1015.09288744419[/C][/ROW]
[ROW][C]163.661670494401[/C][/ROW]
[ROW][C]-1266.87138313661[/C][/ROW]
[ROW][C]350.099934431325[/C][/ROW]
[ROW][C]-952.12955814736[/C][/ROW]
[ROW][C]3933.94753878156[/C][/ROW]
[ROW][C]2709.08333486605[/C][/ROW]
[ROW][C]-1997.03652476531[/C][/ROW]
[ROW][C]-5631.01924217591[/C][/ROW]
[ROW][C]-4460.10867854955[/C][/ROW]
[ROW][C]1960.92087006318[/C][/ROW]
[ROW][C]-7445.81161878078[/C][/ROW]
[ROW][C]-852.402053991336[/C][/ROW]
[ROW][C]-2556.26267179943[/C][/ROW]
[ROW][C]8975.49066563848[/C][/ROW]
[ROW][C]-2903.89042805394[/C][/ROW]
[ROW][C]-5569.15351571484[/C][/ROW]
[ROW][C]327.557960365169[/C][/ROW]
[ROW][C]-2626.91756931821[/C][/ROW]
[ROW][C]-6163.16287020995[/C][/ROW]
[ROW][C]5147.18091949687[/C][/ROW]
[ROW][C]4840.72832864674[/C][/ROW]
[ROW][C]-6255.87924731605[/C][/ROW]
[ROW][C]5847.03173383536[/C][/ROW]
[ROW][C]2878.56184570765[/C][/ROW]
[ROW][C]6821.83396199829[/C][/ROW]
[ROW][C]-2899.24815972638[/C][/ROW]
[ROW][C]-2030.25451895065[/C][/ROW]
[ROW][C]-2363.64967694611[/C][/ROW]
[ROW][C]1869.72548165571[/C][/ROW]
[ROW][C]-5810.50281753111[/C][/ROW]
[ROW][C]9610.47719446676[/C][/ROW]
[ROW][C]193.153380555101[/C][/ROW]
[ROW][C]-2506.21838428764[/C][/ROW]
[ROW][C]-94.238829461654[/C][/ROW]
[ROW][C]5429.46027006585[/C][/ROW]
[ROW][C]8488.32295876939[/C][/ROW]
[ROW][C]5550.56645888966[/C][/ROW]
[ROW][C]2697.66299801980[/C][/ROW]
[ROW][C]2853.43156187079[/C][/ROW]
[ROW][C]8523.61345763667[/C][/ROW]
[ROW][C]-2974.73912487039[/C][/ROW]
[ROW][C]-2269.96912891019[/C][/ROW]
[ROW][C]1792.78893268996[/C][/ROW]
[ROW][C]-2460.48180701826[/C][/ROW]
[ROW][C]-806.607267956133[/C][/ROW]
[ROW][C]-1750.38242494356[/C][/ROW]
[/TABLE]
Source: https://freestatistics.org/blog/index.php?pk=63863&T=2

Globally Unique Identifier (entire table): ba.freestatistics.org/blog/index.php?pk=63863&T=2

As an alternative you can also use a QR Code:  

The GUIDs for individual cells are displayed in the table below:

Estimated ARIMA Residuals
Value
-913.740926996227
23.0418667002614
458.437698291686
894.2385850766
836.040750491515
-2529.33707821336
-709.250675964114
-3734.91996277199
590.496330659738
656.886459109069
1015.09288744419
163.661670494401
-1266.87138313661
350.099934431325
-952.12955814736
3933.94753878156
2709.08333486605
-1997.03652476531
-5631.01924217591
-4460.10867854955
1960.92087006318
-7445.81161878078
-852.402053991336
-2556.26267179943
8975.49066563848
-2903.89042805394
-5569.15351571484
327.557960365169
-2626.91756931821
-6163.16287020995
5147.18091949687
4840.72832864674
-6255.87924731605
5847.03173383536
2878.56184570765
6821.83396199829
-2899.24815972638
-2030.25451895065
-2363.64967694611
1869.72548165571
-5810.50281753111
9610.47719446676
193.153380555101
-2506.21838428764
-94.238829461654
5429.46027006585
8488.32295876939
5550.56645888966
2697.66299801980
2853.43156187079
8523.61345763667
-2974.73912487039
-2269.96912891019
1792.78893268996
-2460.48180701826
-806.607267956133
-1750.38242494356


Parameters (Session):
par1 = FALSE ; par2 = 1 ; par3 = 1 ; par4 = 1 ; par5 = 12 ; par6 = 3 ; par7 = 1 ; par8 = 2 ; par9 = 1 ;
Parameters (R input):
par1 = FALSE ; par2 = 1 ; par3 = 1 ; par4 = 1 ; par5 = 12 ; par6 = 3 ; par7 = 1 ; par8 = 2 ; par9 = 1 ;
R code (references can be found in the software module):
library(lattice)
if (par1 == 'TRUE') par1 <- TRUE
if (par1 == 'FALSE') par1 <- FALSE
par2 <- as.numeric(par2) #Box-Cox lambda transformation parameter
par3 <- as.numeric(par3) #degree of non-seasonal differencing
par4 <- as.numeric(par4) #degree of seasonal differencing
par5 <- as.numeric(par5) #seasonal period
par6 <- as.numeric(par6) #degree (p) of the non-seasonal AR(p) polynomial
par7 <- as.numeric(par7) #degree (q) of the non-seasonal MA(q) polynomial
par8 <- as.numeric(par8) #degree (P) of the seasonal AR(P) polynomial
par9 <- as.numeric(par9) #degree (Q) of the seasonal MA(Q) polynomial
armaGR <- function(arima.out, names, n){
try1 <- arima.out$coef
try2 <- sqrt(diag(arima.out$var.coef))
try.data.frame <- data.frame(matrix(NA,ncol=4,nrow=length(names)))
dimnames(try.data.frame) <- list(names,c('coef','std','tstat','pv'))
try.data.frame[,1] <- try1
for(i in 1:length(try2)) try.data.frame[which(rownames(try.data.frame)==names(try2)[i]),2] <- try2[i]
try.data.frame[,3] <- try.data.frame[,1] / try.data.frame[,2]
try.data.frame[,4] <- round((1-pt(abs(try.data.frame[,3]),df=n-(length(try2)+1)))*2,5)
vector <- rep(NA,length(names))
vector[is.na(try.data.frame[,4])] <- 0
maxi <- which.max(try.data.frame[,4])
continue <- max(try.data.frame[,4],na.rm=TRUE) > .05
vector[maxi] <- 0
list(summary=try.data.frame,next.vector=vector,continue=continue)
}
arimaSelect <- function(series, order=c(13,0,0), seasonal=list(order=c(2,0,0),period=12), include.mean=F){
nrc <- order[1]+order[3]+seasonal$order[1]+seasonal$order[3]
coeff <- matrix(NA, nrow=nrc*2, ncol=nrc)
pval <- matrix(NA, nrow=nrc*2, ncol=nrc)
mylist <- rep(list(NULL), nrc)
names <- NULL
if(order[1] > 0) names <- paste('ar',1:order[1],sep='')
if(order[3] > 0) names <- c( names , paste('ma',1:order[3],sep='') )
if(seasonal$order[1] > 0) names <- c(names, paste('sar',1:seasonal$order[1],sep=''))
if(seasonal$order[3] > 0) names <- c(names, paste('sma',1:seasonal$order[3],sep=''))
arima.out <- arima(series, order=order, seasonal=seasonal, include.mean=include.mean, method='ML')
mylist[[1]] <- arima.out
last.arma <- armaGR(arima.out, names, length(series))
mystop <- FALSE
i <- 1
coeff[i,] <- last.arma[[1]][,1]
pval [i,] <- last.arma[[1]][,4]
i <- 2
aic <- arima.out$aic
while(!mystop){
mylist[[i]] <- arima.out
arima.out <- arima(series, order=order, seasonal=seasonal, include.mean=include.mean, method='ML', fixed=last.arma$next.vector)
aic <- c(aic, arima.out$aic)
last.arma <- armaGR(arima.out, names, length(series))
mystop <- !last.arma$continue
coeff[i,] <- last.arma[[1]][,1]
pval [i,] <- last.arma[[1]][,4]
i <- i+1
}
list(coeff, pval, mylist, aic=aic)
}
arimaSelectplot <- function(arimaSelect.out,noms,choix){
noms <- names(arimaSelect.out[[3]][[1]]$coef)
coeff <- arimaSelect.out[[1]]
k <- min(which(is.na(coeff[,1])))-1
coeff <- coeff[1:k,]
pval <- arimaSelect.out[[2]][1:k,]
aic <- arimaSelect.out$aic[1:k]
coeff[coeff==0] <- NA
n <- ncol(coeff)
if(missing(choix)) choix <- k
layout(matrix(c(1,1,1,2,
3,3,3,2,
3,3,3,4,
5,6,7,7),nr=4),
widths=c(10,35,45,15),
heights=c(30,30,15,15))
couleurs <- rainbow(75)[1:50]#(50)
ticks <- pretty(coeff)
par(mar=c(1,1,3,1))
plot(aic,k:1-.5,type='o',pch=21,bg='blue',cex=2,axes=F,lty=2,xpd=NA)
points(aic[choix],k-choix+.5,pch=21,cex=4,bg=2,xpd=NA)
title('aic',line=2)
par(mar=c(3,0,0,0))
plot(0,axes=F,xlab='',ylab='',xlim=range(ticks),ylim=c(.1,1))
rect(xleft = min(ticks) + (0:49)/50*(max(ticks)-min(ticks)),
xright = min(ticks) + (1:50)/50*(max(ticks)-min(ticks)),
ytop = rep(1,50),
ybottom= rep(0,50),col=couleurs,border=NA)
axis(1,ticks)
rect(xleft=min(ticks),xright=max(ticks),ytop=1,ybottom=0)
text(mean(coeff,na.rm=T),.5,'coefficients',cex=2,font=2)
par(mar=c(1,1,3,1))
image(1:n,1:k,t(coeff[k:1,]),axes=F,col=couleurs,zlim=range(ticks))
for(i in 1:n) for(j in 1:k) if(!is.na(coeff[j,i])) {
if(pval[j,i]<.01) symb = 'green'
else if( (pval[j,i]<.05) & (pval[j,i]>=.01)) symb = 'orange'
else if( (pval[j,i]<.1) & (pval[j,i]>=.05)) symb = 'red'
else symb = 'black'
polygon(c(i+.5 ,i+.2 ,i+.5 ,i+.5),
c(k-j+0.5,k-j+0.5,k-j+0.8,k-j+0.5),
col=symb)
if(j==choix) {
rect(xleft=i-.5,
xright=i+.5,
ybottom=k-j+1.5,
ytop=k-j+.5,
lwd=4)
text(i,
k-j+1,
round(coeff[j,i],2),
cex=1.2,
font=2)
}
else{
rect(xleft=i-.5,xright=i+.5,ybottom=k-j+1.5,ytop=k-j+.5)
text(i,k-j+1,round(coeff[j,i],2),cex=1.2,font=1)
}
}
axis(3,1:n,noms)
par(mar=c(0.5,0,0,0.5))
plot(0,axes=F,xlab='',ylab='',type='n',xlim=c(0,8),ylim=c(-.2,.8))
cols <- c('green','orange','red','black')
niv <- c('0','0.01','0.05','0.1')
for(i in 0:3){
polygon(c(1+2*i ,1+2*i ,1+2*i-.5 ,1+2*i),
c(.4 ,.7 , .4 , .4),
col=cols[i+1])
text(2*i,0.5,niv[i+1],cex=1.5)
}
text(8,.5,1,cex=1.5)
text(4,0,'p-value',cex=2)
box()
residus <- arimaSelect.out[[3]][[choix]]$res
par(mar=c(1,2,4,1))
acf(residus,main='')
title('acf',line=.5)
par(mar=c(1,2,4,1))
pacf(residus,main='')
title('pacf',line=.5)
par(mar=c(2,2,4,1))
qqnorm(residus,main='')
title('qq-norm',line=.5)
qqline(residus)
residus
}
if (par2 == 0) x <- log(x)
if (par2 != 0) x <- x^par2
(selection <- arimaSelect(x, order=c(par6,par3,par7), seasonal=list(order=c(par8,par4,par9), period=par5)))
bitmap(file='test1.png')
resid <- arimaSelectplot(selection)
dev.off()
resid
bitmap(file='test2.png')
acf(resid,length(resid)/2, main='Residual Autocorrelation Function')
dev.off()
bitmap(file='test3.png')
pacf(resid,length(resid)/2, main='Residual Partial Autocorrelation Function')
dev.off()
bitmap(file='test4.png')
cpgram(resid, main='Residual Cumulative Periodogram')
dev.off()
bitmap(file='test5.png')
hist(resid, main='Residual Histogram', xlab='values of Residuals')
dev.off()
bitmap(file='test6.png')
densityplot(~resid,col='black',main='Residual Density Plot', xlab='values of Residuals')
dev.off()
bitmap(file='test7.png')
qqnorm(resid, main='Residual Normal Q-Q Plot')
qqline(resid)
dev.off()
ncols <- length(selection[[1]][1,])
nrows <- length(selection[[2]][,1])-1
load(file='createtable')
a<-table.start()
a<-table.row.start(a)
a<-table.element(a,'ARIMA Parameter Estimation and Backward Selection', ncols+1,TRUE)
a<-table.row.end(a)
a<-table.row.start(a)
a<-table.element(a,'Iteration', header=TRUE)
for (i in 1:ncols) {
a<-table.element(a,names(selection[[3]][[1]]$coef)[i],header=TRUE)
}
a<-table.row.end(a)
for (j in 1:nrows) {
a<-table.row.start(a)
mydum <- 'Estimates ('
mydum <- paste(mydum,j)
mydum <- paste(mydum,')')
a<-table.element(a,mydum, header=TRUE)
for (i in 1:ncols) {
a<-table.element(a,round(selection[[1]][j,i],4))
}
a<-table.row.end(a)
a<-table.row.start(a)
a<-table.element(a,'(p-val)', header=TRUE)
for (i in 1:ncols) {
mydum <- '('
mydum <- paste(mydum,round(selection[[2]][j,i],4),sep='')
mydum <- paste(mydum,')')
a<-table.element(a,mydum)
}
a<-table.row.end(a)
}
a<-table.end(a)
table.save(a,file='mytable.tab')
a<-table.start()
a<-table.row.start(a)
a<-table.element(a,'Estimated ARIMA Residuals', 1,TRUE)
a<-table.row.end(a)
a<-table.row.start(a)
a<-table.element(a,'Value', 1,TRUE)
a<-table.row.end(a)
for (i in (par4*par5+par3):length(resid)) {
a<-table.row.start(a)
a<-table.element(a,resid[i])
a<-table.row.end(a)
}
a<-table.end(a)
table.save(a,file='mytable1.tab')