Free Statistics

of Irreproducible Research!

Author's title

Author*The author of this computation has been verified*
R Software Modulerwasp_autocorrelation.wasp
Title produced by software(Partial) Autocorrelation Function
Date of computationFri, 04 Dec 2009 09:36:06 -0700
Cite this page as followsStatistical Computations at FreeStatistics.org, Office for Research Development and Education, URL https://freestatistics.org/blog/index.php?v=date/2009/Dec/04/t1259944641rq1d862t8kdrcvx.htm/, Retrieved Sun, 28 Apr 2024 18:30:46 +0000
Statistical Computations at FreeStatistics.org, Office for Research Development and Education, URL https://freestatistics.org/blog/index.php?pk=63875, Retrieved Sun, 28 Apr 2024 18:30:46 +0000
QR Codes:

Original text written by user:
IsPrivate?No (this computation is public)
User-defined keywords
Estimated Impact102
Family? (F = Feedback message, R = changed R code, M = changed R Module, P = changed Parameters, D = changed Data)
-     [Univariate Data Series] [data set] [2008-12-01 19:54:57] [b98453cac15ba1066b407e146608df68]
- RMP   [Standard Deviation-Mean Plot] [] [2009-11-27 14:40:44] [b98453cac15ba1066b407e146608df68]
- RMPD      [(Partial) Autocorrelation Function] [] [2009-12-04 16:36:06] [6e025b5370bdd3143fbe248190b38274] [Current]
Feedback Forum

Post a new message
Dataseries X:
15836.8
17570.4
18252.1
16196.7
16643
17729
16446.1
15993.8
16373.5
17842.2
22321.5
22786.7
18274.1
22392.9
23899.3
21343.5
22952.3
21374.4
21164.1
20906.5
17877.4
20664.3
22160
19813.6
17735.4
19640.2
20844.4
19823.1
18594.6
21350.6
18574.1
18924.2
17343.4
19961.2
19932.1
19464.6
16165.4
17574.9
19795.4
19439.5
17170
21072.4
17751.8
17515.5
18040.3
19090.1
17746.5
19202.1
15141.6
16258.1
18586.5
17209.4
17838.7
19123.5
16583.6
15991.2
16704.4
17420.4
17872
17823.2


Summary of computational transaction
Raw Inputview raw input (R code)
Raw Outputview raw output of R engine
Computing time3 seconds
R Server'Gwilym Jenkins' @ 72.249.127.135

\begin{tabular}{lllllllll}
\hline
Summary of computational transaction \tabularnewline
Raw Input & view raw input (R code)  \tabularnewline
Raw Output & view raw output of R engine  \tabularnewline
Computing time & 3 seconds \tabularnewline
R Server & 'Gwilym Jenkins' @ 72.249.127.135 \tabularnewline
\hline
\end{tabular}
%Source: https://freestatistics.org/blog/index.php?pk=63875&T=0

[TABLE]
[ROW][C]Summary of computational transaction[/C][/ROW]
[ROW][C]Raw Input[/C][C]view raw input (R code) [/C][/ROW]
[ROW][C]Raw Output[/C][C]view raw output of R engine [/C][/ROW]
[ROW][C]Computing time[/C][C]3 seconds[/C][/ROW]
[ROW][C]R Server[/C][C]'Gwilym Jenkins' @ 72.249.127.135[/C][/ROW]
[/TABLE]
Source: https://freestatistics.org/blog/index.php?pk=63875&T=0

Globally Unique Identifier (entire table): ba.freestatistics.org/blog/index.php?pk=63875&T=0

As an alternative you can also use a QR Code:  

The GUIDs for individual cells are displayed in the table below:

Summary of computational transaction
Raw Inputview raw input (R code)
Raw Outputview raw output of R engine
Computing time3 seconds
R Server'Gwilym Jenkins' @ 72.249.127.135


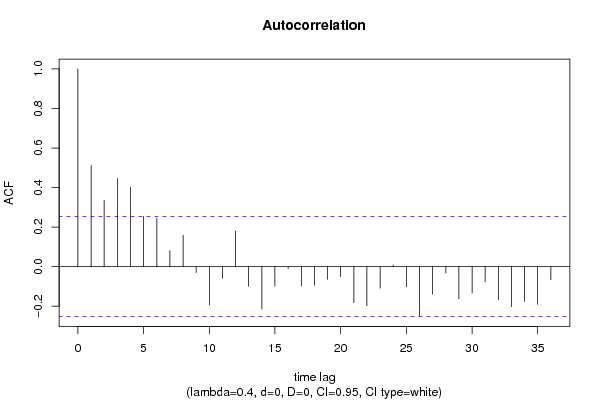
Autocorrelation Function
Time lag kACF(k)T-STATP-value
10.5120283.96629.9e-05
20.3359222.6020.005828
30.4461443.45580.000507
40.4011183.1070.001443
50.2538631.96640.026941
60.2452411.89960.031146
70.0808190.6260.266837
80.1587911.230.11175
9-0.030011-0.23250.408484
10-0.194182-1.50410.068897
11-0.059193-0.45850.324121
120.1805331.39840.08357
13-0.100252-0.77650.220239
14-0.214219-1.65930.051134
15-0.099217-0.76850.222594
16-0.009315-0.07220.47136
17-0.098281-0.76130.224736
18-0.094083-0.72880.23449
19-0.064433-0.49910.309769
20-0.05058-0.39180.3483
21-0.182292-1.4120.081553
22-0.197302-1.52830.065847
23-0.109335-0.84690.200207
240.0086370.06690.473441
25-0.102353-0.79280.215503
26-0.250998-1.94420.028281
27-0.139533-1.08080.142052
28-0.031652-0.24520.40358
29-0.162513-1.25880.106486
30-0.133238-1.03210.153094
31-0.076751-0.59450.277203
32-0.167901-1.30060.099192
33-0.202868-1.57140.060674
34-0.176297-1.36560.088583
35-0.190606-1.47640.07253
36-0.066289-0.51350.304753

\begin{tabular}{lllllllll}
\hline
Autocorrelation Function \tabularnewline
Time lag k & ACF(k) & T-STAT & P-value \tabularnewline
1 & 0.512028 & 3.9662 & 9.9e-05 \tabularnewline
2 & 0.335922 & 2.602 & 0.005828 \tabularnewline
3 & 0.446144 & 3.4558 & 0.000507 \tabularnewline
4 & 0.401118 & 3.107 & 0.001443 \tabularnewline
5 & 0.253863 & 1.9664 & 0.026941 \tabularnewline
6 & 0.245241 & 1.8996 & 0.031146 \tabularnewline
7 & 0.080819 & 0.626 & 0.266837 \tabularnewline
8 & 0.158791 & 1.23 & 0.11175 \tabularnewline
9 & -0.030011 & -0.2325 & 0.408484 \tabularnewline
10 & -0.194182 & -1.5041 & 0.068897 \tabularnewline
11 & -0.059193 & -0.4585 & 0.324121 \tabularnewline
12 & 0.180533 & 1.3984 & 0.08357 \tabularnewline
13 & -0.100252 & -0.7765 & 0.220239 \tabularnewline
14 & -0.214219 & -1.6593 & 0.051134 \tabularnewline
15 & -0.099217 & -0.7685 & 0.222594 \tabularnewline
16 & -0.009315 & -0.0722 & 0.47136 \tabularnewline
17 & -0.098281 & -0.7613 & 0.224736 \tabularnewline
18 & -0.094083 & -0.7288 & 0.23449 \tabularnewline
19 & -0.064433 & -0.4991 & 0.309769 \tabularnewline
20 & -0.05058 & -0.3918 & 0.3483 \tabularnewline
21 & -0.182292 & -1.412 & 0.081553 \tabularnewline
22 & -0.197302 & -1.5283 & 0.065847 \tabularnewline
23 & -0.109335 & -0.8469 & 0.200207 \tabularnewline
24 & 0.008637 & 0.0669 & 0.473441 \tabularnewline
25 & -0.102353 & -0.7928 & 0.215503 \tabularnewline
26 & -0.250998 & -1.9442 & 0.028281 \tabularnewline
27 & -0.139533 & -1.0808 & 0.142052 \tabularnewline
28 & -0.031652 & -0.2452 & 0.40358 \tabularnewline
29 & -0.162513 & -1.2588 & 0.106486 \tabularnewline
30 & -0.133238 & -1.0321 & 0.153094 \tabularnewline
31 & -0.076751 & -0.5945 & 0.277203 \tabularnewline
32 & -0.167901 & -1.3006 & 0.099192 \tabularnewline
33 & -0.202868 & -1.5714 & 0.060674 \tabularnewline
34 & -0.176297 & -1.3656 & 0.088583 \tabularnewline
35 & -0.190606 & -1.4764 & 0.07253 \tabularnewline
36 & -0.066289 & -0.5135 & 0.304753 \tabularnewline
\hline
\end{tabular}
%Source: https://freestatistics.org/blog/index.php?pk=63875&T=1

[TABLE]
[ROW][C]Autocorrelation Function[/C][/ROW]
[ROW][C]Time lag k[/C][C]ACF(k)[/C][C]T-STAT[/C][C]P-value[/C][/ROW]
[ROW][C]1[/C][C]0.512028[/C][C]3.9662[/C][C]9.9e-05[/C][/ROW]
[ROW][C]2[/C][C]0.335922[/C][C]2.602[/C][C]0.005828[/C][/ROW]
[ROW][C]3[/C][C]0.446144[/C][C]3.4558[/C][C]0.000507[/C][/ROW]
[ROW][C]4[/C][C]0.401118[/C][C]3.107[/C][C]0.001443[/C][/ROW]
[ROW][C]5[/C][C]0.253863[/C][C]1.9664[/C][C]0.026941[/C][/ROW]
[ROW][C]6[/C][C]0.245241[/C][C]1.8996[/C][C]0.031146[/C][/ROW]
[ROW][C]7[/C][C]0.080819[/C][C]0.626[/C][C]0.266837[/C][/ROW]
[ROW][C]8[/C][C]0.158791[/C][C]1.23[/C][C]0.11175[/C][/ROW]
[ROW][C]9[/C][C]-0.030011[/C][C]-0.2325[/C][C]0.408484[/C][/ROW]
[ROW][C]10[/C][C]-0.194182[/C][C]-1.5041[/C][C]0.068897[/C][/ROW]
[ROW][C]11[/C][C]-0.059193[/C][C]-0.4585[/C][C]0.324121[/C][/ROW]
[ROW][C]12[/C][C]0.180533[/C][C]1.3984[/C][C]0.08357[/C][/ROW]
[ROW][C]13[/C][C]-0.100252[/C][C]-0.7765[/C][C]0.220239[/C][/ROW]
[ROW][C]14[/C][C]-0.214219[/C][C]-1.6593[/C][C]0.051134[/C][/ROW]
[ROW][C]15[/C][C]-0.099217[/C][C]-0.7685[/C][C]0.222594[/C][/ROW]
[ROW][C]16[/C][C]-0.009315[/C][C]-0.0722[/C][C]0.47136[/C][/ROW]
[ROW][C]17[/C][C]-0.098281[/C][C]-0.7613[/C][C]0.224736[/C][/ROW]
[ROW][C]18[/C][C]-0.094083[/C][C]-0.7288[/C][C]0.23449[/C][/ROW]
[ROW][C]19[/C][C]-0.064433[/C][C]-0.4991[/C][C]0.309769[/C][/ROW]
[ROW][C]20[/C][C]-0.05058[/C][C]-0.3918[/C][C]0.3483[/C][/ROW]
[ROW][C]21[/C][C]-0.182292[/C][C]-1.412[/C][C]0.081553[/C][/ROW]
[ROW][C]22[/C][C]-0.197302[/C][C]-1.5283[/C][C]0.065847[/C][/ROW]
[ROW][C]23[/C][C]-0.109335[/C][C]-0.8469[/C][C]0.200207[/C][/ROW]
[ROW][C]24[/C][C]0.008637[/C][C]0.0669[/C][C]0.473441[/C][/ROW]
[ROW][C]25[/C][C]-0.102353[/C][C]-0.7928[/C][C]0.215503[/C][/ROW]
[ROW][C]26[/C][C]-0.250998[/C][C]-1.9442[/C][C]0.028281[/C][/ROW]
[ROW][C]27[/C][C]-0.139533[/C][C]-1.0808[/C][C]0.142052[/C][/ROW]
[ROW][C]28[/C][C]-0.031652[/C][C]-0.2452[/C][C]0.40358[/C][/ROW]
[ROW][C]29[/C][C]-0.162513[/C][C]-1.2588[/C][C]0.106486[/C][/ROW]
[ROW][C]30[/C][C]-0.133238[/C][C]-1.0321[/C][C]0.153094[/C][/ROW]
[ROW][C]31[/C][C]-0.076751[/C][C]-0.5945[/C][C]0.277203[/C][/ROW]
[ROW][C]32[/C][C]-0.167901[/C][C]-1.3006[/C][C]0.099192[/C][/ROW]
[ROW][C]33[/C][C]-0.202868[/C][C]-1.5714[/C][C]0.060674[/C][/ROW]
[ROW][C]34[/C][C]-0.176297[/C][C]-1.3656[/C][C]0.088583[/C][/ROW]
[ROW][C]35[/C][C]-0.190606[/C][C]-1.4764[/C][C]0.07253[/C][/ROW]
[ROW][C]36[/C][C]-0.066289[/C][C]-0.5135[/C][C]0.304753[/C][/ROW]
[/TABLE]
Source: https://freestatistics.org/blog/index.php?pk=63875&T=1

Globally Unique Identifier (entire table): ba.freestatistics.org/blog/index.php?pk=63875&T=1

As an alternative you can also use a QR Code:  

The GUIDs for individual cells are displayed in the table below:

Autocorrelation Function
Time lag kACF(k)T-STATP-value
10.5120283.96629.9e-05
20.3359222.6020.005828
30.4461443.45580.000507
40.4011183.1070.001443
50.2538631.96640.026941
60.2452411.89960.031146
70.0808190.6260.266837
80.1587911.230.11175
9-0.030011-0.23250.408484
10-0.194182-1.50410.068897
11-0.059193-0.45850.324121
120.1805331.39840.08357
13-0.100252-0.77650.220239
14-0.214219-1.65930.051134
15-0.099217-0.76850.222594
16-0.009315-0.07220.47136
17-0.098281-0.76130.224736
18-0.094083-0.72880.23449
19-0.064433-0.49910.309769
20-0.05058-0.39180.3483
21-0.182292-1.4120.081553
22-0.197302-1.52830.065847
23-0.109335-0.84690.200207
240.0086370.06690.473441
25-0.102353-0.79280.215503
26-0.250998-1.94420.028281
27-0.139533-1.08080.142052
28-0.031652-0.24520.40358
29-0.162513-1.25880.106486
30-0.133238-1.03210.153094
31-0.076751-0.59450.277203
32-0.167901-1.30060.099192
33-0.202868-1.57140.060674
34-0.176297-1.36560.088583
35-0.190606-1.47640.07253
36-0.066289-0.51350.304753


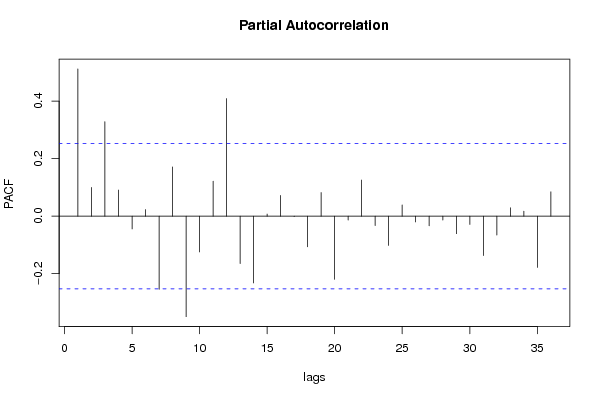
Partial Autocorrelation Function
Time lag kPACF(k)T-STATP-value
10.5120283.96629.9e-05
20.0999550.77420.220912
30.3287752.54670.006729
40.0907960.70330.242294
5-0.044574-0.34530.36555
60.0228140.17670.430162
7-0.254501-1.97140.02665
80.1713671.32740.094702
9-0.349655-2.70840.004398
10-0.124733-0.96620.168916
110.121760.94310.174694
120.408993.1680.001207
13-0.164931-1.27750.103165
14-0.23217-1.79840.038574
150.0072540.05620.477689
160.0721160.55860.289255
17-0.001556-0.0120.495213
18-0.106637-0.8260.206036
190.0821150.63610.263579
20-0.219655-1.70140.047019
21-0.013683-0.1060.457971
220.1253410.97090.167751
23-0.032953-0.25530.399701
24-0.101898-0.78930.216522
250.0391190.3030.381464
26-0.020121-0.15590.438336
27-0.033865-0.26230.396987
28-0.013705-0.10620.457904
29-0.061125-0.47350.318796
30-0.029002-0.22460.411508
31-0.137003-1.06120.146422
32-0.06592-0.51060.305747
330.0288370.22340.412004
340.0170230.13190.44777
35-0.178677-1.3840.085739
360.0845930.65530.257403

\begin{tabular}{lllllllll}
\hline
Partial Autocorrelation Function \tabularnewline
Time lag k & PACF(k) & T-STAT & P-value \tabularnewline
1 & 0.512028 & 3.9662 & 9.9e-05 \tabularnewline
2 & 0.099955 & 0.7742 & 0.220912 \tabularnewline
3 & 0.328775 & 2.5467 & 0.006729 \tabularnewline
4 & 0.090796 & 0.7033 & 0.242294 \tabularnewline
5 & -0.044574 & -0.3453 & 0.36555 \tabularnewline
6 & 0.022814 & 0.1767 & 0.430162 \tabularnewline
7 & -0.254501 & -1.9714 & 0.02665 \tabularnewline
8 & 0.171367 & 1.3274 & 0.094702 \tabularnewline
9 & -0.349655 & -2.7084 & 0.004398 \tabularnewline
10 & -0.124733 & -0.9662 & 0.168916 \tabularnewline
11 & 0.12176 & 0.9431 & 0.174694 \tabularnewline
12 & 0.40899 & 3.168 & 0.001207 \tabularnewline
13 & -0.164931 & -1.2775 & 0.103165 \tabularnewline
14 & -0.23217 & -1.7984 & 0.038574 \tabularnewline
15 & 0.007254 & 0.0562 & 0.477689 \tabularnewline
16 & 0.072116 & 0.5586 & 0.289255 \tabularnewline
17 & -0.001556 & -0.012 & 0.495213 \tabularnewline
18 & -0.106637 & -0.826 & 0.206036 \tabularnewline
19 & 0.082115 & 0.6361 & 0.263579 \tabularnewline
20 & -0.219655 & -1.7014 & 0.047019 \tabularnewline
21 & -0.013683 & -0.106 & 0.457971 \tabularnewline
22 & 0.125341 & 0.9709 & 0.167751 \tabularnewline
23 & -0.032953 & -0.2553 & 0.399701 \tabularnewline
24 & -0.101898 & -0.7893 & 0.216522 \tabularnewline
25 & 0.039119 & 0.303 & 0.381464 \tabularnewline
26 & -0.020121 & -0.1559 & 0.438336 \tabularnewline
27 & -0.033865 & -0.2623 & 0.396987 \tabularnewline
28 & -0.013705 & -0.1062 & 0.457904 \tabularnewline
29 & -0.061125 & -0.4735 & 0.318796 \tabularnewline
30 & -0.029002 & -0.2246 & 0.411508 \tabularnewline
31 & -0.137003 & -1.0612 & 0.146422 \tabularnewline
32 & -0.06592 & -0.5106 & 0.305747 \tabularnewline
33 & 0.028837 & 0.2234 & 0.412004 \tabularnewline
34 & 0.017023 & 0.1319 & 0.44777 \tabularnewline
35 & -0.178677 & -1.384 & 0.085739 \tabularnewline
36 & 0.084593 & 0.6553 & 0.257403 \tabularnewline
\hline
\end{tabular}
%Source: https://freestatistics.org/blog/index.php?pk=63875&T=2

[TABLE]
[ROW][C]Partial Autocorrelation Function[/C][/ROW]
[ROW][C]Time lag k[/C][C]PACF(k)[/C][C]T-STAT[/C][C]P-value[/C][/ROW]
[ROW][C]1[/C][C]0.512028[/C][C]3.9662[/C][C]9.9e-05[/C][/ROW]
[ROW][C]2[/C][C]0.099955[/C][C]0.7742[/C][C]0.220912[/C][/ROW]
[ROW][C]3[/C][C]0.328775[/C][C]2.5467[/C][C]0.006729[/C][/ROW]
[ROW][C]4[/C][C]0.090796[/C][C]0.7033[/C][C]0.242294[/C][/ROW]
[ROW][C]5[/C][C]-0.044574[/C][C]-0.3453[/C][C]0.36555[/C][/ROW]
[ROW][C]6[/C][C]0.022814[/C][C]0.1767[/C][C]0.430162[/C][/ROW]
[ROW][C]7[/C][C]-0.254501[/C][C]-1.9714[/C][C]0.02665[/C][/ROW]
[ROW][C]8[/C][C]0.171367[/C][C]1.3274[/C][C]0.094702[/C][/ROW]
[ROW][C]9[/C][C]-0.349655[/C][C]-2.7084[/C][C]0.004398[/C][/ROW]
[ROW][C]10[/C][C]-0.124733[/C][C]-0.9662[/C][C]0.168916[/C][/ROW]
[ROW][C]11[/C][C]0.12176[/C][C]0.9431[/C][C]0.174694[/C][/ROW]
[ROW][C]12[/C][C]0.40899[/C][C]3.168[/C][C]0.001207[/C][/ROW]
[ROW][C]13[/C][C]-0.164931[/C][C]-1.2775[/C][C]0.103165[/C][/ROW]
[ROW][C]14[/C][C]-0.23217[/C][C]-1.7984[/C][C]0.038574[/C][/ROW]
[ROW][C]15[/C][C]0.007254[/C][C]0.0562[/C][C]0.477689[/C][/ROW]
[ROW][C]16[/C][C]0.072116[/C][C]0.5586[/C][C]0.289255[/C][/ROW]
[ROW][C]17[/C][C]-0.001556[/C][C]-0.012[/C][C]0.495213[/C][/ROW]
[ROW][C]18[/C][C]-0.106637[/C][C]-0.826[/C][C]0.206036[/C][/ROW]
[ROW][C]19[/C][C]0.082115[/C][C]0.6361[/C][C]0.263579[/C][/ROW]
[ROW][C]20[/C][C]-0.219655[/C][C]-1.7014[/C][C]0.047019[/C][/ROW]
[ROW][C]21[/C][C]-0.013683[/C][C]-0.106[/C][C]0.457971[/C][/ROW]
[ROW][C]22[/C][C]0.125341[/C][C]0.9709[/C][C]0.167751[/C][/ROW]
[ROW][C]23[/C][C]-0.032953[/C][C]-0.2553[/C][C]0.399701[/C][/ROW]
[ROW][C]24[/C][C]-0.101898[/C][C]-0.7893[/C][C]0.216522[/C][/ROW]
[ROW][C]25[/C][C]0.039119[/C][C]0.303[/C][C]0.381464[/C][/ROW]
[ROW][C]26[/C][C]-0.020121[/C][C]-0.1559[/C][C]0.438336[/C][/ROW]
[ROW][C]27[/C][C]-0.033865[/C][C]-0.2623[/C][C]0.396987[/C][/ROW]
[ROW][C]28[/C][C]-0.013705[/C][C]-0.1062[/C][C]0.457904[/C][/ROW]
[ROW][C]29[/C][C]-0.061125[/C][C]-0.4735[/C][C]0.318796[/C][/ROW]
[ROW][C]30[/C][C]-0.029002[/C][C]-0.2246[/C][C]0.411508[/C][/ROW]
[ROW][C]31[/C][C]-0.137003[/C][C]-1.0612[/C][C]0.146422[/C][/ROW]
[ROW][C]32[/C][C]-0.06592[/C][C]-0.5106[/C][C]0.305747[/C][/ROW]
[ROW][C]33[/C][C]0.028837[/C][C]0.2234[/C][C]0.412004[/C][/ROW]
[ROW][C]34[/C][C]0.017023[/C][C]0.1319[/C][C]0.44777[/C][/ROW]
[ROW][C]35[/C][C]-0.178677[/C][C]-1.384[/C][C]0.085739[/C][/ROW]
[ROW][C]36[/C][C]0.084593[/C][C]0.6553[/C][C]0.257403[/C][/ROW]
[/TABLE]
Source: https://freestatistics.org/blog/index.php?pk=63875&T=2

Globally Unique Identifier (entire table): ba.freestatistics.org/blog/index.php?pk=63875&T=2

As an alternative you can also use a QR Code:  

The GUIDs for individual cells are displayed in the table below:

Partial Autocorrelation Function
Time lag kPACF(k)T-STATP-value
10.5120283.96629.9e-05
20.0999550.77420.220912
30.3287752.54670.006729
40.0907960.70330.242294
5-0.044574-0.34530.36555
60.0228140.17670.430162
7-0.254501-1.97140.02665
80.1713671.32740.094702
9-0.349655-2.70840.004398
10-0.124733-0.96620.168916
110.121760.94310.174694
120.408993.1680.001207
13-0.164931-1.27750.103165
14-0.23217-1.79840.038574
150.0072540.05620.477689
160.0721160.55860.289255
17-0.001556-0.0120.495213
18-0.106637-0.8260.206036
190.0821150.63610.263579
20-0.219655-1.70140.047019
21-0.013683-0.1060.457971
220.1253410.97090.167751
23-0.032953-0.25530.399701
24-0.101898-0.78930.216522
250.0391190.3030.381464
26-0.020121-0.15590.438336
27-0.033865-0.26230.396987
28-0.013705-0.10620.457904
29-0.061125-0.47350.318796
30-0.029002-0.22460.411508
31-0.137003-1.06120.146422
32-0.06592-0.51060.305747
330.0288370.22340.412004
340.0170230.13190.44777
35-0.178677-1.3840.085739
360.0845930.65530.257403


Parameters (Session):
par1 = 36 ; par2 = 0.4 ; par3 = 0 ; par4 = 0 ; par5 = 12 ; par6 = White Noise ; par7 = 0.95 ;
Parameters (R input):
par1 = 36 ; par2 = 0.4 ; par3 = 0 ; par4 = 0 ; par5 = 12 ; par6 = White Noise ; par7 = 0.95 ;
R code (references can be found in the software module):
if (par1 == 'Default') {
par1 = 10*log10(length(x))
} else {
par1 <- as.numeric(par1)
}
par2 <- as.numeric(par2)
par3 <- as.numeric(par3)
par4 <- as.numeric(par4)
par5 <- as.numeric(par5)
if (par6 == 'White Noise') par6 <- 'white' else par6 <- 'ma'
par7 <- as.numeric(par7)
if (par2 == 0) {
x <- log(x)
} else {
x <- (x ^ par2 - 1) / par2
}
if (par3 > 0) x <- diff(x,lag=1,difference=par3)
if (par4 > 0) x <- diff(x,lag=par5,difference=par4)
bitmap(file='pic1.png')
racf <- acf(x, par1, main='Autocorrelation', xlab='time lag', ylab='ACF', ci.type=par6, ci=par7, sub=paste('(lambda=',par2,', d=',par3,', D=',par4,', CI=', par7, ', CI type=',par6,')',sep=''))
dev.off()
bitmap(file='pic2.png')
rpacf <- pacf(x,par1,main='Partial Autocorrelation',xlab='lags',ylab='PACF')
dev.off()
(myacf <- c(racf$acf))
(mypacf <- c(rpacf$acf))
lengthx <- length(x)
sqrtn <- sqrt(lengthx)
load(file='createtable')
a<-table.start()
a<-table.row.start(a)
a<-table.element(a,'Autocorrelation Function',4,TRUE)
a<-table.row.end(a)
a<-table.row.start(a)
a<-table.element(a,'Time lag k',header=TRUE)
a<-table.element(a,hyperlink('basics.htm','ACF(k)','click here for more information about the Autocorrelation Function'),header=TRUE)
a<-table.element(a,'T-STAT',header=TRUE)
a<-table.element(a,'P-value',header=TRUE)
a<-table.row.end(a)
for (i in 2:(par1+1)) {
a<-table.row.start(a)
a<-table.element(a,i-1,header=TRUE)
a<-table.element(a,round(myacf[i],6))
mytstat <- myacf[i]*sqrtn
a<-table.element(a,round(mytstat,4))
a<-table.element(a,round(1-pt(abs(mytstat),lengthx),6))
a<-table.row.end(a)
}
a<-table.end(a)
table.save(a,file='mytable.tab')
a<-table.start()
a<-table.row.start(a)
a<-table.element(a,'Partial Autocorrelation Function',4,TRUE)
a<-table.row.end(a)
a<-table.row.start(a)
a<-table.element(a,'Time lag k',header=TRUE)
a<-table.element(a,hyperlink('basics.htm','PACF(k)','click here for more information about the Partial Autocorrelation Function'),header=TRUE)
a<-table.element(a,'T-STAT',header=TRUE)
a<-table.element(a,'P-value',header=TRUE)
a<-table.row.end(a)
for (i in 1:par1) {
a<-table.row.start(a)
a<-table.element(a,i,header=TRUE)
a<-table.element(a,round(mypacf[i],6))
mytstat <- mypacf[i]*sqrtn
a<-table.element(a,round(mytstat,4))
a<-table.element(a,round(1-pt(abs(mytstat),lengthx),6))
a<-table.row.end(a)
}
a<-table.end(a)
table.save(a,file='mytable1.tab')