Free Statistics

of Irreproducible Research!

Author's title

Author*The author of this computation has been verified*
R Software Modulerwasp_autocorrelation.wasp
Title produced by software(Partial) Autocorrelation Function
Date of computationFri, 04 Dec 2009 09:50:35 -0700
Cite this page as followsStatistical Computations at FreeStatistics.org, Office for Research Development and Education, URL https://freestatistics.org/blog/index.php?v=date/2009/Dec/04/t1259945580g1hppjba6oyyfal.htm/, Retrieved Sun, 28 Apr 2024 03:36:52 +0000
Statistical Computations at FreeStatistics.org, Office for Research Development and Education, URL https://freestatistics.org/blog/index.php?pk=63891, Retrieved Sun, 28 Apr 2024 03:36:52 +0000
QR Codes:

Original text written by user:
IsPrivate?No (this computation is public)
User-defined keywords
Estimated Impact135
Family? (F = Feedback message, R = changed R code, M = changed R Module, P = changed Parameters, D = changed Data)
-     [Univariate Data Series] [data set] [2008-12-01 19:54:57] [b98453cac15ba1066b407e146608df68]
- RMP   [(Partial) Autocorrelation Function] [] [2009-11-27 14:47:30] [b98453cac15ba1066b407e146608df68]
- R PD    [(Partial) Autocorrelation Function] [] [2009-12-01 17:18:57] [ee35698a38947a6c6c039b1e3deafc05]
-   PD        [(Partial) Autocorrelation Function] [] [2009-12-04 16:50:35] [6e025b5370bdd3143fbe248190b38274] [Current]
-   P           [(Partial) Autocorrelation Function] [] [2009-12-17 16:04:13] [78d53abea600e0825abda35dbfc51d4c]
Feedback Forum

Post a new message
Dataseries X:
15836.8
17570.4
18252.1
16196.7
16643
17729
16446.1
15993.8
16373.5
17842.2
22321.5
22786.7
18274.1
22392.9
23899.3
21343.5
22952.3
21374.4
21164.1
20906.5
17877.4
20664.3
22160
19813.6
17735.4
19640.2
20844.4
19823.1
18594.6
21350.6
18574.1
18924.2
17343.4
19961.2
19932.1
19464.6
16165.4
17574.9
19795.4
19439.5
17170
21072.4
17751.8
17515.5
18040.3
19090.1
17746.5
19202.1
15141.6
16258.1
18586.5
17209.4
17838.7
19123.5
16583.6
15991.2
16704.4
17420.4
17872
17823.2


Summary of computational transaction
Raw Inputview raw input (R code)
Raw Outputview raw output of R engine
Computing time1 seconds
R Server'Gwilym Jenkins' @ 72.249.127.135

\begin{tabular}{lllllllll}
\hline
Summary of computational transaction \tabularnewline
Raw Input & view raw input (R code)  \tabularnewline
Raw Output & view raw output of R engine  \tabularnewline
Computing time & 1 seconds \tabularnewline
R Server & 'Gwilym Jenkins' @ 72.249.127.135 \tabularnewline
\hline
\end{tabular}
%Source: https://freestatistics.org/blog/index.php?pk=63891&T=0

[TABLE]
[ROW][C]Summary of computational transaction[/C][/ROW]
[ROW][C]Raw Input[/C][C]view raw input (R code) [/C][/ROW]
[ROW][C]Raw Output[/C][C]view raw output of R engine [/C][/ROW]
[ROW][C]Computing time[/C][C]1 seconds[/C][/ROW]
[ROW][C]R Server[/C][C]'Gwilym Jenkins' @ 72.249.127.135[/C][/ROW]
[/TABLE]
Source: https://freestatistics.org/blog/index.php?pk=63891&T=0

Globally Unique Identifier (entire table): ba.freestatistics.org/blog/index.php?pk=63891&T=0

As an alternative you can also use a QR Code:  

The GUIDs for individual cells are displayed in the table below:

Summary of computational transaction
Raw Inputview raw input (R code)
Raw Outputview raw output of R engine
Computing time1 seconds
R Server'Gwilym Jenkins' @ 72.249.127.135


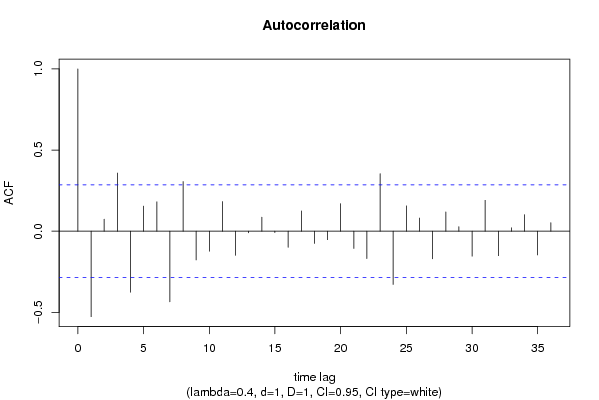
Autocorrelation Function
Time lag kACF(k)T-STATP-value
1-0.526774-3.61140.000369
20.0736290.50480.308038
30.3582582.45610.008898
4-0.375776-2.57620.006596
50.1545241.05940.147424
60.1813291.24310.109993
7-0.435369-2.98470.002247
80.305712.09580.020754
9-0.177253-1.21520.115183
10-0.12346-0.84640.200809
110.1823011.24980.108782
12-0.14876-1.01980.156511
13-0.010213-0.070.472238
140.0862520.59130.278573
15-0.008666-0.05940.476438
16-0.099631-0.6830.24897
170.1248390.85580.198212
18-0.075144-0.51520.304428
19-0.052544-0.36020.360146
200.1694581.16170.125602
21-0.106534-0.73040.234397
22-0.168496-1.15510.126934
230.3543992.42960.009494
24-0.328202-2.250.014584
250.1560741.070.145044
260.0809920.55530.290678
27-0.170063-1.16590.124771
280.1185510.81270.210231
290.0275880.18910.4254
30-0.153856-1.05480.148459
310.1902651.30440.099226
32-0.151262-1.0370.152521
330.0212160.14550.442488
340.1016930.69720.244566
35-0.14615-1.0020.160748
360.0522470.35820.360903

\begin{tabular}{lllllllll}
\hline
Autocorrelation Function \tabularnewline
Time lag k & ACF(k) & T-STAT & P-value \tabularnewline
1 & -0.526774 & -3.6114 & 0.000369 \tabularnewline
2 & 0.073629 & 0.5048 & 0.308038 \tabularnewline
3 & 0.358258 & 2.4561 & 0.008898 \tabularnewline
4 & -0.375776 & -2.5762 & 0.006596 \tabularnewline
5 & 0.154524 & 1.0594 & 0.147424 \tabularnewline
6 & 0.181329 & 1.2431 & 0.109993 \tabularnewline
7 & -0.435369 & -2.9847 & 0.002247 \tabularnewline
8 & 0.30571 & 2.0958 & 0.020754 \tabularnewline
9 & -0.177253 & -1.2152 & 0.115183 \tabularnewline
10 & -0.12346 & -0.8464 & 0.200809 \tabularnewline
11 & 0.182301 & 1.2498 & 0.108782 \tabularnewline
12 & -0.14876 & -1.0198 & 0.156511 \tabularnewline
13 & -0.010213 & -0.07 & 0.472238 \tabularnewline
14 & 0.086252 & 0.5913 & 0.278573 \tabularnewline
15 & -0.008666 & -0.0594 & 0.476438 \tabularnewline
16 & -0.099631 & -0.683 & 0.24897 \tabularnewline
17 & 0.124839 & 0.8558 & 0.198212 \tabularnewline
18 & -0.075144 & -0.5152 & 0.304428 \tabularnewline
19 & -0.052544 & -0.3602 & 0.360146 \tabularnewline
20 & 0.169458 & 1.1617 & 0.125602 \tabularnewline
21 & -0.106534 & -0.7304 & 0.234397 \tabularnewline
22 & -0.168496 & -1.1551 & 0.126934 \tabularnewline
23 & 0.354399 & 2.4296 & 0.009494 \tabularnewline
24 & -0.328202 & -2.25 & 0.014584 \tabularnewline
25 & 0.156074 & 1.07 & 0.145044 \tabularnewline
26 & 0.080992 & 0.5553 & 0.290678 \tabularnewline
27 & -0.170063 & -1.1659 & 0.124771 \tabularnewline
28 & 0.118551 & 0.8127 & 0.210231 \tabularnewline
29 & 0.027588 & 0.1891 & 0.4254 \tabularnewline
30 & -0.153856 & -1.0548 & 0.148459 \tabularnewline
31 & 0.190265 & 1.3044 & 0.099226 \tabularnewline
32 & -0.151262 & -1.037 & 0.152521 \tabularnewline
33 & 0.021216 & 0.1455 & 0.442488 \tabularnewline
34 & 0.101693 & 0.6972 & 0.244566 \tabularnewline
35 & -0.14615 & -1.002 & 0.160748 \tabularnewline
36 & 0.052247 & 0.3582 & 0.360903 \tabularnewline
\hline
\end{tabular}
%Source: https://freestatistics.org/blog/index.php?pk=63891&T=1

[TABLE]
[ROW][C]Autocorrelation Function[/C][/ROW]
[ROW][C]Time lag k[/C][C]ACF(k)[/C][C]T-STAT[/C][C]P-value[/C][/ROW]
[ROW][C]1[/C][C]-0.526774[/C][C]-3.6114[/C][C]0.000369[/C][/ROW]
[ROW][C]2[/C][C]0.073629[/C][C]0.5048[/C][C]0.308038[/C][/ROW]
[ROW][C]3[/C][C]0.358258[/C][C]2.4561[/C][C]0.008898[/C][/ROW]
[ROW][C]4[/C][C]-0.375776[/C][C]-2.5762[/C][C]0.006596[/C][/ROW]
[ROW][C]5[/C][C]0.154524[/C][C]1.0594[/C][C]0.147424[/C][/ROW]
[ROW][C]6[/C][C]0.181329[/C][C]1.2431[/C][C]0.109993[/C][/ROW]
[ROW][C]7[/C][C]-0.435369[/C][C]-2.9847[/C][C]0.002247[/C][/ROW]
[ROW][C]8[/C][C]0.30571[/C][C]2.0958[/C][C]0.020754[/C][/ROW]
[ROW][C]9[/C][C]-0.177253[/C][C]-1.2152[/C][C]0.115183[/C][/ROW]
[ROW][C]10[/C][C]-0.12346[/C][C]-0.8464[/C][C]0.200809[/C][/ROW]
[ROW][C]11[/C][C]0.182301[/C][C]1.2498[/C][C]0.108782[/C][/ROW]
[ROW][C]12[/C][C]-0.14876[/C][C]-1.0198[/C][C]0.156511[/C][/ROW]
[ROW][C]13[/C][C]-0.010213[/C][C]-0.07[/C][C]0.472238[/C][/ROW]
[ROW][C]14[/C][C]0.086252[/C][C]0.5913[/C][C]0.278573[/C][/ROW]
[ROW][C]15[/C][C]-0.008666[/C][C]-0.0594[/C][C]0.476438[/C][/ROW]
[ROW][C]16[/C][C]-0.099631[/C][C]-0.683[/C][C]0.24897[/C][/ROW]
[ROW][C]17[/C][C]0.124839[/C][C]0.8558[/C][C]0.198212[/C][/ROW]
[ROW][C]18[/C][C]-0.075144[/C][C]-0.5152[/C][C]0.304428[/C][/ROW]
[ROW][C]19[/C][C]-0.052544[/C][C]-0.3602[/C][C]0.360146[/C][/ROW]
[ROW][C]20[/C][C]0.169458[/C][C]1.1617[/C][C]0.125602[/C][/ROW]
[ROW][C]21[/C][C]-0.106534[/C][C]-0.7304[/C][C]0.234397[/C][/ROW]
[ROW][C]22[/C][C]-0.168496[/C][C]-1.1551[/C][C]0.126934[/C][/ROW]
[ROW][C]23[/C][C]0.354399[/C][C]2.4296[/C][C]0.009494[/C][/ROW]
[ROW][C]24[/C][C]-0.328202[/C][C]-2.25[/C][C]0.014584[/C][/ROW]
[ROW][C]25[/C][C]0.156074[/C][C]1.07[/C][C]0.145044[/C][/ROW]
[ROW][C]26[/C][C]0.080992[/C][C]0.5553[/C][C]0.290678[/C][/ROW]
[ROW][C]27[/C][C]-0.170063[/C][C]-1.1659[/C][C]0.124771[/C][/ROW]
[ROW][C]28[/C][C]0.118551[/C][C]0.8127[/C][C]0.210231[/C][/ROW]
[ROW][C]29[/C][C]0.027588[/C][C]0.1891[/C][C]0.4254[/C][/ROW]
[ROW][C]30[/C][C]-0.153856[/C][C]-1.0548[/C][C]0.148459[/C][/ROW]
[ROW][C]31[/C][C]0.190265[/C][C]1.3044[/C][C]0.099226[/C][/ROW]
[ROW][C]32[/C][C]-0.151262[/C][C]-1.037[/C][C]0.152521[/C][/ROW]
[ROW][C]33[/C][C]0.021216[/C][C]0.1455[/C][C]0.442488[/C][/ROW]
[ROW][C]34[/C][C]0.101693[/C][C]0.6972[/C][C]0.244566[/C][/ROW]
[ROW][C]35[/C][C]-0.14615[/C][C]-1.002[/C][C]0.160748[/C][/ROW]
[ROW][C]36[/C][C]0.052247[/C][C]0.3582[/C][C]0.360903[/C][/ROW]
[/TABLE]
Source: https://freestatistics.org/blog/index.php?pk=63891&T=1

Globally Unique Identifier (entire table): ba.freestatistics.org/blog/index.php?pk=63891&T=1

As an alternative you can also use a QR Code:  

The GUIDs for individual cells are displayed in the table below:

Autocorrelation Function
Time lag kACF(k)T-STATP-value
1-0.526774-3.61140.000369
20.0736290.50480.308038
30.3582582.45610.008898
4-0.375776-2.57620.006596
50.1545241.05940.147424
60.1813291.24310.109993
7-0.435369-2.98470.002247
80.305712.09580.020754
9-0.177253-1.21520.115183
10-0.12346-0.84640.200809
110.1823011.24980.108782
12-0.14876-1.01980.156511
13-0.010213-0.070.472238
140.0862520.59130.278573
15-0.008666-0.05940.476438
16-0.099631-0.6830.24897
170.1248390.85580.198212
18-0.075144-0.51520.304428
19-0.052544-0.36020.360146
200.1694581.16170.125602
21-0.106534-0.73040.234397
22-0.168496-1.15510.126934
230.3543992.42960.009494
24-0.328202-2.250.014584
250.1560741.070.145044
260.0809920.55530.290678
27-0.170063-1.16590.124771
280.1185510.81270.210231
290.0275880.18910.4254
30-0.153856-1.05480.148459
310.1902651.30440.099226
32-0.151262-1.0370.152521
330.0212160.14550.442488
340.1016930.69720.244566
35-0.14615-1.0020.160748
360.0522470.35820.360903


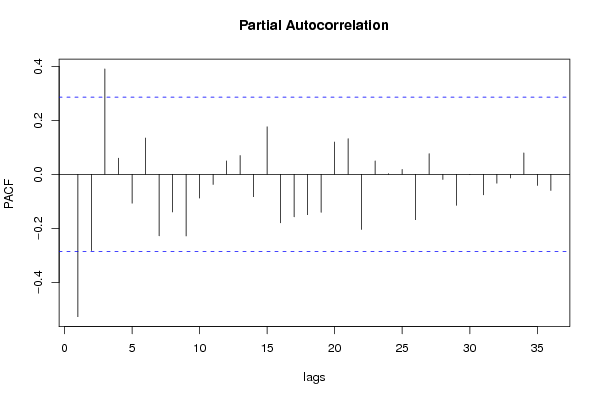
Partial Autocorrelation Function
Time lag kPACF(k)T-STATP-value
1-0.526774-3.61140.000369
2-0.282158-1.93440.02955
30.3900142.67380.005141
40.0595880.40850.342375
5-0.107063-0.7340.233301
60.1340590.91910.181378
7-0.227681-1.56090.062628
8-0.139168-0.95410.17246
9-0.228049-1.56340.062331
10-0.0877-0.60120.275285
11-0.037245-0.25530.399788
120.0497340.3410.367327
130.0695870.47710.317763
14-0.082713-0.56710.286689
150.175731.20470.117166
16-0.179673-1.23180.11208
17-0.157088-1.07690.143502
18-0.149531-1.02510.155274
19-0.14061-0.9640.169996
200.1195310.81950.20833
210.1318370.90380.185349
22-0.203993-1.39850.084263
230.0495990.340.367673
240.0022890.01570.493773
250.0182670.12520.450436
26-0.167758-1.15010.127962
270.0763030.52310.301678
28-0.018866-0.12930.44882
29-0.11462-0.78580.217967
30-0.000873-0.0060.497625
31-0.075772-0.51950.302937
32-0.032826-0.2250.411461
33-0.013178-0.09030.464198
340.0791410.54260.294997
35-0.040968-0.28090.390026
36-0.05957-0.40840.34242

\begin{tabular}{lllllllll}
\hline
Partial Autocorrelation Function \tabularnewline
Time lag k & PACF(k) & T-STAT & P-value \tabularnewline
1 & -0.526774 & -3.6114 & 0.000369 \tabularnewline
2 & -0.282158 & -1.9344 & 0.02955 \tabularnewline
3 & 0.390014 & 2.6738 & 0.005141 \tabularnewline
4 & 0.059588 & 0.4085 & 0.342375 \tabularnewline
5 & -0.107063 & -0.734 & 0.233301 \tabularnewline
6 & 0.134059 & 0.9191 & 0.181378 \tabularnewline
7 & -0.227681 & -1.5609 & 0.062628 \tabularnewline
8 & -0.139168 & -0.9541 & 0.17246 \tabularnewline
9 & -0.228049 & -1.5634 & 0.062331 \tabularnewline
10 & -0.0877 & -0.6012 & 0.275285 \tabularnewline
11 & -0.037245 & -0.2553 & 0.399788 \tabularnewline
12 & 0.049734 & 0.341 & 0.367327 \tabularnewline
13 & 0.069587 & 0.4771 & 0.317763 \tabularnewline
14 & -0.082713 & -0.5671 & 0.286689 \tabularnewline
15 & 0.17573 & 1.2047 & 0.117166 \tabularnewline
16 & -0.179673 & -1.2318 & 0.11208 \tabularnewline
17 & -0.157088 & -1.0769 & 0.143502 \tabularnewline
18 & -0.149531 & -1.0251 & 0.155274 \tabularnewline
19 & -0.14061 & -0.964 & 0.169996 \tabularnewline
20 & 0.119531 & 0.8195 & 0.20833 \tabularnewline
21 & 0.131837 & 0.9038 & 0.185349 \tabularnewline
22 & -0.203993 & -1.3985 & 0.084263 \tabularnewline
23 & 0.049599 & 0.34 & 0.367673 \tabularnewline
24 & 0.002289 & 0.0157 & 0.493773 \tabularnewline
25 & 0.018267 & 0.1252 & 0.450436 \tabularnewline
26 & -0.167758 & -1.1501 & 0.127962 \tabularnewline
27 & 0.076303 & 0.5231 & 0.301678 \tabularnewline
28 & -0.018866 & -0.1293 & 0.44882 \tabularnewline
29 & -0.11462 & -0.7858 & 0.217967 \tabularnewline
30 & -0.000873 & -0.006 & 0.497625 \tabularnewline
31 & -0.075772 & -0.5195 & 0.302937 \tabularnewline
32 & -0.032826 & -0.225 & 0.411461 \tabularnewline
33 & -0.013178 & -0.0903 & 0.464198 \tabularnewline
34 & 0.079141 & 0.5426 & 0.294997 \tabularnewline
35 & -0.040968 & -0.2809 & 0.390026 \tabularnewline
36 & -0.05957 & -0.4084 & 0.34242 \tabularnewline
\hline
\end{tabular}
%Source: https://freestatistics.org/blog/index.php?pk=63891&T=2

[TABLE]
[ROW][C]Partial Autocorrelation Function[/C][/ROW]
[ROW][C]Time lag k[/C][C]PACF(k)[/C][C]T-STAT[/C][C]P-value[/C][/ROW]
[ROW][C]1[/C][C]-0.526774[/C][C]-3.6114[/C][C]0.000369[/C][/ROW]
[ROW][C]2[/C][C]-0.282158[/C][C]-1.9344[/C][C]0.02955[/C][/ROW]
[ROW][C]3[/C][C]0.390014[/C][C]2.6738[/C][C]0.005141[/C][/ROW]
[ROW][C]4[/C][C]0.059588[/C][C]0.4085[/C][C]0.342375[/C][/ROW]
[ROW][C]5[/C][C]-0.107063[/C][C]-0.734[/C][C]0.233301[/C][/ROW]
[ROW][C]6[/C][C]0.134059[/C][C]0.9191[/C][C]0.181378[/C][/ROW]
[ROW][C]7[/C][C]-0.227681[/C][C]-1.5609[/C][C]0.062628[/C][/ROW]
[ROW][C]8[/C][C]-0.139168[/C][C]-0.9541[/C][C]0.17246[/C][/ROW]
[ROW][C]9[/C][C]-0.228049[/C][C]-1.5634[/C][C]0.062331[/C][/ROW]
[ROW][C]10[/C][C]-0.0877[/C][C]-0.6012[/C][C]0.275285[/C][/ROW]
[ROW][C]11[/C][C]-0.037245[/C][C]-0.2553[/C][C]0.399788[/C][/ROW]
[ROW][C]12[/C][C]0.049734[/C][C]0.341[/C][C]0.367327[/C][/ROW]
[ROW][C]13[/C][C]0.069587[/C][C]0.4771[/C][C]0.317763[/C][/ROW]
[ROW][C]14[/C][C]-0.082713[/C][C]-0.5671[/C][C]0.286689[/C][/ROW]
[ROW][C]15[/C][C]0.17573[/C][C]1.2047[/C][C]0.117166[/C][/ROW]
[ROW][C]16[/C][C]-0.179673[/C][C]-1.2318[/C][C]0.11208[/C][/ROW]
[ROW][C]17[/C][C]-0.157088[/C][C]-1.0769[/C][C]0.143502[/C][/ROW]
[ROW][C]18[/C][C]-0.149531[/C][C]-1.0251[/C][C]0.155274[/C][/ROW]
[ROW][C]19[/C][C]-0.14061[/C][C]-0.964[/C][C]0.169996[/C][/ROW]
[ROW][C]20[/C][C]0.119531[/C][C]0.8195[/C][C]0.20833[/C][/ROW]
[ROW][C]21[/C][C]0.131837[/C][C]0.9038[/C][C]0.185349[/C][/ROW]
[ROW][C]22[/C][C]-0.203993[/C][C]-1.3985[/C][C]0.084263[/C][/ROW]
[ROW][C]23[/C][C]0.049599[/C][C]0.34[/C][C]0.367673[/C][/ROW]
[ROW][C]24[/C][C]0.002289[/C][C]0.0157[/C][C]0.493773[/C][/ROW]
[ROW][C]25[/C][C]0.018267[/C][C]0.1252[/C][C]0.450436[/C][/ROW]
[ROW][C]26[/C][C]-0.167758[/C][C]-1.1501[/C][C]0.127962[/C][/ROW]
[ROW][C]27[/C][C]0.076303[/C][C]0.5231[/C][C]0.301678[/C][/ROW]
[ROW][C]28[/C][C]-0.018866[/C][C]-0.1293[/C][C]0.44882[/C][/ROW]
[ROW][C]29[/C][C]-0.11462[/C][C]-0.7858[/C][C]0.217967[/C][/ROW]
[ROW][C]30[/C][C]-0.000873[/C][C]-0.006[/C][C]0.497625[/C][/ROW]
[ROW][C]31[/C][C]-0.075772[/C][C]-0.5195[/C][C]0.302937[/C][/ROW]
[ROW][C]32[/C][C]-0.032826[/C][C]-0.225[/C][C]0.411461[/C][/ROW]
[ROW][C]33[/C][C]-0.013178[/C][C]-0.0903[/C][C]0.464198[/C][/ROW]
[ROW][C]34[/C][C]0.079141[/C][C]0.5426[/C][C]0.294997[/C][/ROW]
[ROW][C]35[/C][C]-0.040968[/C][C]-0.2809[/C][C]0.390026[/C][/ROW]
[ROW][C]36[/C][C]-0.05957[/C][C]-0.4084[/C][C]0.34242[/C][/ROW]
[/TABLE]
Source: https://freestatistics.org/blog/index.php?pk=63891&T=2

Globally Unique Identifier (entire table): ba.freestatistics.org/blog/index.php?pk=63891&T=2

As an alternative you can also use a QR Code:  

The GUIDs for individual cells are displayed in the table below:

Partial Autocorrelation Function
Time lag kPACF(k)T-STATP-value
1-0.526774-3.61140.000369
2-0.282158-1.93440.02955
30.3900142.67380.005141
40.0595880.40850.342375
5-0.107063-0.7340.233301
60.1340590.91910.181378
7-0.227681-1.56090.062628
8-0.139168-0.95410.17246
9-0.228049-1.56340.062331
10-0.0877-0.60120.275285
11-0.037245-0.25530.399788
120.0497340.3410.367327
130.0695870.47710.317763
14-0.082713-0.56710.286689
150.175731.20470.117166
16-0.179673-1.23180.11208
17-0.157088-1.07690.143502
18-0.149531-1.02510.155274
19-0.14061-0.9640.169996
200.1195310.81950.20833
210.1318370.90380.185349
22-0.203993-1.39850.084263
230.0495990.340.367673
240.0022890.01570.493773
250.0182670.12520.450436
26-0.167758-1.15010.127962
270.0763030.52310.301678
28-0.018866-0.12930.44882
29-0.11462-0.78580.217967
30-0.000873-0.0060.497625
31-0.075772-0.51950.302937
32-0.032826-0.2250.411461
33-0.013178-0.09030.464198
340.0791410.54260.294997
35-0.040968-0.28090.390026
36-0.05957-0.40840.34242


Parameters (Session):
par1 = 36 ; par2 = 0.4 ; par3 = 1 ; par4 = 1 ; par5 = 12 ; par6 = White Noise ; par7 = 0.95 ;
Parameters (R input):
par1 = 36 ; par2 = 0.4 ; par3 = 1 ; par4 = 1 ; par5 = 12 ; par6 = White Noise ; par7 = 0.95 ;
R code (references can be found in the software module):
if (par1 == 'Default') {
par1 = 10*log10(length(x))
} else {
par1 <- as.numeric(par1)
}
par2 <- as.numeric(par2)
par3 <- as.numeric(par3)
par4 <- as.numeric(par4)
par5 <- as.numeric(par5)
if (par6 == 'White Noise') par6 <- 'white' else par6 <- 'ma'
par7 <- as.numeric(par7)
if (par2 == 0) {
x <- log(x)
} else {
x <- (x ^ par2 - 1) / par2
}
if (par3 > 0) x <- diff(x,lag=1,difference=par3)
if (par4 > 0) x <- diff(x,lag=par5,difference=par4)
bitmap(file='pic1.png')
racf <- acf(x, par1, main='Autocorrelation', xlab='time lag', ylab='ACF', ci.type=par6, ci=par7, sub=paste('(lambda=',par2,', d=',par3,', D=',par4,', CI=', par7, ', CI type=',par6,')',sep=''))
dev.off()
bitmap(file='pic2.png')
rpacf <- pacf(x,par1,main='Partial Autocorrelation',xlab='lags',ylab='PACF')
dev.off()
(myacf <- c(racf$acf))
(mypacf <- c(rpacf$acf))
lengthx <- length(x)
sqrtn <- sqrt(lengthx)
load(file='createtable')
a<-table.start()
a<-table.row.start(a)
a<-table.element(a,'Autocorrelation Function',4,TRUE)
a<-table.row.end(a)
a<-table.row.start(a)
a<-table.element(a,'Time lag k',header=TRUE)
a<-table.element(a,hyperlink('basics.htm','ACF(k)','click here for more information about the Autocorrelation Function'),header=TRUE)
a<-table.element(a,'T-STAT',header=TRUE)
a<-table.element(a,'P-value',header=TRUE)
a<-table.row.end(a)
for (i in 2:(par1+1)) {
a<-table.row.start(a)
a<-table.element(a,i-1,header=TRUE)
a<-table.element(a,round(myacf[i],6))
mytstat <- myacf[i]*sqrtn
a<-table.element(a,round(mytstat,4))
a<-table.element(a,round(1-pt(abs(mytstat),lengthx),6))
a<-table.row.end(a)
}
a<-table.end(a)
table.save(a,file='mytable.tab')
a<-table.start()
a<-table.row.start(a)
a<-table.element(a,'Partial Autocorrelation Function',4,TRUE)
a<-table.row.end(a)
a<-table.row.start(a)
a<-table.element(a,'Time lag k',header=TRUE)
a<-table.element(a,hyperlink('basics.htm','PACF(k)','click here for more information about the Partial Autocorrelation Function'),header=TRUE)
a<-table.element(a,'T-STAT',header=TRUE)
a<-table.element(a,'P-value',header=TRUE)
a<-table.row.end(a)
for (i in 1:par1) {
a<-table.row.start(a)
a<-table.element(a,i,header=TRUE)
a<-table.element(a,round(mypacf[i],6))
mytstat <- mypacf[i]*sqrtn
a<-table.element(a,round(mytstat,4))
a<-table.element(a,round(1-pt(abs(mytstat),lengthx),6))
a<-table.row.end(a)
}
a<-table.end(a)
table.save(a,file='mytable1.tab')