Free Statistics

of Irreproducible Research!

Author's title

Author*The author of this computation has been verified*
R Software Modulerwasp_autocorrelation.wasp
Title produced by software(Partial) Autocorrelation Function
Date of computationFri, 04 Dec 2009 09:59:34 -0700
Cite this page as followsStatistical Computations at FreeStatistics.org, Office for Research Development and Education, URL https://freestatistics.org/blog/index.php?v=date/2009/Dec/04/t1259946070i38o482r5tzkm7t.htm/, Retrieved Sun, 28 Apr 2024 16:52:24 +0000
Statistical Computations at FreeStatistics.org, Office for Research Development and Education, URL https://freestatistics.org/blog/index.php?pk=63905, Retrieved Sun, 28 Apr 2024 16:52:24 +0000
QR Codes:

Original text written by user:
IsPrivate?No (this computation is public)
User-defined keywords
Estimated Impact91
Family? (F = Feedback message, R = changed R code, M = changed R Module, P = changed Parameters, D = changed Data)
-     [Univariate Data Series] [data set] [2008-12-01 19:54:57] [b98453cac15ba1066b407e146608df68]
- RMP   [(Partial) Autocorrelation Function] [] [2009-11-27 14:46:03] [b98453cac15ba1066b407e146608df68]
-   PD      [(Partial) Autocorrelation Function] [Stap 1 Workshop 5] [2009-12-04 16:59:34] [865cd78857e928bd6e7d79509c6cdcc5] [Current]
Feedback Forum

Post a new message
Dataseries X:
109.1
49.1
92.9
107.7
103.5
91.1
79.8
71.9
82.9
90.1
100.7
90.7
108.8
44.1
93.6
107.4
96.5
93.6
76.5
76.7
84
103.3
88.5
99
105.9
44.7
94
107.1
104.8
102.5
77.7
85.2
91.3
106.5
92.4
97.5
107
51.1
98.6
102.2
114.3
99.4
72.5
92.3
99.4
85.9
109.4
97.6
104.7
56.9
86.7
108.5
103.4
86.2
71
75.9
87.1
102
88.5
87.8
100.8


Summary of computational transaction
Raw Inputview raw input (R code)
Raw Outputview raw output of R engine
Computing time2 seconds
R Server'Gwilym Jenkins' @ 72.249.127.135

\begin{tabular}{lllllllll}
\hline
Summary of computational transaction \tabularnewline
Raw Input & view raw input (R code)  \tabularnewline
Raw Output & view raw output of R engine  \tabularnewline
Computing time & 2 seconds \tabularnewline
R Server & 'Gwilym Jenkins' @ 72.249.127.135 \tabularnewline
\hline
\end{tabular}
%Source: https://freestatistics.org/blog/index.php?pk=63905&T=0

[TABLE]
[ROW][C]Summary of computational transaction[/C][/ROW]
[ROW][C]Raw Input[/C][C]view raw input (R code) [/C][/ROW]
[ROW][C]Raw Output[/C][C]view raw output of R engine [/C][/ROW]
[ROW][C]Computing time[/C][C]2 seconds[/C][/ROW]
[ROW][C]R Server[/C][C]'Gwilym Jenkins' @ 72.249.127.135[/C][/ROW]
[/TABLE]
Source: https://freestatistics.org/blog/index.php?pk=63905&T=0

Globally Unique Identifier (entire table): ba.freestatistics.org/blog/index.php?pk=63905&T=0

As an alternative you can also use a QR Code:  

The GUIDs for individual cells are displayed in the table below:

Summary of computational transaction
Raw Inputview raw input (R code)
Raw Outputview raw output of R engine
Computing time2 seconds
R Server'Gwilym Jenkins' @ 72.249.127.135


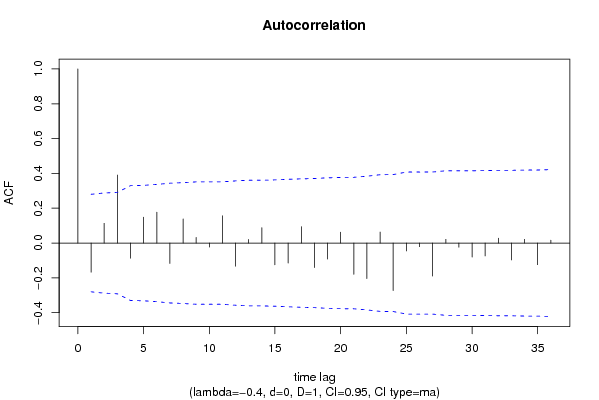
Autocorrelation Function
Time lag kACF(k)T-STATP-value
1-0.167372-1.17160.123511
20.1135010.79450.215365
30.3907992.73560.004323
4-0.086856-0.6080.273
50.1486551.04060.151587
60.177421.24190.110085
7-0.117137-0.820.208104
80.1388860.97220.167863
90.0323990.22680.410764
10-0.022933-0.16050.43656
110.1565161.09560.139302
12-0.132702-0.92890.178744
130.0210330.14720.441778
140.0885770.620.269052
15-0.125011-0.87510.1929
16-0.115166-0.80620.212022
170.0942160.65950.256328
18-0.140662-0.98460.16482
19-0.091758-0.64230.261834
200.0627840.43950.331121
21-0.179137-1.2540.107903
22-0.203574-1.4250.080245
230.0629510.44070.3307
24-0.272588-1.90810.031122
25-0.04494-0.31460.377207
26-0.02064-0.14450.442856
27-0.189825-1.32880.095039
280.0213190.14920.440991
29-0.02384-0.16690.434075
30-0.080206-0.56140.288528
31-0.073756-0.51630.303987
320.0279460.19560.422856
33-0.096728-0.67710.250764
340.0214520.15020.440627
35-0.124167-0.86920.194496
360.0167380.11720.453602

\begin{tabular}{lllllllll}
\hline
Autocorrelation Function \tabularnewline
Time lag k & ACF(k) & T-STAT & P-value \tabularnewline
1 & -0.167372 & -1.1716 & 0.123511 \tabularnewline
2 & 0.113501 & 0.7945 & 0.215365 \tabularnewline
3 & 0.390799 & 2.7356 & 0.004323 \tabularnewline
4 & -0.086856 & -0.608 & 0.273 \tabularnewline
5 & 0.148655 & 1.0406 & 0.151587 \tabularnewline
6 & 0.17742 & 1.2419 & 0.110085 \tabularnewline
7 & -0.117137 & -0.82 & 0.208104 \tabularnewline
8 & 0.138886 & 0.9722 & 0.167863 \tabularnewline
9 & 0.032399 & 0.2268 & 0.410764 \tabularnewline
10 & -0.022933 & -0.1605 & 0.43656 \tabularnewline
11 & 0.156516 & 1.0956 & 0.139302 \tabularnewline
12 & -0.132702 & -0.9289 & 0.178744 \tabularnewline
13 & 0.021033 & 0.1472 & 0.441778 \tabularnewline
14 & 0.088577 & 0.62 & 0.269052 \tabularnewline
15 & -0.125011 & -0.8751 & 0.1929 \tabularnewline
16 & -0.115166 & -0.8062 & 0.212022 \tabularnewline
17 & 0.094216 & 0.6595 & 0.256328 \tabularnewline
18 & -0.140662 & -0.9846 & 0.16482 \tabularnewline
19 & -0.091758 & -0.6423 & 0.261834 \tabularnewline
20 & 0.062784 & 0.4395 & 0.331121 \tabularnewline
21 & -0.179137 & -1.254 & 0.107903 \tabularnewline
22 & -0.203574 & -1.425 & 0.080245 \tabularnewline
23 & 0.062951 & 0.4407 & 0.3307 \tabularnewline
24 & -0.272588 & -1.9081 & 0.031122 \tabularnewline
25 & -0.04494 & -0.3146 & 0.377207 \tabularnewline
26 & -0.02064 & -0.1445 & 0.442856 \tabularnewline
27 & -0.189825 & -1.3288 & 0.095039 \tabularnewline
28 & 0.021319 & 0.1492 & 0.440991 \tabularnewline
29 & -0.02384 & -0.1669 & 0.434075 \tabularnewline
30 & -0.080206 & -0.5614 & 0.288528 \tabularnewline
31 & -0.073756 & -0.5163 & 0.303987 \tabularnewline
32 & 0.027946 & 0.1956 & 0.422856 \tabularnewline
33 & -0.096728 & -0.6771 & 0.250764 \tabularnewline
34 & 0.021452 & 0.1502 & 0.440627 \tabularnewline
35 & -0.124167 & -0.8692 & 0.194496 \tabularnewline
36 & 0.016738 & 0.1172 & 0.453602 \tabularnewline
\hline
\end{tabular}
%Source: https://freestatistics.org/blog/index.php?pk=63905&T=1

[TABLE]
[ROW][C]Autocorrelation Function[/C][/ROW]
[ROW][C]Time lag k[/C][C]ACF(k)[/C][C]T-STAT[/C][C]P-value[/C][/ROW]
[ROW][C]1[/C][C]-0.167372[/C][C]-1.1716[/C][C]0.123511[/C][/ROW]
[ROW][C]2[/C][C]0.113501[/C][C]0.7945[/C][C]0.215365[/C][/ROW]
[ROW][C]3[/C][C]0.390799[/C][C]2.7356[/C][C]0.004323[/C][/ROW]
[ROW][C]4[/C][C]-0.086856[/C][C]-0.608[/C][C]0.273[/C][/ROW]
[ROW][C]5[/C][C]0.148655[/C][C]1.0406[/C][C]0.151587[/C][/ROW]
[ROW][C]6[/C][C]0.17742[/C][C]1.2419[/C][C]0.110085[/C][/ROW]
[ROW][C]7[/C][C]-0.117137[/C][C]-0.82[/C][C]0.208104[/C][/ROW]
[ROW][C]8[/C][C]0.138886[/C][C]0.9722[/C][C]0.167863[/C][/ROW]
[ROW][C]9[/C][C]0.032399[/C][C]0.2268[/C][C]0.410764[/C][/ROW]
[ROW][C]10[/C][C]-0.022933[/C][C]-0.1605[/C][C]0.43656[/C][/ROW]
[ROW][C]11[/C][C]0.156516[/C][C]1.0956[/C][C]0.139302[/C][/ROW]
[ROW][C]12[/C][C]-0.132702[/C][C]-0.9289[/C][C]0.178744[/C][/ROW]
[ROW][C]13[/C][C]0.021033[/C][C]0.1472[/C][C]0.441778[/C][/ROW]
[ROW][C]14[/C][C]0.088577[/C][C]0.62[/C][C]0.269052[/C][/ROW]
[ROW][C]15[/C][C]-0.125011[/C][C]-0.8751[/C][C]0.1929[/C][/ROW]
[ROW][C]16[/C][C]-0.115166[/C][C]-0.8062[/C][C]0.212022[/C][/ROW]
[ROW][C]17[/C][C]0.094216[/C][C]0.6595[/C][C]0.256328[/C][/ROW]
[ROW][C]18[/C][C]-0.140662[/C][C]-0.9846[/C][C]0.16482[/C][/ROW]
[ROW][C]19[/C][C]-0.091758[/C][C]-0.6423[/C][C]0.261834[/C][/ROW]
[ROW][C]20[/C][C]0.062784[/C][C]0.4395[/C][C]0.331121[/C][/ROW]
[ROW][C]21[/C][C]-0.179137[/C][C]-1.254[/C][C]0.107903[/C][/ROW]
[ROW][C]22[/C][C]-0.203574[/C][C]-1.425[/C][C]0.080245[/C][/ROW]
[ROW][C]23[/C][C]0.062951[/C][C]0.4407[/C][C]0.3307[/C][/ROW]
[ROW][C]24[/C][C]-0.272588[/C][C]-1.9081[/C][C]0.031122[/C][/ROW]
[ROW][C]25[/C][C]-0.04494[/C][C]-0.3146[/C][C]0.377207[/C][/ROW]
[ROW][C]26[/C][C]-0.02064[/C][C]-0.1445[/C][C]0.442856[/C][/ROW]
[ROW][C]27[/C][C]-0.189825[/C][C]-1.3288[/C][C]0.095039[/C][/ROW]
[ROW][C]28[/C][C]0.021319[/C][C]0.1492[/C][C]0.440991[/C][/ROW]
[ROW][C]29[/C][C]-0.02384[/C][C]-0.1669[/C][C]0.434075[/C][/ROW]
[ROW][C]30[/C][C]-0.080206[/C][C]-0.5614[/C][C]0.288528[/C][/ROW]
[ROW][C]31[/C][C]-0.073756[/C][C]-0.5163[/C][C]0.303987[/C][/ROW]
[ROW][C]32[/C][C]0.027946[/C][C]0.1956[/C][C]0.422856[/C][/ROW]
[ROW][C]33[/C][C]-0.096728[/C][C]-0.6771[/C][C]0.250764[/C][/ROW]
[ROW][C]34[/C][C]0.021452[/C][C]0.1502[/C][C]0.440627[/C][/ROW]
[ROW][C]35[/C][C]-0.124167[/C][C]-0.8692[/C][C]0.194496[/C][/ROW]
[ROW][C]36[/C][C]0.016738[/C][C]0.1172[/C][C]0.453602[/C][/ROW]
[/TABLE]
Source: https://freestatistics.org/blog/index.php?pk=63905&T=1

Globally Unique Identifier (entire table): ba.freestatistics.org/blog/index.php?pk=63905&T=1

As an alternative you can also use a QR Code:  

The GUIDs for individual cells are displayed in the table below:

Autocorrelation Function
Time lag kACF(k)T-STATP-value
1-0.167372-1.17160.123511
20.1135010.79450.215365
30.3907992.73560.004323
4-0.086856-0.6080.273
50.1486551.04060.151587
60.177421.24190.110085
7-0.117137-0.820.208104
80.1388860.97220.167863
90.0323990.22680.410764
10-0.022933-0.16050.43656
110.1565161.09560.139302
12-0.132702-0.92890.178744
130.0210330.14720.441778
140.0885770.620.269052
15-0.125011-0.87510.1929
16-0.115166-0.80620.212022
170.0942160.65950.256328
18-0.140662-0.98460.16482
19-0.091758-0.64230.261834
200.0627840.43950.331121
21-0.179137-1.2540.107903
22-0.203574-1.4250.080245
230.0629510.44070.3307
24-0.272588-1.90810.031122
25-0.04494-0.31460.377207
26-0.02064-0.14450.442856
27-0.189825-1.32880.095039
280.0213190.14920.440991
29-0.02384-0.16690.434075
30-0.080206-0.56140.288528
31-0.073756-0.51630.303987
320.0279460.19560.422856
33-0.096728-0.67710.250764
340.0214520.15020.440627
35-0.124167-0.86920.194496
360.0167380.11720.453602


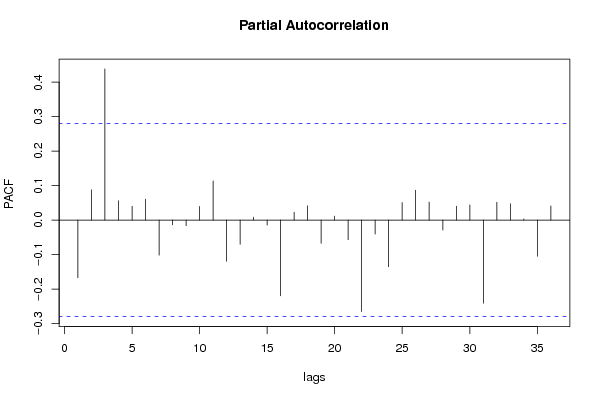
Partial Autocorrelation Function
Time lag kPACF(k)T-STATP-value
1-0.167372-1.17160.123511
20.0879520.61570.270483
30.4384243.0690.001748
40.0560530.39240.348242
50.0401520.28110.389923
60.0607550.42530.336245
7-0.101573-0.7110.240225
8-0.013744-0.09620.461875
9-0.016075-0.11250.455434
100.0395770.2770.391459
110.1135420.79480.215283
12-0.1193-0.83510.203858
13-0.07003-0.49020.313087
140.0084570.05920.476518
15-0.014402-0.10080.460056
16-0.219418-1.53590.065495
170.0231310.16190.436018
180.0415050.29050.386316
19-0.067209-0.47050.320055
200.0115770.0810.467872
21-0.056874-0.39810.346135
22-0.264724-1.85310.03495
23-0.040533-0.28370.388906
24-0.135025-0.94520.174604
250.0510910.35760.361075
260.0869260.60850.27284
270.0525260.36770.357347
28-0.02897-0.20280.420068
290.0405010.28350.38899
300.0438470.30690.3801
31-0.240892-1.68620.049054
320.052040.36430.358609
330.0471610.33010.371357
340.0035830.02510.490046
35-0.104703-0.73290.233549
360.0412470.28870.387002

\begin{tabular}{lllllllll}
\hline
Partial Autocorrelation Function \tabularnewline
Time lag k & PACF(k) & T-STAT & P-value \tabularnewline
1 & -0.167372 & -1.1716 & 0.123511 \tabularnewline
2 & 0.087952 & 0.6157 & 0.270483 \tabularnewline
3 & 0.438424 & 3.069 & 0.001748 \tabularnewline
4 & 0.056053 & 0.3924 & 0.348242 \tabularnewline
5 & 0.040152 & 0.2811 & 0.389923 \tabularnewline
6 & 0.060755 & 0.4253 & 0.336245 \tabularnewline
7 & -0.101573 & -0.711 & 0.240225 \tabularnewline
8 & -0.013744 & -0.0962 & 0.461875 \tabularnewline
9 & -0.016075 & -0.1125 & 0.455434 \tabularnewline
10 & 0.039577 & 0.277 & 0.391459 \tabularnewline
11 & 0.113542 & 0.7948 & 0.215283 \tabularnewline
12 & -0.1193 & -0.8351 & 0.203858 \tabularnewline
13 & -0.07003 & -0.4902 & 0.313087 \tabularnewline
14 & 0.008457 & 0.0592 & 0.476518 \tabularnewline
15 & -0.014402 & -0.1008 & 0.460056 \tabularnewline
16 & -0.219418 & -1.5359 & 0.065495 \tabularnewline
17 & 0.023131 & 0.1619 & 0.436018 \tabularnewline
18 & 0.041505 & 0.2905 & 0.386316 \tabularnewline
19 & -0.067209 & -0.4705 & 0.320055 \tabularnewline
20 & 0.011577 & 0.081 & 0.467872 \tabularnewline
21 & -0.056874 & -0.3981 & 0.346135 \tabularnewline
22 & -0.264724 & -1.8531 & 0.03495 \tabularnewline
23 & -0.040533 & -0.2837 & 0.388906 \tabularnewline
24 & -0.135025 & -0.9452 & 0.174604 \tabularnewline
25 & 0.051091 & 0.3576 & 0.361075 \tabularnewline
26 & 0.086926 & 0.6085 & 0.27284 \tabularnewline
27 & 0.052526 & 0.3677 & 0.357347 \tabularnewline
28 & -0.02897 & -0.2028 & 0.420068 \tabularnewline
29 & 0.040501 & 0.2835 & 0.38899 \tabularnewline
30 & 0.043847 & 0.3069 & 0.3801 \tabularnewline
31 & -0.240892 & -1.6862 & 0.049054 \tabularnewline
32 & 0.05204 & 0.3643 & 0.358609 \tabularnewline
33 & 0.047161 & 0.3301 & 0.371357 \tabularnewline
34 & 0.003583 & 0.0251 & 0.490046 \tabularnewline
35 & -0.104703 & -0.7329 & 0.233549 \tabularnewline
36 & 0.041247 & 0.2887 & 0.387002 \tabularnewline
\hline
\end{tabular}
%Source: https://freestatistics.org/blog/index.php?pk=63905&T=2

[TABLE]
[ROW][C]Partial Autocorrelation Function[/C][/ROW]
[ROW][C]Time lag k[/C][C]PACF(k)[/C][C]T-STAT[/C][C]P-value[/C][/ROW]
[ROW][C]1[/C][C]-0.167372[/C][C]-1.1716[/C][C]0.123511[/C][/ROW]
[ROW][C]2[/C][C]0.087952[/C][C]0.6157[/C][C]0.270483[/C][/ROW]
[ROW][C]3[/C][C]0.438424[/C][C]3.069[/C][C]0.001748[/C][/ROW]
[ROW][C]4[/C][C]0.056053[/C][C]0.3924[/C][C]0.348242[/C][/ROW]
[ROW][C]5[/C][C]0.040152[/C][C]0.2811[/C][C]0.389923[/C][/ROW]
[ROW][C]6[/C][C]0.060755[/C][C]0.4253[/C][C]0.336245[/C][/ROW]
[ROW][C]7[/C][C]-0.101573[/C][C]-0.711[/C][C]0.240225[/C][/ROW]
[ROW][C]8[/C][C]-0.013744[/C][C]-0.0962[/C][C]0.461875[/C][/ROW]
[ROW][C]9[/C][C]-0.016075[/C][C]-0.1125[/C][C]0.455434[/C][/ROW]
[ROW][C]10[/C][C]0.039577[/C][C]0.277[/C][C]0.391459[/C][/ROW]
[ROW][C]11[/C][C]0.113542[/C][C]0.7948[/C][C]0.215283[/C][/ROW]
[ROW][C]12[/C][C]-0.1193[/C][C]-0.8351[/C][C]0.203858[/C][/ROW]
[ROW][C]13[/C][C]-0.07003[/C][C]-0.4902[/C][C]0.313087[/C][/ROW]
[ROW][C]14[/C][C]0.008457[/C][C]0.0592[/C][C]0.476518[/C][/ROW]
[ROW][C]15[/C][C]-0.014402[/C][C]-0.1008[/C][C]0.460056[/C][/ROW]
[ROW][C]16[/C][C]-0.219418[/C][C]-1.5359[/C][C]0.065495[/C][/ROW]
[ROW][C]17[/C][C]0.023131[/C][C]0.1619[/C][C]0.436018[/C][/ROW]
[ROW][C]18[/C][C]0.041505[/C][C]0.2905[/C][C]0.386316[/C][/ROW]
[ROW][C]19[/C][C]-0.067209[/C][C]-0.4705[/C][C]0.320055[/C][/ROW]
[ROW][C]20[/C][C]0.011577[/C][C]0.081[/C][C]0.467872[/C][/ROW]
[ROW][C]21[/C][C]-0.056874[/C][C]-0.3981[/C][C]0.346135[/C][/ROW]
[ROW][C]22[/C][C]-0.264724[/C][C]-1.8531[/C][C]0.03495[/C][/ROW]
[ROW][C]23[/C][C]-0.040533[/C][C]-0.2837[/C][C]0.388906[/C][/ROW]
[ROW][C]24[/C][C]-0.135025[/C][C]-0.9452[/C][C]0.174604[/C][/ROW]
[ROW][C]25[/C][C]0.051091[/C][C]0.3576[/C][C]0.361075[/C][/ROW]
[ROW][C]26[/C][C]0.086926[/C][C]0.6085[/C][C]0.27284[/C][/ROW]
[ROW][C]27[/C][C]0.052526[/C][C]0.3677[/C][C]0.357347[/C][/ROW]
[ROW][C]28[/C][C]-0.02897[/C][C]-0.2028[/C][C]0.420068[/C][/ROW]
[ROW][C]29[/C][C]0.040501[/C][C]0.2835[/C][C]0.38899[/C][/ROW]
[ROW][C]30[/C][C]0.043847[/C][C]0.3069[/C][C]0.3801[/C][/ROW]
[ROW][C]31[/C][C]-0.240892[/C][C]-1.6862[/C][C]0.049054[/C][/ROW]
[ROW][C]32[/C][C]0.05204[/C][C]0.3643[/C][C]0.358609[/C][/ROW]
[ROW][C]33[/C][C]0.047161[/C][C]0.3301[/C][C]0.371357[/C][/ROW]
[ROW][C]34[/C][C]0.003583[/C][C]0.0251[/C][C]0.490046[/C][/ROW]
[ROW][C]35[/C][C]-0.104703[/C][C]-0.7329[/C][C]0.233549[/C][/ROW]
[ROW][C]36[/C][C]0.041247[/C][C]0.2887[/C][C]0.387002[/C][/ROW]
[/TABLE]
Source: https://freestatistics.org/blog/index.php?pk=63905&T=2

Globally Unique Identifier (entire table): ba.freestatistics.org/blog/index.php?pk=63905&T=2

As an alternative you can also use a QR Code:  

The GUIDs for individual cells are displayed in the table below:

Partial Autocorrelation Function
Time lag kPACF(k)T-STATP-value
1-0.167372-1.17160.123511
20.0879520.61570.270483
30.4384243.0690.001748
40.0560530.39240.348242
50.0401520.28110.389923
60.0607550.42530.336245
7-0.101573-0.7110.240225
8-0.013744-0.09620.461875
9-0.016075-0.11250.455434
100.0395770.2770.391459
110.1135420.79480.215283
12-0.1193-0.83510.203858
13-0.07003-0.49020.313087
140.0084570.05920.476518
15-0.014402-0.10080.460056
16-0.219418-1.53590.065495
170.0231310.16190.436018
180.0415050.29050.386316
19-0.067209-0.47050.320055
200.0115770.0810.467872
21-0.056874-0.39810.346135
22-0.264724-1.85310.03495
23-0.040533-0.28370.388906
24-0.135025-0.94520.174604
250.0510910.35760.361075
260.0869260.60850.27284
270.0525260.36770.357347
28-0.02897-0.20280.420068
290.0405010.28350.38899
300.0438470.30690.3801
31-0.240892-1.68620.049054
320.052040.36430.358609
330.0471610.33010.371357
340.0035830.02510.490046
35-0.104703-0.73290.233549
360.0412470.28870.387002


Parameters (Session):
par1 = 36 ; par2 = -0.4 ; par3 = 0 ; par4 = 1 ; par5 = 12 ; par6 = MA ; par7 = 0.95 ;
Parameters (R input):
par1 = 36 ; par2 = -0.4 ; par3 = 0 ; par4 = 1 ; par5 = 12 ; par6 = MA ; par7 = 0.95 ;
R code (references can be found in the software module):
if (par1 == 'Default') {
par1 = 10*log10(length(x))
} else {
par1 <- as.numeric(par1)
}
par2 <- as.numeric(par2)
par3 <- as.numeric(par3)
par4 <- as.numeric(par4)
par5 <- as.numeric(par5)
if (par6 == 'White Noise') par6 <- 'white' else par6 <- 'ma'
par7 <- as.numeric(par7)
if (par2 == 0) {
x <- log(x)
} else {
x <- (x ^ par2 - 1) / par2
}
if (par3 > 0) x <- diff(x,lag=1,difference=par3)
if (par4 > 0) x <- diff(x,lag=par5,difference=par4)
bitmap(file='pic1.png')
racf <- acf(x, par1, main='Autocorrelation', xlab='time lag', ylab='ACF', ci.type=par6, ci=par7, sub=paste('(lambda=',par2,', d=',par3,', D=',par4,', CI=', par7, ', CI type=',par6,')',sep=''))
dev.off()
bitmap(file='pic2.png')
rpacf <- pacf(x,par1,main='Partial Autocorrelation',xlab='lags',ylab='PACF')
dev.off()
(myacf <- c(racf$acf))
(mypacf <- c(rpacf$acf))
lengthx <- length(x)
sqrtn <- sqrt(lengthx)
load(file='createtable')
a<-table.start()
a<-table.row.start(a)
a<-table.element(a,'Autocorrelation Function',4,TRUE)
a<-table.row.end(a)
a<-table.row.start(a)
a<-table.element(a,'Time lag k',header=TRUE)
a<-table.element(a,hyperlink('basics.htm','ACF(k)','click here for more information about the Autocorrelation Function'),header=TRUE)
a<-table.element(a,'T-STAT',header=TRUE)
a<-table.element(a,'P-value',header=TRUE)
a<-table.row.end(a)
for (i in 2:(par1+1)) {
a<-table.row.start(a)
a<-table.element(a,i-1,header=TRUE)
a<-table.element(a,round(myacf[i],6))
mytstat <- myacf[i]*sqrtn
a<-table.element(a,round(mytstat,4))
a<-table.element(a,round(1-pt(abs(mytstat),lengthx),6))
a<-table.row.end(a)
}
a<-table.end(a)
table.save(a,file='mytable.tab')
a<-table.start()
a<-table.row.start(a)
a<-table.element(a,'Partial Autocorrelation Function',4,TRUE)
a<-table.row.end(a)
a<-table.row.start(a)
a<-table.element(a,'Time lag k',header=TRUE)
a<-table.element(a,hyperlink('basics.htm','PACF(k)','click here for more information about the Partial Autocorrelation Function'),header=TRUE)
a<-table.element(a,'T-STAT',header=TRUE)
a<-table.element(a,'P-value',header=TRUE)
a<-table.row.end(a)
for (i in 1:par1) {
a<-table.row.start(a)
a<-table.element(a,i,header=TRUE)
a<-table.element(a,round(mypacf[i],6))
mytstat <- mypacf[i]*sqrtn
a<-table.element(a,round(mytstat,4))
a<-table.element(a,round(1-pt(abs(mytstat),lengthx),6))
a<-table.row.end(a)
}
a<-table.end(a)
table.save(a,file='mytable1.tab')