Free Statistics

of Irreproducible Research!

Author's title

Author*The author of this computation has been verified*
R Software Modulerwasp_exponentialsmoothing.wasp
Title produced by softwareExponential Smoothing
Date of computationFri, 04 Dec 2009 10:05:43 -0700
Cite this page as followsStatistical Computations at FreeStatistics.org, Office for Research Development and Education, URL https://freestatistics.org/blog/index.php?v=date/2009/Dec/04/t125994699320vgg2y7o8tamz0.htm/, Retrieved Sun, 28 Apr 2024 01:02:13 +0000
Statistical Computations at FreeStatistics.org, Office for Research Development and Education, URL https://freestatistics.org/blog/index.php?pk=63924, Retrieved Sun, 28 Apr 2024 01:02:13 +0000
QR Codes:

Original text written by user:
IsPrivate?No (this computation is public)
User-defined keywords
Estimated Impact79
Family? (F = Feedback message, R = changed R code, M = changed R Module, P = changed Parameters, D = changed Data)
-     [Univariate Data Series] [data set] [2008-12-01 19:54:57] [b98453cac15ba1066b407e146608df68]
- RMP   [Exponential Smoothing] [] [2009-11-27 15:04:36] [b98453cac15ba1066b407e146608df68]
-   PD      [Exponential Smoothing] [Workshop 9: Expon...] [2009-12-04 17:05:43] [3d2053c5f7c50d3c075d87ce0bd87294] [Current]
Feedback Forum

Post a new message
Dataseries X:
267413
267366
264777
258863
254844
254868
277267
285351
286602
283042
276687
277915
277128
277103
275037
270150
267140
264993
287259
291186
292300
288186
281477
282656
280190
280408
276836
275216
274352
271311
289802
290726
292300
278506
269826
265861
269034
264176
255198
253353
246057
235372
258556
260993
254663
250643
243422
247105
248541
245039
237080
237085
225554
226839
247934
248333
246969
245098
246263
255765
264319
268347
273046
273963
267430
271993
292710
295881
293299


Summary of computational transaction
Raw Inputview raw input (R code)
Raw Outputview raw output of R engine
Computing time2 seconds
R Server'Gwilym Jenkins' @ 72.249.127.135

\begin{tabular}{lllllllll}
\hline
Summary of computational transaction \tabularnewline
Raw Input & view raw input (R code)  \tabularnewline
Raw Output & view raw output of R engine  \tabularnewline
Computing time & 2 seconds \tabularnewline
R Server & 'Gwilym Jenkins' @ 72.249.127.135 \tabularnewline
\hline
\end{tabular}
%Source: https://freestatistics.org/blog/index.php?pk=63924&T=0

[TABLE]
[ROW][C]Summary of computational transaction[/C][/ROW]
[ROW][C]Raw Input[/C][C]view raw input (R code) [/C][/ROW]
[ROW][C]Raw Output[/C][C]view raw output of R engine [/C][/ROW]
[ROW][C]Computing time[/C][C]2 seconds[/C][/ROW]
[ROW][C]R Server[/C][C]'Gwilym Jenkins' @ 72.249.127.135[/C][/ROW]
[/TABLE]
Source: https://freestatistics.org/blog/index.php?pk=63924&T=0

Globally Unique Identifier (entire table): ba.freestatistics.org/blog/index.php?pk=63924&T=0

As an alternative you can also use a QR Code:  

The GUIDs for individual cells are displayed in the table below:

Summary of computational transaction
Raw Inputview raw input (R code)
Raw Outputview raw output of R engine
Computing time2 seconds
R Server'Gwilym Jenkins' @ 72.249.127.135


Estimated Parameters of Exponential Smoothing
ParameterValue
alpha0.774271526347364
beta0.47045948557527
gamma1

\begin{tabular}{lllllllll}
\hline
Estimated Parameters of Exponential Smoothing \tabularnewline
Parameter & Value \tabularnewline
alpha & 0.774271526347364 \tabularnewline
beta & 0.47045948557527 \tabularnewline
gamma & 1 \tabularnewline
\hline
\end{tabular}
%Source: https://freestatistics.org/blog/index.php?pk=63924&T=1

[TABLE]
[ROW][C]Estimated Parameters of Exponential Smoothing[/C][/ROW]
[ROW][C]Parameter[/C][C]Value[/C][/ROW]
[ROW][C]alpha[/C][C]0.774271526347364[/C][/ROW]
[ROW][C]beta[/C][C]0.47045948557527[/C][/ROW]
[ROW][C]gamma[/C][C]1[/C][/ROW]
[/TABLE]
Source: https://freestatistics.org/blog/index.php?pk=63924&T=1

Globally Unique Identifier (entire table): ba.freestatistics.org/blog/index.php?pk=63924&T=1

As an alternative you can also use a QR Code:  

The GUIDs for individual cells are displayed in the table below:

Estimated Parameters of Exponential Smoothing
ParameterValue
alpha0.774271526347364
beta0.47045948557527
gamma1


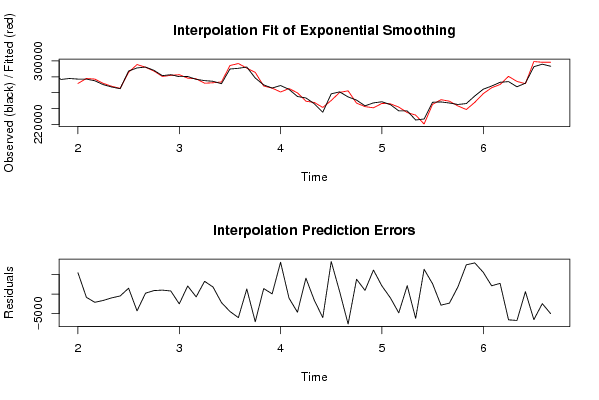
Interpolation Forecasts of Exponential Smoothing
tObservedFittedResiduals
13277128271656.5667843645471.43321563635
14277103277923.353326693-820.353326693468
15275037277134.891202723-2097.89120272303
16270150271770.266416459-1620.26641645859
17267140268095.9041569-955.904156899953
18264993265466.910074723-473.91007472307
19287259285740.0375246291518.96247537120
20291186295483.386907983-4297.38690798311
21292300292056.55094069243.449059309671
22288186287279.12398743906.876012569817
23281477280451.2260525621025.7739474384
24282656281852.952712312803.047287687892
25280190282686.172673556-2496.17267355567
26280408278326.7026178102081.2973821896
27276836277532.439579615-696.439579614729
28275216271925.7494229943290.25057700631
29274352272537.7224758371814.27752416331
30271311273483.954268952-2172.95426895155
31289802294242.636836078-4440.63683607848
32290726296746.977787819-6020.97778781911
33292300290995.347573661304.65242633992
34278506285584.975077722-7078.9750777217
35269826268408.0318597561417.96814024361
36265861265790.57226124670.4277387540205
37269034260865.2515663658168.74843363508
38264176265219.533678201-1043.53367820091
39255198259834.577104133-4636.57710413262
40253353249267.2775403134085.72245968712
41246057247658.323704354-1601.32370435420
42235372241401.702479233-6029.70247923251
43258556250209.5115601268346.48843987385
44260993260378.884339502614.115660498297
45254663262334.273505466-7671.27350546647
46250643246837.9964794363805.00352056391
47243422242472.344186224949.655813776451
48247105240942.9965960056162.00340399522
49248541246440.4156422452100.58435775532
50245039245986.108802317-947.108802317263
51237080241878.829461217-4798.82946121661
52237085234936.065071472148.93492852995
53225554231774.476563358-6220.47656335827
54226839220486.031791056352.96820895016
55247934245272.2571360052661.7428639952
56248333251169.430097851-2836.43009785138
57246969249274.375787889-2305.37578788903
58245098243271.2767396741826.72326032553
59246263238763.9862137417499.01378625949
60255765247771.7862910647993.21370893568
61264319258721.4930009525597.50699904829
62268347266221.445675682125.55432431976
63273046270291.5398719412754.46012805897
64273963280557.78056514-6594.78056514019
65267430274184.372981959-6754.37298195949
66271993271364.589780328628.410219671612
67292710299254.417889571-6544.41788957099
68295881298324.452470466-2443.45247046568
69293299298336.605570453-5037.60557045252

\begin{tabular}{lllllllll}
\hline
Interpolation Forecasts of Exponential Smoothing \tabularnewline
t & Observed & Fitted & Residuals \tabularnewline
13 & 277128 & 271656.566784364 & 5471.43321563635 \tabularnewline
14 & 277103 & 277923.353326693 & -820.353326693468 \tabularnewline
15 & 275037 & 277134.891202723 & -2097.89120272303 \tabularnewline
16 & 270150 & 271770.266416459 & -1620.26641645859 \tabularnewline
17 & 267140 & 268095.9041569 & -955.904156899953 \tabularnewline
18 & 264993 & 265466.910074723 & -473.91007472307 \tabularnewline
19 & 287259 & 285740.037524629 & 1518.96247537120 \tabularnewline
20 & 291186 & 295483.386907983 & -4297.38690798311 \tabularnewline
21 & 292300 & 292056.55094069 & 243.449059309671 \tabularnewline
22 & 288186 & 287279.12398743 & 906.876012569817 \tabularnewline
23 & 281477 & 280451.226052562 & 1025.7739474384 \tabularnewline
24 & 282656 & 281852.952712312 & 803.047287687892 \tabularnewline
25 & 280190 & 282686.172673556 & -2496.17267355567 \tabularnewline
26 & 280408 & 278326.702617810 & 2081.2973821896 \tabularnewline
27 & 276836 & 277532.439579615 & -696.439579614729 \tabularnewline
28 & 275216 & 271925.749422994 & 3290.25057700631 \tabularnewline
29 & 274352 & 272537.722475837 & 1814.27752416331 \tabularnewline
30 & 271311 & 273483.954268952 & -2172.95426895155 \tabularnewline
31 & 289802 & 294242.636836078 & -4440.63683607848 \tabularnewline
32 & 290726 & 296746.977787819 & -6020.97778781911 \tabularnewline
33 & 292300 & 290995.34757366 & 1304.65242633992 \tabularnewline
34 & 278506 & 285584.975077722 & -7078.9750777217 \tabularnewline
35 & 269826 & 268408.031859756 & 1417.96814024361 \tabularnewline
36 & 265861 & 265790.572261246 & 70.4277387540205 \tabularnewline
37 & 269034 & 260865.251566365 & 8168.74843363508 \tabularnewline
38 & 264176 & 265219.533678201 & -1043.53367820091 \tabularnewline
39 & 255198 & 259834.577104133 & -4636.57710413262 \tabularnewline
40 & 253353 & 249267.277540313 & 4085.72245968712 \tabularnewline
41 & 246057 & 247658.323704354 & -1601.32370435420 \tabularnewline
42 & 235372 & 241401.702479233 & -6029.70247923251 \tabularnewline
43 & 258556 & 250209.511560126 & 8346.48843987385 \tabularnewline
44 & 260993 & 260378.884339502 & 614.115660498297 \tabularnewline
45 & 254663 & 262334.273505466 & -7671.27350546647 \tabularnewline
46 & 250643 & 246837.996479436 & 3805.00352056391 \tabularnewline
47 & 243422 & 242472.344186224 & 949.655813776451 \tabularnewline
48 & 247105 & 240942.996596005 & 6162.00340399522 \tabularnewline
49 & 248541 & 246440.415642245 & 2100.58435775532 \tabularnewline
50 & 245039 & 245986.108802317 & -947.108802317263 \tabularnewline
51 & 237080 & 241878.829461217 & -4798.82946121661 \tabularnewline
52 & 237085 & 234936.06507147 & 2148.93492852995 \tabularnewline
53 & 225554 & 231774.476563358 & -6220.47656335827 \tabularnewline
54 & 226839 & 220486.03179105 & 6352.96820895016 \tabularnewline
55 & 247934 & 245272.257136005 & 2661.7428639952 \tabularnewline
56 & 248333 & 251169.430097851 & -2836.43009785138 \tabularnewline
57 & 246969 & 249274.375787889 & -2305.37578788903 \tabularnewline
58 & 245098 & 243271.276739674 & 1826.72326032553 \tabularnewline
59 & 246263 & 238763.986213741 & 7499.01378625949 \tabularnewline
60 & 255765 & 247771.786291064 & 7993.21370893568 \tabularnewline
61 & 264319 & 258721.493000952 & 5597.50699904829 \tabularnewline
62 & 268347 & 266221.44567568 & 2125.55432431976 \tabularnewline
63 & 273046 & 270291.539871941 & 2754.46012805897 \tabularnewline
64 & 273963 & 280557.78056514 & -6594.78056514019 \tabularnewline
65 & 267430 & 274184.372981959 & -6754.37298195949 \tabularnewline
66 & 271993 & 271364.589780328 & 628.410219671612 \tabularnewline
67 & 292710 & 299254.417889571 & -6544.41788957099 \tabularnewline
68 & 295881 & 298324.452470466 & -2443.45247046568 \tabularnewline
69 & 293299 & 298336.605570453 & -5037.60557045252 \tabularnewline
\hline
\end{tabular}
%Source: https://freestatistics.org/blog/index.php?pk=63924&T=2

[TABLE]
[ROW][C]Interpolation Forecasts of Exponential Smoothing[/C][/ROW]
[ROW][C]t[/C][C]Observed[/C][C]Fitted[/C][C]Residuals[/C][/ROW]
[ROW][C]13[/C][C]277128[/C][C]271656.566784364[/C][C]5471.43321563635[/C][/ROW]
[ROW][C]14[/C][C]277103[/C][C]277923.353326693[/C][C]-820.353326693468[/C][/ROW]
[ROW][C]15[/C][C]275037[/C][C]277134.891202723[/C][C]-2097.89120272303[/C][/ROW]
[ROW][C]16[/C][C]270150[/C][C]271770.266416459[/C][C]-1620.26641645859[/C][/ROW]
[ROW][C]17[/C][C]267140[/C][C]268095.9041569[/C][C]-955.904156899953[/C][/ROW]
[ROW][C]18[/C][C]264993[/C][C]265466.910074723[/C][C]-473.91007472307[/C][/ROW]
[ROW][C]19[/C][C]287259[/C][C]285740.037524629[/C][C]1518.96247537120[/C][/ROW]
[ROW][C]20[/C][C]291186[/C][C]295483.386907983[/C][C]-4297.38690798311[/C][/ROW]
[ROW][C]21[/C][C]292300[/C][C]292056.55094069[/C][C]243.449059309671[/C][/ROW]
[ROW][C]22[/C][C]288186[/C][C]287279.12398743[/C][C]906.876012569817[/C][/ROW]
[ROW][C]23[/C][C]281477[/C][C]280451.226052562[/C][C]1025.7739474384[/C][/ROW]
[ROW][C]24[/C][C]282656[/C][C]281852.952712312[/C][C]803.047287687892[/C][/ROW]
[ROW][C]25[/C][C]280190[/C][C]282686.172673556[/C][C]-2496.17267355567[/C][/ROW]
[ROW][C]26[/C][C]280408[/C][C]278326.702617810[/C][C]2081.2973821896[/C][/ROW]
[ROW][C]27[/C][C]276836[/C][C]277532.439579615[/C][C]-696.439579614729[/C][/ROW]
[ROW][C]28[/C][C]275216[/C][C]271925.749422994[/C][C]3290.25057700631[/C][/ROW]
[ROW][C]29[/C][C]274352[/C][C]272537.722475837[/C][C]1814.27752416331[/C][/ROW]
[ROW][C]30[/C][C]271311[/C][C]273483.954268952[/C][C]-2172.95426895155[/C][/ROW]
[ROW][C]31[/C][C]289802[/C][C]294242.636836078[/C][C]-4440.63683607848[/C][/ROW]
[ROW][C]32[/C][C]290726[/C][C]296746.977787819[/C][C]-6020.97778781911[/C][/ROW]
[ROW][C]33[/C][C]292300[/C][C]290995.34757366[/C][C]1304.65242633992[/C][/ROW]
[ROW][C]34[/C][C]278506[/C][C]285584.975077722[/C][C]-7078.9750777217[/C][/ROW]
[ROW][C]35[/C][C]269826[/C][C]268408.031859756[/C][C]1417.96814024361[/C][/ROW]
[ROW][C]36[/C][C]265861[/C][C]265790.572261246[/C][C]70.4277387540205[/C][/ROW]
[ROW][C]37[/C][C]269034[/C][C]260865.251566365[/C][C]8168.74843363508[/C][/ROW]
[ROW][C]38[/C][C]264176[/C][C]265219.533678201[/C][C]-1043.53367820091[/C][/ROW]
[ROW][C]39[/C][C]255198[/C][C]259834.577104133[/C][C]-4636.57710413262[/C][/ROW]
[ROW][C]40[/C][C]253353[/C][C]249267.277540313[/C][C]4085.72245968712[/C][/ROW]
[ROW][C]41[/C][C]246057[/C][C]247658.323704354[/C][C]-1601.32370435420[/C][/ROW]
[ROW][C]42[/C][C]235372[/C][C]241401.702479233[/C][C]-6029.70247923251[/C][/ROW]
[ROW][C]43[/C][C]258556[/C][C]250209.511560126[/C][C]8346.48843987385[/C][/ROW]
[ROW][C]44[/C][C]260993[/C][C]260378.884339502[/C][C]614.115660498297[/C][/ROW]
[ROW][C]45[/C][C]254663[/C][C]262334.273505466[/C][C]-7671.27350546647[/C][/ROW]
[ROW][C]46[/C][C]250643[/C][C]246837.996479436[/C][C]3805.00352056391[/C][/ROW]
[ROW][C]47[/C][C]243422[/C][C]242472.344186224[/C][C]949.655813776451[/C][/ROW]
[ROW][C]48[/C][C]247105[/C][C]240942.996596005[/C][C]6162.00340399522[/C][/ROW]
[ROW][C]49[/C][C]248541[/C][C]246440.415642245[/C][C]2100.58435775532[/C][/ROW]
[ROW][C]50[/C][C]245039[/C][C]245986.108802317[/C][C]-947.108802317263[/C][/ROW]
[ROW][C]51[/C][C]237080[/C][C]241878.829461217[/C][C]-4798.82946121661[/C][/ROW]
[ROW][C]52[/C][C]237085[/C][C]234936.06507147[/C][C]2148.93492852995[/C][/ROW]
[ROW][C]53[/C][C]225554[/C][C]231774.476563358[/C][C]-6220.47656335827[/C][/ROW]
[ROW][C]54[/C][C]226839[/C][C]220486.03179105[/C][C]6352.96820895016[/C][/ROW]
[ROW][C]55[/C][C]247934[/C][C]245272.257136005[/C][C]2661.7428639952[/C][/ROW]
[ROW][C]56[/C][C]248333[/C][C]251169.430097851[/C][C]-2836.43009785138[/C][/ROW]
[ROW][C]57[/C][C]246969[/C][C]249274.375787889[/C][C]-2305.37578788903[/C][/ROW]
[ROW][C]58[/C][C]245098[/C][C]243271.276739674[/C][C]1826.72326032553[/C][/ROW]
[ROW][C]59[/C][C]246263[/C][C]238763.986213741[/C][C]7499.01378625949[/C][/ROW]
[ROW][C]60[/C][C]255765[/C][C]247771.786291064[/C][C]7993.21370893568[/C][/ROW]
[ROW][C]61[/C][C]264319[/C][C]258721.493000952[/C][C]5597.50699904829[/C][/ROW]
[ROW][C]62[/C][C]268347[/C][C]266221.44567568[/C][C]2125.55432431976[/C][/ROW]
[ROW][C]63[/C][C]273046[/C][C]270291.539871941[/C][C]2754.46012805897[/C][/ROW]
[ROW][C]64[/C][C]273963[/C][C]280557.78056514[/C][C]-6594.78056514019[/C][/ROW]
[ROW][C]65[/C][C]267430[/C][C]274184.372981959[/C][C]-6754.37298195949[/C][/ROW]
[ROW][C]66[/C][C]271993[/C][C]271364.589780328[/C][C]628.410219671612[/C][/ROW]
[ROW][C]67[/C][C]292710[/C][C]299254.417889571[/C][C]-6544.41788957099[/C][/ROW]
[ROW][C]68[/C][C]295881[/C][C]298324.452470466[/C][C]-2443.45247046568[/C][/ROW]
[ROW][C]69[/C][C]293299[/C][C]298336.605570453[/C][C]-5037.60557045252[/C][/ROW]
[/TABLE]
Source: https://freestatistics.org/blog/index.php?pk=63924&T=2

Globally Unique Identifier (entire table): ba.freestatistics.org/blog/index.php?pk=63924&T=2

As an alternative you can also use a QR Code:  

The GUIDs for individual cells are displayed in the table below:

Interpolation Forecasts of Exponential Smoothing
tObservedFittedResiduals
13277128271656.5667843645471.43321563635
14277103277923.353326693-820.353326693468
15275037277134.891202723-2097.89120272303
16270150271770.266416459-1620.26641645859
17267140268095.9041569-955.904156899953
18264993265466.910074723-473.91007472307
19287259285740.0375246291518.96247537120
20291186295483.386907983-4297.38690798311
21292300292056.55094069243.449059309671
22288186287279.12398743906.876012569817
23281477280451.2260525621025.7739474384
24282656281852.952712312803.047287687892
25280190282686.172673556-2496.17267355567
26280408278326.7026178102081.2973821896
27276836277532.439579615-696.439579614729
28275216271925.7494229943290.25057700631
29274352272537.7224758371814.27752416331
30271311273483.954268952-2172.95426895155
31289802294242.636836078-4440.63683607848
32290726296746.977787819-6020.97778781911
33292300290995.347573661304.65242633992
34278506285584.975077722-7078.9750777217
35269826268408.0318597561417.96814024361
36265861265790.57226124670.4277387540205
37269034260865.2515663658168.74843363508
38264176265219.533678201-1043.53367820091
39255198259834.577104133-4636.57710413262
40253353249267.2775403134085.72245968712
41246057247658.323704354-1601.32370435420
42235372241401.702479233-6029.70247923251
43258556250209.5115601268346.48843987385
44260993260378.884339502614.115660498297
45254663262334.273505466-7671.27350546647
46250643246837.9964794363805.00352056391
47243422242472.344186224949.655813776451
48247105240942.9965960056162.00340399522
49248541246440.4156422452100.58435775532
50245039245986.108802317-947.108802317263
51237080241878.829461217-4798.82946121661
52237085234936.065071472148.93492852995
53225554231774.476563358-6220.47656335827
54226839220486.031791056352.96820895016
55247934245272.2571360052661.7428639952
56248333251169.430097851-2836.43009785138
57246969249274.375787889-2305.37578788903
58245098243271.2767396741826.72326032553
59246263238763.9862137417499.01378625949
60255765247771.7862910647993.21370893568
61264319258721.4930009525597.50699904829
62268347266221.445675682125.55432431976
63273046270291.5398719412754.46012805897
64273963280557.78056514-6594.78056514019
65267430274184.372981959-6754.37298195949
66271993271364.589780328628.410219671612
67292710299254.417889571-6544.41788957099
68295881298324.452470466-2443.45247046568
69293299298336.605570453-5037.60557045252


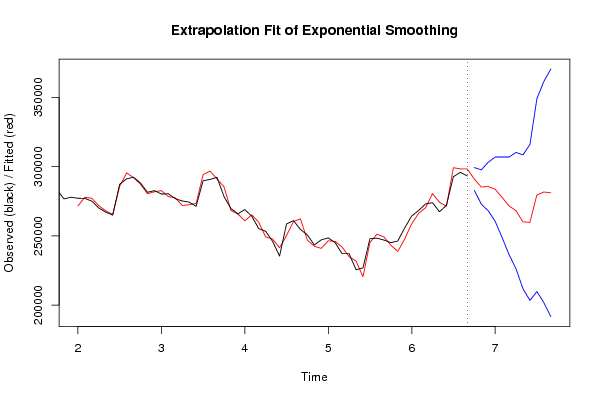
Extrapolation Forecasts of Exponential Smoothing
tForecast95% Lower Bound95% Upper Bound
70291081.242127761282833.696848460299328.787407061
71285292.451730862272910.349876904297674.55358482
72285629.294688158268107.167052264303151.422324052
73283703.519280115260471.877608561306935.160951669
74277810.341363102248699.530792691306921.151933513
75271645.291247677236375.175858218306915.406637136
76268187.025748769226110.105842672310263.945654867
77260118.851790614211737.200924964308500.502656264
78259728.088908926203381.90355576316074.274262092
79279453.522681236209743.5277159349163.517646572
80281647.383603430201741.899681553361552.867525306
81281099.191474865191654.465752469370543.917197262

\begin{tabular}{lllllllll}
\hline
Extrapolation Forecasts of Exponential Smoothing \tabularnewline
t & Forecast & 95% Lower Bound & 95% Upper Bound \tabularnewline
70 & 291081.242127761 & 282833.696848460 & 299328.787407061 \tabularnewline
71 & 285292.451730862 & 272910.349876904 & 297674.55358482 \tabularnewline
72 & 285629.294688158 & 268107.167052264 & 303151.422324052 \tabularnewline
73 & 283703.519280115 & 260471.877608561 & 306935.160951669 \tabularnewline
74 & 277810.341363102 & 248699.530792691 & 306921.151933513 \tabularnewline
75 & 271645.291247677 & 236375.175858218 & 306915.406637136 \tabularnewline
76 & 268187.025748769 & 226110.105842672 & 310263.945654867 \tabularnewline
77 & 260118.851790614 & 211737.200924964 & 308500.502656264 \tabularnewline
78 & 259728.088908926 & 203381.90355576 & 316074.274262092 \tabularnewline
79 & 279453.522681236 & 209743.5277159 & 349163.517646572 \tabularnewline
80 & 281647.383603430 & 201741.899681553 & 361552.867525306 \tabularnewline
81 & 281099.191474865 & 191654.465752469 & 370543.917197262 \tabularnewline
\hline
\end{tabular}
%Source: https://freestatistics.org/blog/index.php?pk=63924&T=3

[TABLE]
[ROW][C]Extrapolation Forecasts of Exponential Smoothing[/C][/ROW]
[ROW][C]t[/C][C]Forecast[/C][C]95% Lower Bound[/C][C]95% Upper Bound[/C][/ROW]
[ROW][C]70[/C][C]291081.242127761[/C][C]282833.696848460[/C][C]299328.787407061[/C][/ROW]
[ROW][C]71[/C][C]285292.451730862[/C][C]272910.349876904[/C][C]297674.55358482[/C][/ROW]
[ROW][C]72[/C][C]285629.294688158[/C][C]268107.167052264[/C][C]303151.422324052[/C][/ROW]
[ROW][C]73[/C][C]283703.519280115[/C][C]260471.877608561[/C][C]306935.160951669[/C][/ROW]
[ROW][C]74[/C][C]277810.341363102[/C][C]248699.530792691[/C][C]306921.151933513[/C][/ROW]
[ROW][C]75[/C][C]271645.291247677[/C][C]236375.175858218[/C][C]306915.406637136[/C][/ROW]
[ROW][C]76[/C][C]268187.025748769[/C][C]226110.105842672[/C][C]310263.945654867[/C][/ROW]
[ROW][C]77[/C][C]260118.851790614[/C][C]211737.200924964[/C][C]308500.502656264[/C][/ROW]
[ROW][C]78[/C][C]259728.088908926[/C][C]203381.90355576[/C][C]316074.274262092[/C][/ROW]
[ROW][C]79[/C][C]279453.522681236[/C][C]209743.5277159[/C][C]349163.517646572[/C][/ROW]
[ROW][C]80[/C][C]281647.383603430[/C][C]201741.899681553[/C][C]361552.867525306[/C][/ROW]
[ROW][C]81[/C][C]281099.191474865[/C][C]191654.465752469[/C][C]370543.917197262[/C][/ROW]
[/TABLE]
Source: https://freestatistics.org/blog/index.php?pk=63924&T=3

Globally Unique Identifier (entire table): ba.freestatistics.org/blog/index.php?pk=63924&T=3

As an alternative you can also use a QR Code:  

The GUIDs for individual cells are displayed in the table below:

Extrapolation Forecasts of Exponential Smoothing
tForecast95% Lower Bound95% Upper Bound
70291081.242127761282833.696848460299328.787407061
71285292.451730862272910.349876904297674.55358482
72285629.294688158268107.167052264303151.422324052
73283703.519280115260471.877608561306935.160951669
74277810.341363102248699.530792691306921.151933513
75271645.291247677236375.175858218306915.406637136
76268187.025748769226110.105842672310263.945654867
77260118.851790614211737.200924964308500.502656264
78259728.088908926203381.90355576316074.274262092
79279453.522681236209743.5277159349163.517646572
80281647.383603430201741.899681553361552.867525306
81281099.191474865191654.465752469370543.917197262


Parameters (Session):
par1 = FALSE ; par2 = 1 ; par3 = 1 ; par4 = 1 ; par5 = 12 ; par6 = 3 ; par7 = 1 ; par8 = 2 ; par9 = 1 ;
Parameters (R input):
par1 = 12 ; par2 = Triple ; par3 = multiplicative ;
R code (references can be found in the software module):
par1 <- as.numeric(par1)
if (par2 == 'Single') K <- 1
if (par2 == 'Double') K <- 2
if (par2 == 'Triple') K <- par1
nx <- length(x)
nxmK <- nx - K
x <- ts(x, frequency = par1)
if (par2 == 'Single') fit <- HoltWinters(x, gamma=0, beta=0)
if (par2 == 'Double') fit <- HoltWinters(x, gamma=0)
if (par2 == 'Triple') fit <- HoltWinters(x, seasonal=par3)
fit
myresid <- x - fit$fitted[,'xhat']
bitmap(file='test1.png')
op <- par(mfrow=c(2,1))
plot(fit,ylab='Observed (black) / Fitted (red)',main='Interpolation Fit of Exponential Smoothing')
plot(myresid,ylab='Residuals',main='Interpolation Prediction Errors')
par(op)
dev.off()
bitmap(file='test2.png')
p <- predict(fit, par1, prediction.interval=TRUE)
np <- length(p[,1])
plot(fit,p,ylab='Observed (black) / Fitted (red)',main='Extrapolation Fit of Exponential Smoothing')
dev.off()
bitmap(file='test3.png')
op <- par(mfrow = c(2,2))
acf(as.numeric(myresid),lag.max = nx/2,main='Residual ACF')
spectrum(myresid,main='Residals Periodogram')
cpgram(myresid,main='Residal Cumulative Periodogram')
qqnorm(myresid,main='Residual Normal QQ Plot')
qqline(myresid)
par(op)
dev.off()
load(file='createtable')
a<-table.start()
a<-table.row.start(a)
a<-table.element(a,'Estimated Parameters of Exponential Smoothing',2,TRUE)
a<-table.row.end(a)
a<-table.row.start(a)
a<-table.element(a,'Parameter',header=TRUE)
a<-table.element(a,'Value',header=TRUE)
a<-table.row.end(a)
a<-table.row.start(a)
a<-table.element(a,'alpha',header=TRUE)
a<-table.element(a,fit$alpha)
a<-table.row.end(a)
a<-table.row.start(a)
a<-table.element(a,'beta',header=TRUE)
a<-table.element(a,fit$beta)
a<-table.row.end(a)
a<-table.row.start(a)
a<-table.element(a,'gamma',header=TRUE)
a<-table.element(a,fit$gamma)
a<-table.row.end(a)
a<-table.end(a)
table.save(a,file='mytable.tab')
a<-table.start()
a<-table.row.start(a)
a<-table.element(a,'Interpolation Forecasts of Exponential Smoothing',4,TRUE)
a<-table.row.end(a)
a<-table.row.start(a)
a<-table.element(a,'t',header=TRUE)
a<-table.element(a,'Observed',header=TRUE)
a<-table.element(a,'Fitted',header=TRUE)
a<-table.element(a,'Residuals',header=TRUE)
a<-table.row.end(a)
for (i in 1:nxmK) {
a<-table.row.start(a)
a<-table.element(a,i+K,header=TRUE)
a<-table.element(a,x[i+K])
a<-table.element(a,fit$fitted[i,'xhat'])
a<-table.element(a,myresid[i])
a<-table.row.end(a)
}
a<-table.end(a)
table.save(a,file='mytable1.tab')
a<-table.start()
a<-table.row.start(a)
a<-table.element(a,'Extrapolation Forecasts of Exponential Smoothing',4,TRUE)
a<-table.row.end(a)
a<-table.row.start(a)
a<-table.element(a,'t',header=TRUE)
a<-table.element(a,'Forecast',header=TRUE)
a<-table.element(a,'95% Lower Bound',header=TRUE)
a<-table.element(a,'95% Upper Bound',header=TRUE)
a<-table.row.end(a)
for (i in 1:np) {
a<-table.row.start(a)
a<-table.element(a,nx+i,header=TRUE)
a<-table.element(a,p[i,'fit'])
a<-table.element(a,p[i,'lwr'])
a<-table.element(a,p[i,'upr'])
a<-table.row.end(a)
}
a<-table.end(a)
table.save(a,file='mytable2.tab')