Free Statistics

of Irreproducible Research!

Author's title

Author*The author of this computation has been verified*
R Software Modulerwasp_exponentialsmoothing.wasp
Title produced by softwareExponential Smoothing
Date of computationFri, 04 Dec 2009 10:25:53 -0700
Cite this page as followsStatistical Computations at FreeStatistics.org, Office for Research Development and Education, URL https://freestatistics.org/blog/index.php?v=date/2009/Dec/04/t1259947624ka83tuml0b80t1z.htm/, Retrieved Sun, 28 Apr 2024 02:19:32 +0000
Statistical Computations at FreeStatistics.org, Office for Research Development and Education, URL https://freestatistics.org/blog/index.php?pk=63945, Retrieved Sun, 28 Apr 2024 02:19:32 +0000
QR Codes:

Original text written by user:
IsPrivate?No (this computation is public)
User-defined keywords
Estimated Impact112
Family? (F = Feedback message, R = changed R code, M = changed R Module, P = changed Parameters, D = changed Data)
-     [Univariate Data Series] [data set] [2008-12-01 19:54:57] [b98453cac15ba1066b407e146608df68]
- RMP   [Exponential Smoothing] [] [2009-11-27 15:04:36] [b98453cac15ba1066b407e146608df68]
-   PD      [Exponential Smoothing] [WS 9: Exponential...] [2009-12-04 17:25:53] [17b3de9cda9f51722106e41c76160a49] [Current]
-   P         [Exponential Smoothing] [WS 8: Exponential...] [2009-12-04 23:46:53] [8cf9233b7464ea02e32be3b30fdac052]
-   PD          [Exponential Smoothing] [Correctie WS 9 ] [2009-12-11 15:04:16] [8cf9233b7464ea02e32be3b30fdac052]
Feedback Forum

Post a new message
Dataseries X:
114
116
153
162
161
149
139
135
130
127
122
117
112
113
149
157
157
147
137
132
125
123
117
114
111
112
144
150
149
134
123
116
117
111
105
102
95
93
124
130
124
115
106
105
105
101
95
93
84
87
116
120
117
109
105
107
109
109
108
107


Summary of computational transaction
Raw Inputview raw input (R code)
Raw Outputview raw output of R engine
Computing time1 seconds
R Server'Gwilym Jenkins' @ 72.249.127.135

\begin{tabular}{lllllllll}
\hline
Summary of computational transaction \tabularnewline
Raw Input & view raw input (R code)  \tabularnewline
Raw Output & view raw output of R engine  \tabularnewline
Computing time & 1 seconds \tabularnewline
R Server & 'Gwilym Jenkins' @ 72.249.127.135 \tabularnewline
\hline
\end{tabular}
%Source: https://freestatistics.org/blog/index.php?pk=63945&T=0

[TABLE]
[ROW][C]Summary of computational transaction[/C][/ROW]
[ROW][C]Raw Input[/C][C]view raw input (R code) [/C][/ROW]
[ROW][C]Raw Output[/C][C]view raw output of R engine [/C][/ROW]
[ROW][C]Computing time[/C][C]1 seconds[/C][/ROW]
[ROW][C]R Server[/C][C]'Gwilym Jenkins' @ 72.249.127.135[/C][/ROW]
[/TABLE]
Source: https://freestatistics.org/blog/index.php?pk=63945&T=0

Globally Unique Identifier (entire table): ba.freestatistics.org/blog/index.php?pk=63945&T=0

As an alternative you can also use a QR Code:  

The GUIDs for individual cells are displayed in the table below:

Summary of computational transaction
Raw Inputview raw input (R code)
Raw Outputview raw output of R engine
Computing time1 seconds
R Server'Gwilym Jenkins' @ 72.249.127.135


Estimated Parameters of Exponential Smoothing
ParameterValue
alpha1
beta0
gamma0.432015235872734

\begin{tabular}{lllllllll}
\hline
Estimated Parameters of Exponential Smoothing \tabularnewline
Parameter & Value \tabularnewline
alpha & 1 \tabularnewline
beta & 0 \tabularnewline
gamma & 0.432015235872734 \tabularnewline
\hline
\end{tabular}
%Source: https://freestatistics.org/blog/index.php?pk=63945&T=1

[TABLE]
[ROW][C]Estimated Parameters of Exponential Smoothing[/C][/ROW]
[ROW][C]Parameter[/C][C]Value[/C][/ROW]
[ROW][C]alpha[/C][C]1[/C][/ROW]
[ROW][C]beta[/C][C]0[/C][/ROW]
[ROW][C]gamma[/C][C]0.432015235872734[/C][/ROW]
[/TABLE]
Source: https://freestatistics.org/blog/index.php?pk=63945&T=1

Globally Unique Identifier (entire table): ba.freestatistics.org/blog/index.php?pk=63945&T=1

As an alternative you can also use a QR Code:  

The GUIDs for individual cells are displayed in the table below:

Estimated Parameters of Exponential Smoothing
ParameterValue
alpha1
beta0
gamma0.432015235872734


Interpolation Forecasts of Exponential Smoothing
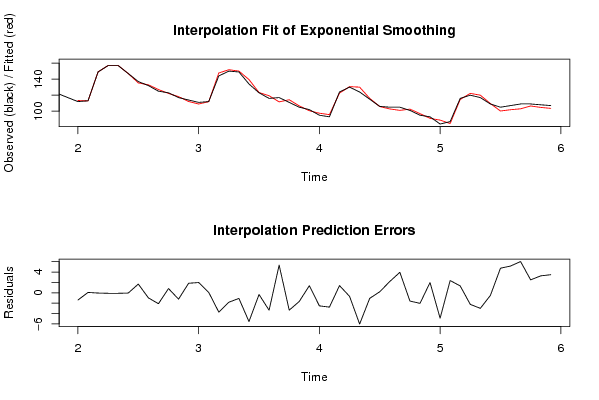
tObservedFittedResiduals
13112113.387857793709-1.38785779370852
14113112.9270737831590.0729262168412532
15149149.043505980836-0.0435059808360734
16157157.095249460890-0.095249460890301
17157157.095519289391-0.0955192893914898
18147147.043274160734-0.043274160733688
19137135.3167095571861.68329044281415
20132132.968509499453-0.968509499452836
21125127.102166225199-2.1021662251992
22123122.1778315762900.822168423710437
23117118.220013167857-1.22001316785700
24114112.1570906425211.84290935747875
25111109.0175434234881.98245657651211
26112111.9165702373760.0834297626242346
27144147.721620291083-3.72162029108301
28150151.811910439922-1.81191043992195
29149150.075689261063-1.07568926106282
30134139.533919002382-5.53391900238236
31123123.323179263295-0.323179263294890
32116119.350423394794-3.35042339479357
33117111.6614300625845.33856993741581
34111114.340650102666-3.34065010266555
35105106.660214202392-1.66021420239208
36102100.6273966670601.37260333293960
379597.5160407698656-2.51604076986555
389395.7485135048482-2.74851350484822
39124122.6057921857751.39420781422534
40130130.678554356048-0.678554356048267
41124130.019032037267-6.01903203726678
42115116.067184132535-1.06718413253455
43106105.7941734491470.205826550853416
44105102.8141759819932.18582401800698
45105101.0459239507863.95407604921364
46101102.584877892230-1.58487789222956
479597.027048397838-2.02704839783799
489391.01931835417631.98068164582367
498488.8899137796488-4.88991377964878
508784.63297450123552.36702549876446
51116114.6744780472561.32552195274377
52120122.225211922499-2.22521192249881
53117119.990703425369-2.99070342536878
54109109.496498368977-0.496498368977143
55105100.2586979288894.74130207111078
56107101.8414555459465.15854445405408
57109102.9760159711136.02398402888674
58109106.5034686290422.49653137095846
59108104.7335810414813.26641895851873
60107103.5098201609263.49017983907439

\begin{tabular}{lllllllll}
\hline
Interpolation Forecasts of Exponential Smoothing \tabularnewline
t & Observed & Fitted & Residuals \tabularnewline
13 & 112 & 113.387857793709 & -1.38785779370852 \tabularnewline
14 & 113 & 112.927073783159 & 0.0729262168412532 \tabularnewline
15 & 149 & 149.043505980836 & -0.0435059808360734 \tabularnewline
16 & 157 & 157.095249460890 & -0.095249460890301 \tabularnewline
17 & 157 & 157.095519289391 & -0.0955192893914898 \tabularnewline
18 & 147 & 147.043274160734 & -0.043274160733688 \tabularnewline
19 & 137 & 135.316709557186 & 1.68329044281415 \tabularnewline
20 & 132 & 132.968509499453 & -0.968509499452836 \tabularnewline
21 & 125 & 127.102166225199 & -2.1021662251992 \tabularnewline
22 & 123 & 122.177831576290 & 0.822168423710437 \tabularnewline
23 & 117 & 118.220013167857 & -1.22001316785700 \tabularnewline
24 & 114 & 112.157090642521 & 1.84290935747875 \tabularnewline
25 & 111 & 109.017543423488 & 1.98245657651211 \tabularnewline
26 & 112 & 111.916570237376 & 0.0834297626242346 \tabularnewline
27 & 144 & 147.721620291083 & -3.72162029108301 \tabularnewline
28 & 150 & 151.811910439922 & -1.81191043992195 \tabularnewline
29 & 149 & 150.075689261063 & -1.07568926106282 \tabularnewline
30 & 134 & 139.533919002382 & -5.53391900238236 \tabularnewline
31 & 123 & 123.323179263295 & -0.323179263294890 \tabularnewline
32 & 116 & 119.350423394794 & -3.35042339479357 \tabularnewline
33 & 117 & 111.661430062584 & 5.33856993741581 \tabularnewline
34 & 111 & 114.340650102666 & -3.34065010266555 \tabularnewline
35 & 105 & 106.660214202392 & -1.66021420239208 \tabularnewline
36 & 102 & 100.627396667060 & 1.37260333293960 \tabularnewline
37 & 95 & 97.5160407698656 & -2.51604076986555 \tabularnewline
38 & 93 & 95.7485135048482 & -2.74851350484822 \tabularnewline
39 & 124 & 122.605792185775 & 1.39420781422534 \tabularnewline
40 & 130 & 130.678554356048 & -0.678554356048267 \tabularnewline
41 & 124 & 130.019032037267 & -6.01903203726678 \tabularnewline
42 & 115 & 116.067184132535 & -1.06718413253455 \tabularnewline
43 & 106 & 105.794173449147 & 0.205826550853416 \tabularnewline
44 & 105 & 102.814175981993 & 2.18582401800698 \tabularnewline
45 & 105 & 101.045923950786 & 3.95407604921364 \tabularnewline
46 & 101 & 102.584877892230 & -1.58487789222956 \tabularnewline
47 & 95 & 97.027048397838 & -2.02704839783799 \tabularnewline
48 & 93 & 91.0193183541763 & 1.98068164582367 \tabularnewline
49 & 84 & 88.8899137796488 & -4.88991377964878 \tabularnewline
50 & 87 & 84.6329745012355 & 2.36702549876446 \tabularnewline
51 & 116 & 114.674478047256 & 1.32552195274377 \tabularnewline
52 & 120 & 122.225211922499 & -2.22521192249881 \tabularnewline
53 & 117 & 119.990703425369 & -2.99070342536878 \tabularnewline
54 & 109 & 109.496498368977 & -0.496498368977143 \tabularnewline
55 & 105 & 100.258697928889 & 4.74130207111078 \tabularnewline
56 & 107 & 101.841455545946 & 5.15854445405408 \tabularnewline
57 & 109 & 102.976015971113 & 6.02398402888674 \tabularnewline
58 & 109 & 106.503468629042 & 2.49653137095846 \tabularnewline
59 & 108 & 104.733581041481 & 3.26641895851873 \tabularnewline
60 & 107 & 103.509820160926 & 3.49017983907439 \tabularnewline
\hline
\end{tabular}
%Source: https://freestatistics.org/blog/index.php?pk=63945&T=2

[TABLE]
[ROW][C]Interpolation Forecasts of Exponential Smoothing[/C][/ROW]
[ROW][C]t[/C][C]Observed[/C][C]Fitted[/C][C]Residuals[/C][/ROW]
[ROW][C]13[/C][C]112[/C][C]113.387857793709[/C][C]-1.38785779370852[/C][/ROW]
[ROW][C]14[/C][C]113[/C][C]112.927073783159[/C][C]0.0729262168412532[/C][/ROW]
[ROW][C]15[/C][C]149[/C][C]149.043505980836[/C][C]-0.0435059808360734[/C][/ROW]
[ROW][C]16[/C][C]157[/C][C]157.095249460890[/C][C]-0.095249460890301[/C][/ROW]
[ROW][C]17[/C][C]157[/C][C]157.095519289391[/C][C]-0.0955192893914898[/C][/ROW]
[ROW][C]18[/C][C]147[/C][C]147.043274160734[/C][C]-0.043274160733688[/C][/ROW]
[ROW][C]19[/C][C]137[/C][C]135.316709557186[/C][C]1.68329044281415[/C][/ROW]
[ROW][C]20[/C][C]132[/C][C]132.968509499453[/C][C]-0.968509499452836[/C][/ROW]
[ROW][C]21[/C][C]125[/C][C]127.102166225199[/C][C]-2.1021662251992[/C][/ROW]
[ROW][C]22[/C][C]123[/C][C]122.177831576290[/C][C]0.822168423710437[/C][/ROW]
[ROW][C]23[/C][C]117[/C][C]118.220013167857[/C][C]-1.22001316785700[/C][/ROW]
[ROW][C]24[/C][C]114[/C][C]112.157090642521[/C][C]1.84290935747875[/C][/ROW]
[ROW][C]25[/C][C]111[/C][C]109.017543423488[/C][C]1.98245657651211[/C][/ROW]
[ROW][C]26[/C][C]112[/C][C]111.916570237376[/C][C]0.0834297626242346[/C][/ROW]
[ROW][C]27[/C][C]144[/C][C]147.721620291083[/C][C]-3.72162029108301[/C][/ROW]
[ROW][C]28[/C][C]150[/C][C]151.811910439922[/C][C]-1.81191043992195[/C][/ROW]
[ROW][C]29[/C][C]149[/C][C]150.075689261063[/C][C]-1.07568926106282[/C][/ROW]
[ROW][C]30[/C][C]134[/C][C]139.533919002382[/C][C]-5.53391900238236[/C][/ROW]
[ROW][C]31[/C][C]123[/C][C]123.323179263295[/C][C]-0.323179263294890[/C][/ROW]
[ROW][C]32[/C][C]116[/C][C]119.350423394794[/C][C]-3.35042339479357[/C][/ROW]
[ROW][C]33[/C][C]117[/C][C]111.661430062584[/C][C]5.33856993741581[/C][/ROW]
[ROW][C]34[/C][C]111[/C][C]114.340650102666[/C][C]-3.34065010266555[/C][/ROW]
[ROW][C]35[/C][C]105[/C][C]106.660214202392[/C][C]-1.66021420239208[/C][/ROW]
[ROW][C]36[/C][C]102[/C][C]100.627396667060[/C][C]1.37260333293960[/C][/ROW]
[ROW][C]37[/C][C]95[/C][C]97.5160407698656[/C][C]-2.51604076986555[/C][/ROW]
[ROW][C]38[/C][C]93[/C][C]95.7485135048482[/C][C]-2.74851350484822[/C][/ROW]
[ROW][C]39[/C][C]124[/C][C]122.605792185775[/C][C]1.39420781422534[/C][/ROW]
[ROW][C]40[/C][C]130[/C][C]130.678554356048[/C][C]-0.678554356048267[/C][/ROW]
[ROW][C]41[/C][C]124[/C][C]130.019032037267[/C][C]-6.01903203726678[/C][/ROW]
[ROW][C]42[/C][C]115[/C][C]116.067184132535[/C][C]-1.06718413253455[/C][/ROW]
[ROW][C]43[/C][C]106[/C][C]105.794173449147[/C][C]0.205826550853416[/C][/ROW]
[ROW][C]44[/C][C]105[/C][C]102.814175981993[/C][C]2.18582401800698[/C][/ROW]
[ROW][C]45[/C][C]105[/C][C]101.045923950786[/C][C]3.95407604921364[/C][/ROW]
[ROW][C]46[/C][C]101[/C][C]102.584877892230[/C][C]-1.58487789222956[/C][/ROW]
[ROW][C]47[/C][C]95[/C][C]97.027048397838[/C][C]-2.02704839783799[/C][/ROW]
[ROW][C]48[/C][C]93[/C][C]91.0193183541763[/C][C]1.98068164582367[/C][/ROW]
[ROW][C]49[/C][C]84[/C][C]88.8899137796488[/C][C]-4.88991377964878[/C][/ROW]
[ROW][C]50[/C][C]87[/C][C]84.6329745012355[/C][C]2.36702549876446[/C][/ROW]
[ROW][C]51[/C][C]116[/C][C]114.674478047256[/C][C]1.32552195274377[/C][/ROW]
[ROW][C]52[/C][C]120[/C][C]122.225211922499[/C][C]-2.22521192249881[/C][/ROW]
[ROW][C]53[/C][C]117[/C][C]119.990703425369[/C][C]-2.99070342536878[/C][/ROW]
[ROW][C]54[/C][C]109[/C][C]109.496498368977[/C][C]-0.496498368977143[/C][/ROW]
[ROW][C]55[/C][C]105[/C][C]100.258697928889[/C][C]4.74130207111078[/C][/ROW]
[ROW][C]56[/C][C]107[/C][C]101.841455545946[/C][C]5.15854445405408[/C][/ROW]
[ROW][C]57[/C][C]109[/C][C]102.976015971113[/C][C]6.02398402888674[/C][/ROW]
[ROW][C]58[/C][C]109[/C][C]106.503468629042[/C][C]2.49653137095846[/C][/ROW]
[ROW][C]59[/C][C]108[/C][C]104.733581041481[/C][C]3.26641895851873[/C][/ROW]
[ROW][C]60[/C][C]107[/C][C]103.509820160926[/C][C]3.49017983907439[/C][/ROW]
[/TABLE]
Source: https://freestatistics.org/blog/index.php?pk=63945&T=2

Globally Unique Identifier (entire table): ba.freestatistics.org/blog/index.php?pk=63945&T=2

As an alternative you can also use a QR Code:  

The GUIDs for individual cells are displayed in the table below:

Interpolation Forecasts of Exponential Smoothing
tObservedFittedResiduals
13112113.387857793709-1.38785779370852
14113112.9270737831590.0729262168412532
15149149.043505980836-0.0435059808360734
16157157.095249460890-0.095249460890301
17157157.095519289391-0.0955192893914898
18147147.043274160734-0.043274160733688
19137135.3167095571861.68329044281415
20132132.968509499453-0.968509499452836
21125127.102166225199-2.1021662251992
22123122.1778315762900.822168423710437
23117118.220013167857-1.22001316785700
24114112.1570906425211.84290935747875
25111109.0175434234881.98245657651211
26112111.9165702373760.0834297626242346
27144147.721620291083-3.72162029108301
28150151.811910439922-1.81191043992195
29149150.075689261063-1.07568926106282
30134139.533919002382-5.53391900238236
31123123.323179263295-0.323179263294890
32116119.350423394794-3.35042339479357
33117111.6614300625845.33856993741581
34111114.340650102666-3.34065010266555
35105106.660214202392-1.66021420239208
36102100.6273966670601.37260333293960
379597.5160407698656-2.51604076986555
389395.7485135048482-2.74851350484822
39124122.6057921857751.39420781422534
40130130.678554356048-0.678554356048267
41124130.019032037267-6.01903203726678
42115116.067184132535-1.06718413253455
43106105.7941734491470.205826550853416
44105102.8141759819932.18582401800698
45105101.0459239507863.95407604921364
46101102.584877892230-1.58487789222956
479597.027048397838-2.02704839783799
489391.01931835417631.98068164582367
498488.8899137796488-4.88991377964878
508784.63297450123552.36702549876446
51116114.6744780472561.32552195274377
52120122.225211922499-2.22521192249881
53117119.990703425369-2.99070342536878
54109109.496498368977-0.496498368977143
55105100.2586979288894.74130207111078
56107101.8414555459465.15854445405408
57109102.9760159711136.02398402888674
58109106.5034686290422.49653137095846
59108104.7335810414813.26641895851873
60107103.5098201609263.49017983907439


Extrapolation Forecasts of Exponential Smoothing
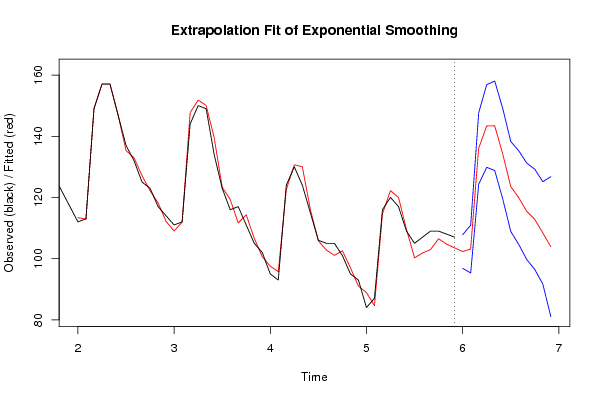
tForecast95% Lower Bound95% Upper Bound
61102.30833354220896.819429944689107.797237139727
62103.13361046301495.3302552717974110.936965654231
63136.001266842365124.316650915753147.685882768978
64143.359906637913129.848042135511156.871771140314
65143.416785436193128.797127305835158.036443566552
66134.293126366769119.51308930069149.073163432849
67123.593611567894108.894567638771138.292655497017
68119.927841497958104.612405020897135.243277975019
69115.45197782874399.6855754390117131.218380218474
70112.82413376749996.4323023235536129.215965211444
71108.41743250559291.7001157424877125.134749268697
72103.91089258133381.0390277227304126.782757439935

\begin{tabular}{lllllllll}
\hline
Extrapolation Forecasts of Exponential Smoothing \tabularnewline
t & Forecast & 95% Lower Bound & 95% Upper Bound \tabularnewline
61 & 102.308333542208 & 96.819429944689 & 107.797237139727 \tabularnewline
62 & 103.133610463014 & 95.3302552717974 & 110.936965654231 \tabularnewline
63 & 136.001266842365 & 124.316650915753 & 147.685882768978 \tabularnewline
64 & 143.359906637913 & 129.848042135511 & 156.871771140314 \tabularnewline
65 & 143.416785436193 & 128.797127305835 & 158.036443566552 \tabularnewline
66 & 134.293126366769 & 119.51308930069 & 149.073163432849 \tabularnewline
67 & 123.593611567894 & 108.894567638771 & 138.292655497017 \tabularnewline
68 & 119.927841497958 & 104.612405020897 & 135.243277975019 \tabularnewline
69 & 115.451977828743 & 99.6855754390117 & 131.218380218474 \tabularnewline
70 & 112.824133767499 & 96.4323023235536 & 129.215965211444 \tabularnewline
71 & 108.417432505592 & 91.7001157424877 & 125.134749268697 \tabularnewline
72 & 103.910892581333 & 81.0390277227304 & 126.782757439935 \tabularnewline
\hline
\end{tabular}
%Source: https://freestatistics.org/blog/index.php?pk=63945&T=3

[TABLE]
[ROW][C]Extrapolation Forecasts of Exponential Smoothing[/C][/ROW]
[ROW][C]t[/C][C]Forecast[/C][C]95% Lower Bound[/C][C]95% Upper Bound[/C][/ROW]
[ROW][C]61[/C][C]102.308333542208[/C][C]96.819429944689[/C][C]107.797237139727[/C][/ROW]
[ROW][C]62[/C][C]103.133610463014[/C][C]95.3302552717974[/C][C]110.936965654231[/C][/ROW]
[ROW][C]63[/C][C]136.001266842365[/C][C]124.316650915753[/C][C]147.685882768978[/C][/ROW]
[ROW][C]64[/C][C]143.359906637913[/C][C]129.848042135511[/C][C]156.871771140314[/C][/ROW]
[ROW][C]65[/C][C]143.416785436193[/C][C]128.797127305835[/C][C]158.036443566552[/C][/ROW]
[ROW][C]66[/C][C]134.293126366769[/C][C]119.51308930069[/C][C]149.073163432849[/C][/ROW]
[ROW][C]67[/C][C]123.593611567894[/C][C]108.894567638771[/C][C]138.292655497017[/C][/ROW]
[ROW][C]68[/C][C]119.927841497958[/C][C]104.612405020897[/C][C]135.243277975019[/C][/ROW]
[ROW][C]69[/C][C]115.451977828743[/C][C]99.6855754390117[/C][C]131.218380218474[/C][/ROW]
[ROW][C]70[/C][C]112.824133767499[/C][C]96.4323023235536[/C][C]129.215965211444[/C][/ROW]
[ROW][C]71[/C][C]108.417432505592[/C][C]91.7001157424877[/C][C]125.134749268697[/C][/ROW]
[ROW][C]72[/C][C]103.910892581333[/C][C]81.0390277227304[/C][C]126.782757439935[/C][/ROW]
[/TABLE]
Source: https://freestatistics.org/blog/index.php?pk=63945&T=3

Globally Unique Identifier (entire table): ba.freestatistics.org/blog/index.php?pk=63945&T=3

As an alternative you can also use a QR Code:  

The GUIDs for individual cells are displayed in the table below:

Extrapolation Forecasts of Exponential Smoothing
tForecast95% Lower Bound95% Upper Bound
61102.30833354220896.819429944689107.797237139727
62103.13361046301495.3302552717974110.936965654231
63136.001266842365124.316650915753147.685882768978
64143.359906637913129.848042135511156.871771140314
65143.416785436193128.797127305835158.036443566552
66134.293126366769119.51308930069149.073163432849
67123.593611567894108.894567638771138.292655497017
68119.927841497958104.612405020897135.243277975019
69115.45197782874399.6855754390117131.218380218474
70112.82413376749996.4323023235536129.215965211444
71108.41743250559291.7001157424877125.134749268697
72103.91089258133381.0390277227304126.782757439935


Parameters (Session):
par1 = FALSE ; par2 = 0.5 ; par3 = 1 ; par4 = 1 ; par5 = 12 ; par6 = 3 ; par7 = 1 ; par8 = 2 ; par9 = 1 ;
Parameters (R input):
par1 = 12 ; par2 = Triple ; par3 = multiplicative ;
R code (references can be found in the software module):
par1 <- as.numeric(par1)
if (par2 == 'Single') K <- 1
if (par2 == 'Double') K <- 2
if (par2 == 'Triple') K <- par1
nx <- length(x)
nxmK <- nx - K
x <- ts(x, frequency = par1)
if (par2 == 'Single') fit <- HoltWinters(x, gamma=0, beta=0)
if (par2 == 'Double') fit <- HoltWinters(x, gamma=0)
if (par2 == 'Triple') fit <- HoltWinters(x, seasonal=par3)
fit
myresid <- x - fit$fitted[,'xhat']
bitmap(file='test1.png')
op <- par(mfrow=c(2,1))
plot(fit,ylab='Observed (black) / Fitted (red)',main='Interpolation Fit of Exponential Smoothing')
plot(myresid,ylab='Residuals',main='Interpolation Prediction Errors')
par(op)
dev.off()
bitmap(file='test2.png')
p <- predict(fit, par1, prediction.interval=TRUE)
np <- length(p[,1])
plot(fit,p,ylab='Observed (black) / Fitted (red)',main='Extrapolation Fit of Exponential Smoothing')
dev.off()
bitmap(file='test3.png')
op <- par(mfrow = c(2,2))
acf(as.numeric(myresid),lag.max = nx/2,main='Residual ACF')
spectrum(myresid,main='Residals Periodogram')
cpgram(myresid,main='Residal Cumulative Periodogram')
qqnorm(myresid,main='Residual Normal QQ Plot')
qqline(myresid)
par(op)
dev.off()
load(file='createtable')
a<-table.start()
a<-table.row.start(a)
a<-table.element(a,'Estimated Parameters of Exponential Smoothing',2,TRUE)
a<-table.row.end(a)
a<-table.row.start(a)
a<-table.element(a,'Parameter',header=TRUE)
a<-table.element(a,'Value',header=TRUE)
a<-table.row.end(a)
a<-table.row.start(a)
a<-table.element(a,'alpha',header=TRUE)
a<-table.element(a,fit$alpha)
a<-table.row.end(a)
a<-table.row.start(a)
a<-table.element(a,'beta',header=TRUE)
a<-table.element(a,fit$beta)
a<-table.row.end(a)
a<-table.row.start(a)
a<-table.element(a,'gamma',header=TRUE)
a<-table.element(a,fit$gamma)
a<-table.row.end(a)
a<-table.end(a)
table.save(a,file='mytable.tab')
a<-table.start()
a<-table.row.start(a)
a<-table.element(a,'Interpolation Forecasts of Exponential Smoothing',4,TRUE)
a<-table.row.end(a)
a<-table.row.start(a)
a<-table.element(a,'t',header=TRUE)
a<-table.element(a,'Observed',header=TRUE)
a<-table.element(a,'Fitted',header=TRUE)
a<-table.element(a,'Residuals',header=TRUE)
a<-table.row.end(a)
for (i in 1:nxmK) {
a<-table.row.start(a)
a<-table.element(a,i+K,header=TRUE)
a<-table.element(a,x[i+K])
a<-table.element(a,fit$fitted[i,'xhat'])
a<-table.element(a,myresid[i])
a<-table.row.end(a)
}
a<-table.end(a)
table.save(a,file='mytable1.tab')
a<-table.start()
a<-table.row.start(a)
a<-table.element(a,'Extrapolation Forecasts of Exponential Smoothing',4,TRUE)
a<-table.row.end(a)
a<-table.row.start(a)
a<-table.element(a,'t',header=TRUE)
a<-table.element(a,'Forecast',header=TRUE)
a<-table.element(a,'95% Lower Bound',header=TRUE)
a<-table.element(a,'95% Upper Bound',header=TRUE)
a<-table.row.end(a)
for (i in 1:np) {
a<-table.row.start(a)
a<-table.element(a,nx+i,header=TRUE)
a<-table.element(a,p[i,'fit'])
a<-table.element(a,p[i,'lwr'])
a<-table.element(a,p[i,'upr'])
a<-table.row.end(a)
}
a<-table.end(a)
table.save(a,file='mytable2.tab')