Free Statistics

of Irreproducible Research!

Author's title

Author*The author of this computation has been verified*
R Software Modulerwasp_exponentialsmoothing.wasp
Title produced by softwareExponential Smoothing
Date of computationFri, 04 Dec 2009 10:42:19 -0700
Cite this page as followsStatistical Computations at FreeStatistics.org, Office for Research Development and Education, URL https://freestatistics.org/blog/index.php?v=date/2009/Dec/04/t1259948572rl6a084c1tujrhr.htm/, Retrieved Sat, 27 Apr 2024 18:34:44 +0000
Statistical Computations at FreeStatistics.org, Office for Research Development and Education, URL https://freestatistics.org/blog/index.php?pk=63964, Retrieved Sat, 27 Apr 2024 18:34:44 +0000
QR Codes:

Original text written by user:
IsPrivate?No (this computation is public)
User-defined keywords
Estimated Impact70
Family? (F = Feedback message, R = changed R code, M = changed R Module, P = changed Parameters, D = changed Data)
-       [Exponential Smoothing] [] [2009-12-04 17:42:19] [477c9cb8e7bda18f2375c22a66069c90] [Current]
Feedback Forum

Post a new message
Dataseries X:
92.9
107.7
103.5
91.1
79.8
71.9
82.9
90.1
100.7
90.7
108.8
44.1
93.6
107.4
96.5
93.6
76.5
76.7
84
103.3
88.5
99
105.9
44.7
94
107.1
104.8
102.5
77.7
85.2
91.3
106.5
92.4
97.5
107
51.1
98.6
102.2
114.3
99.4
72.5
92.3
99.4
85.9
109.4
97.6
104.7
56.9
86.7
108.5
103.4
86.2
71
75.9
87.1
102
88.5
87.8
100.8
50.6
85.9


Summary of computational transaction
Raw Inputview raw input (R code)
Raw Outputview raw output of R engine
Computing time1 seconds
R Server'Gwilym Jenkins' @ 72.249.127.135

\begin{tabular}{lllllllll}
\hline
Summary of computational transaction \tabularnewline
Raw Input & view raw input (R code)  \tabularnewline
Raw Output & view raw output of R engine  \tabularnewline
Computing time & 1 seconds \tabularnewline
R Server & 'Gwilym Jenkins' @ 72.249.127.135 \tabularnewline
\hline
\end{tabular}
%Source: https://freestatistics.org/blog/index.php?pk=63964&T=0

[TABLE]
[ROW][C]Summary of computational transaction[/C][/ROW]
[ROW][C]Raw Input[/C][C]view raw input (R code) [/C][/ROW]
[ROW][C]Raw Output[/C][C]view raw output of R engine [/C][/ROW]
[ROW][C]Computing time[/C][C]1 seconds[/C][/ROW]
[ROW][C]R Server[/C][C]'Gwilym Jenkins' @ 72.249.127.135[/C][/ROW]
[/TABLE]
Source: https://freestatistics.org/blog/index.php?pk=63964&T=0

Globally Unique Identifier (entire table): ba.freestatistics.org/blog/index.php?pk=63964&T=0

As an alternative you can also use a QR Code:  

The GUIDs for individual cells are displayed in the table below:

Summary of computational transaction
Raw Inputview raw input (R code)
Raw Outputview raw output of R engine
Computing time1 seconds
R Server'Gwilym Jenkins' @ 72.249.127.135


Estimated Parameters of Exponential Smoothing
ParameterValue
alpha0.0891527488222475
beta0
gamma0.387141299341678

\begin{tabular}{lllllllll}
\hline
Estimated Parameters of Exponential Smoothing \tabularnewline
Parameter & Value \tabularnewline
alpha & 0.0891527488222475 \tabularnewline
beta & 0 \tabularnewline
gamma & 0.387141299341678 \tabularnewline
\hline
\end{tabular}
%Source: https://freestatistics.org/blog/index.php?pk=63964&T=1

[TABLE]
[ROW][C]Estimated Parameters of Exponential Smoothing[/C][/ROW]
[ROW][C]Parameter[/C][C]Value[/C][/ROW]
[ROW][C]alpha[/C][C]0.0891527488222475[/C][/ROW]
[ROW][C]beta[/C][C]0[/C][/ROW]
[ROW][C]gamma[/C][C]0.387141299341678[/C][/ROW]
[/TABLE]
Source: https://freestatistics.org/blog/index.php?pk=63964&T=1

Globally Unique Identifier (entire table): ba.freestatistics.org/blog/index.php?pk=63964&T=1

As an alternative you can also use a QR Code:  

The GUIDs for individual cells are displayed in the table below:

Estimated Parameters of Exponential Smoothing
ParameterValue
alpha0.0891527488222475
beta0
gamma0.387141299341678


Interpolation Forecasts of Exponential Smoothing
tObservedFittedResiduals
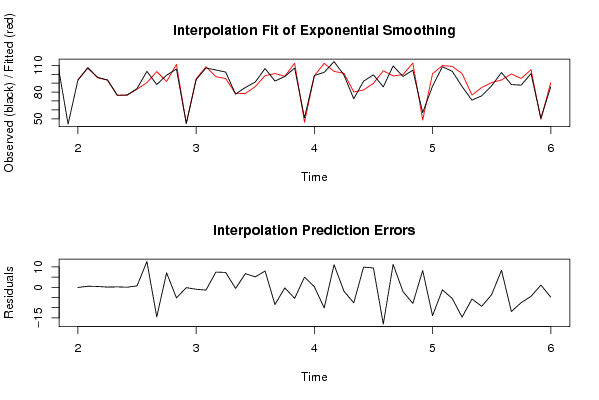
1393.693.6828978169662-0.082897816966252
14107.4106.853523549830.546476450170047
1596.596.08474955433880.415250445661215
1693.693.47809724496410.121902755035862
1776.576.27744612291640.222553877083556
1876.776.64014965339080.0598503466091529
198483.2848681506390.715131849361029
20103.390.642695462771512.6573045372285
2188.5103.001433309035-14.5014333090347
229991.87610395621277.12389604378734
23105.9111.102212407489-5.20221240748862
2444.744.8489009079516-0.148900907951578
259494.9425007726662-0.94250077266625
26107.1108.430680469889-1.33068046988868
27104.897.32388351520137.47611648479868
28102.595.19279759688347.30720240311659
2977.778.2420728597341-0.542072859734134
3085.278.48457275116626.71542724883379
3191.386.16799654094245.1320034590576
32106.598.4873895797518.01261042024896
3392.4100.836755634577-8.43675563457685
3497.597.777473127026-0.277473127025885
35107112.395987350937-5.39598735093736
3651.146.07618946801385.02381053198618
3798.698.28493167602850.315068323971445
38102.2112.282634052712-10.0826340527121
39114.3103.22115046985411.0788495301457
4099.4101.229113249806-1.82911324980645
4172.580.1467947217325-7.64679472173252
4292.382.34906729401059.95093270598949
4399.489.89434865849069.50565134150943
4485.9103.932416067746-18.0324160677456
45109.498.124522598560611.2754774014394
4697.699.7100950694742-2.11009506947426
47104.7112.595805599851-7.89580559985058
4856.948.64729348665798.25270651334211
4986.7100.609831659968-13.9098316599678
50108.5109.742063010662-1.24206301066177
51103.4108.880110355078-5.48011035507831
5286.2100.839641963244-14.6396419632436
537176.744148221227-5.74414822122696
5475.985.2212656499404-9.32126564994044
5587.190.6863277515733-3.58632775157328
5610293.61565401996948.38434598003062
5788.5100.356814159878-11.856814159878
5887.895.3141764528612-7.51417645286118
59100.8105.202842870332-4.4028428703316
6050.649.4866744761011.11332552389902
6185.990.6958197761224-4.79581977612244

\begin{tabular}{lllllllll}
\hline
Interpolation Forecasts of Exponential Smoothing \tabularnewline
t & Observed & Fitted & Residuals \tabularnewline
13 & 93.6 & 93.6828978169662 & -0.082897816966252 \tabularnewline
14 & 107.4 & 106.85352354983 & 0.546476450170047 \tabularnewline
15 & 96.5 & 96.0847495543388 & 0.415250445661215 \tabularnewline
16 & 93.6 & 93.4780972449641 & 0.121902755035862 \tabularnewline
17 & 76.5 & 76.2774461229164 & 0.222553877083556 \tabularnewline
18 & 76.7 & 76.6401496533908 & 0.0598503466091529 \tabularnewline
19 & 84 & 83.284868150639 & 0.715131849361029 \tabularnewline
20 & 103.3 & 90.6426954627715 & 12.6573045372285 \tabularnewline
21 & 88.5 & 103.001433309035 & -14.5014333090347 \tabularnewline
22 & 99 & 91.8761039562127 & 7.12389604378734 \tabularnewline
23 & 105.9 & 111.102212407489 & -5.20221240748862 \tabularnewline
24 & 44.7 & 44.8489009079516 & -0.148900907951578 \tabularnewline
25 & 94 & 94.9425007726662 & -0.94250077266625 \tabularnewline
26 & 107.1 & 108.430680469889 & -1.33068046988868 \tabularnewline
27 & 104.8 & 97.3238835152013 & 7.47611648479868 \tabularnewline
28 & 102.5 & 95.1927975968834 & 7.30720240311659 \tabularnewline
29 & 77.7 & 78.2420728597341 & -0.542072859734134 \tabularnewline
30 & 85.2 & 78.4845727511662 & 6.71542724883379 \tabularnewline
31 & 91.3 & 86.1679965409424 & 5.1320034590576 \tabularnewline
32 & 106.5 & 98.487389579751 & 8.01261042024896 \tabularnewline
33 & 92.4 & 100.836755634577 & -8.43675563457685 \tabularnewline
34 & 97.5 & 97.777473127026 & -0.277473127025885 \tabularnewline
35 & 107 & 112.395987350937 & -5.39598735093736 \tabularnewline
36 & 51.1 & 46.0761894680138 & 5.02381053198618 \tabularnewline
37 & 98.6 & 98.2849316760285 & 0.315068323971445 \tabularnewline
38 & 102.2 & 112.282634052712 & -10.0826340527121 \tabularnewline
39 & 114.3 & 103.221150469854 & 11.0788495301457 \tabularnewline
40 & 99.4 & 101.229113249806 & -1.82911324980645 \tabularnewline
41 & 72.5 & 80.1467947217325 & -7.64679472173252 \tabularnewline
42 & 92.3 & 82.3490672940105 & 9.95093270598949 \tabularnewline
43 & 99.4 & 89.8943486584906 & 9.50565134150943 \tabularnewline
44 & 85.9 & 103.932416067746 & -18.0324160677456 \tabularnewline
45 & 109.4 & 98.1245225985606 & 11.2754774014394 \tabularnewline
46 & 97.6 & 99.7100950694742 & -2.11009506947426 \tabularnewline
47 & 104.7 & 112.595805599851 & -7.89580559985058 \tabularnewline
48 & 56.9 & 48.6472934866579 & 8.25270651334211 \tabularnewline
49 & 86.7 & 100.609831659968 & -13.9098316599678 \tabularnewline
50 & 108.5 & 109.742063010662 & -1.24206301066177 \tabularnewline
51 & 103.4 & 108.880110355078 & -5.48011035507831 \tabularnewline
52 & 86.2 & 100.839641963244 & -14.6396419632436 \tabularnewline
53 & 71 & 76.744148221227 & -5.74414822122696 \tabularnewline
54 & 75.9 & 85.2212656499404 & -9.32126564994044 \tabularnewline
55 & 87.1 & 90.6863277515733 & -3.58632775157328 \tabularnewline
56 & 102 & 93.6156540199694 & 8.38434598003062 \tabularnewline
57 & 88.5 & 100.356814159878 & -11.856814159878 \tabularnewline
58 & 87.8 & 95.3141764528612 & -7.51417645286118 \tabularnewline
59 & 100.8 & 105.202842870332 & -4.4028428703316 \tabularnewline
60 & 50.6 & 49.486674476101 & 1.11332552389902 \tabularnewline
61 & 85.9 & 90.6958197761224 & -4.79581977612244 \tabularnewline
\hline
\end{tabular}
%Source: https://freestatistics.org/blog/index.php?pk=63964&T=2

[TABLE]
[ROW][C]Interpolation Forecasts of Exponential Smoothing[/C][/ROW]
[ROW][C]t[/C][C]Observed[/C][C]Fitted[/C][C]Residuals[/C][/ROW]
[ROW][C]13[/C][C]93.6[/C][C]93.6828978169662[/C][C]-0.082897816966252[/C][/ROW]
[ROW][C]14[/C][C]107.4[/C][C]106.85352354983[/C][C]0.546476450170047[/C][/ROW]
[ROW][C]15[/C][C]96.5[/C][C]96.0847495543388[/C][C]0.415250445661215[/C][/ROW]
[ROW][C]16[/C][C]93.6[/C][C]93.4780972449641[/C][C]0.121902755035862[/C][/ROW]
[ROW][C]17[/C][C]76.5[/C][C]76.2774461229164[/C][C]0.222553877083556[/C][/ROW]
[ROW][C]18[/C][C]76.7[/C][C]76.6401496533908[/C][C]0.0598503466091529[/C][/ROW]
[ROW][C]19[/C][C]84[/C][C]83.284868150639[/C][C]0.715131849361029[/C][/ROW]
[ROW][C]20[/C][C]103.3[/C][C]90.6426954627715[/C][C]12.6573045372285[/C][/ROW]
[ROW][C]21[/C][C]88.5[/C][C]103.001433309035[/C][C]-14.5014333090347[/C][/ROW]
[ROW][C]22[/C][C]99[/C][C]91.8761039562127[/C][C]7.12389604378734[/C][/ROW]
[ROW][C]23[/C][C]105.9[/C][C]111.102212407489[/C][C]-5.20221240748862[/C][/ROW]
[ROW][C]24[/C][C]44.7[/C][C]44.8489009079516[/C][C]-0.148900907951578[/C][/ROW]
[ROW][C]25[/C][C]94[/C][C]94.9425007726662[/C][C]-0.94250077266625[/C][/ROW]
[ROW][C]26[/C][C]107.1[/C][C]108.430680469889[/C][C]-1.33068046988868[/C][/ROW]
[ROW][C]27[/C][C]104.8[/C][C]97.3238835152013[/C][C]7.47611648479868[/C][/ROW]
[ROW][C]28[/C][C]102.5[/C][C]95.1927975968834[/C][C]7.30720240311659[/C][/ROW]
[ROW][C]29[/C][C]77.7[/C][C]78.2420728597341[/C][C]-0.542072859734134[/C][/ROW]
[ROW][C]30[/C][C]85.2[/C][C]78.4845727511662[/C][C]6.71542724883379[/C][/ROW]
[ROW][C]31[/C][C]91.3[/C][C]86.1679965409424[/C][C]5.1320034590576[/C][/ROW]
[ROW][C]32[/C][C]106.5[/C][C]98.487389579751[/C][C]8.01261042024896[/C][/ROW]
[ROW][C]33[/C][C]92.4[/C][C]100.836755634577[/C][C]-8.43675563457685[/C][/ROW]
[ROW][C]34[/C][C]97.5[/C][C]97.777473127026[/C][C]-0.277473127025885[/C][/ROW]
[ROW][C]35[/C][C]107[/C][C]112.395987350937[/C][C]-5.39598735093736[/C][/ROW]
[ROW][C]36[/C][C]51.1[/C][C]46.0761894680138[/C][C]5.02381053198618[/C][/ROW]
[ROW][C]37[/C][C]98.6[/C][C]98.2849316760285[/C][C]0.315068323971445[/C][/ROW]
[ROW][C]38[/C][C]102.2[/C][C]112.282634052712[/C][C]-10.0826340527121[/C][/ROW]
[ROW][C]39[/C][C]114.3[/C][C]103.221150469854[/C][C]11.0788495301457[/C][/ROW]
[ROW][C]40[/C][C]99.4[/C][C]101.229113249806[/C][C]-1.82911324980645[/C][/ROW]
[ROW][C]41[/C][C]72.5[/C][C]80.1467947217325[/C][C]-7.64679472173252[/C][/ROW]
[ROW][C]42[/C][C]92.3[/C][C]82.3490672940105[/C][C]9.95093270598949[/C][/ROW]
[ROW][C]43[/C][C]99.4[/C][C]89.8943486584906[/C][C]9.50565134150943[/C][/ROW]
[ROW][C]44[/C][C]85.9[/C][C]103.932416067746[/C][C]-18.0324160677456[/C][/ROW]
[ROW][C]45[/C][C]109.4[/C][C]98.1245225985606[/C][C]11.2754774014394[/C][/ROW]
[ROW][C]46[/C][C]97.6[/C][C]99.7100950694742[/C][C]-2.11009506947426[/C][/ROW]
[ROW][C]47[/C][C]104.7[/C][C]112.595805599851[/C][C]-7.89580559985058[/C][/ROW]
[ROW][C]48[/C][C]56.9[/C][C]48.6472934866579[/C][C]8.25270651334211[/C][/ROW]
[ROW][C]49[/C][C]86.7[/C][C]100.609831659968[/C][C]-13.9098316599678[/C][/ROW]
[ROW][C]50[/C][C]108.5[/C][C]109.742063010662[/C][C]-1.24206301066177[/C][/ROW]
[ROW][C]51[/C][C]103.4[/C][C]108.880110355078[/C][C]-5.48011035507831[/C][/ROW]
[ROW][C]52[/C][C]86.2[/C][C]100.839641963244[/C][C]-14.6396419632436[/C][/ROW]
[ROW][C]53[/C][C]71[/C][C]76.744148221227[/C][C]-5.74414822122696[/C][/ROW]
[ROW][C]54[/C][C]75.9[/C][C]85.2212656499404[/C][C]-9.32126564994044[/C][/ROW]
[ROW][C]55[/C][C]87.1[/C][C]90.6863277515733[/C][C]-3.58632775157328[/C][/ROW]
[ROW][C]56[/C][C]102[/C][C]93.6156540199694[/C][C]8.38434598003062[/C][/ROW]
[ROW][C]57[/C][C]88.5[/C][C]100.356814159878[/C][C]-11.856814159878[/C][/ROW]
[ROW][C]58[/C][C]87.8[/C][C]95.3141764528612[/C][C]-7.51417645286118[/C][/ROW]
[ROW][C]59[/C][C]100.8[/C][C]105.202842870332[/C][C]-4.4028428703316[/C][/ROW]
[ROW][C]60[/C][C]50.6[/C][C]49.486674476101[/C][C]1.11332552389902[/C][/ROW]
[ROW][C]61[/C][C]85.9[/C][C]90.6958197761224[/C][C]-4.79581977612244[/C][/ROW]
[/TABLE]
Source: https://freestatistics.org/blog/index.php?pk=63964&T=2

Globally Unique Identifier (entire table): ba.freestatistics.org/blog/index.php?pk=63964&T=2

As an alternative you can also use a QR Code:  

The GUIDs for individual cells are displayed in the table below:

Interpolation Forecasts of Exponential Smoothing
tObservedFittedResiduals
1393.693.6828978169662-0.082897816966252
14107.4106.853523549830.546476450170047
1596.596.08474955433880.415250445661215
1693.693.47809724496410.121902755035862
1776.576.27744612291640.222553877083556
1876.776.64014965339080.0598503466091529
198483.2848681506390.715131849361029
20103.390.642695462771512.6573045372285
2188.5103.001433309035-14.5014333090347
229991.87610395621277.12389604378734
23105.9111.102212407489-5.20221240748862
2444.744.8489009079516-0.148900907951578
259494.9425007726662-0.94250077266625
26107.1108.430680469889-1.33068046988868
27104.897.32388351520137.47611648479868
28102.595.19279759688347.30720240311659
2977.778.2420728597341-0.542072859734134
3085.278.48457275116626.71542724883379
3191.386.16799654094245.1320034590576
32106.598.4873895797518.01261042024896
3392.4100.836755634577-8.43675563457685
3497.597.777473127026-0.277473127025885
35107112.395987350937-5.39598735093736
3651.146.07618946801385.02381053198618
3798.698.28493167602850.315068323971445
38102.2112.282634052712-10.0826340527121
39114.3103.22115046985411.0788495301457
4099.4101.229113249806-1.82911324980645
4172.580.1467947217325-7.64679472173252
4292.382.34906729401059.95093270598949
4399.489.89434865849069.50565134150943
4485.9103.932416067746-18.0324160677456
45109.498.124522598560611.2754774014394
4697.699.7100950694742-2.11009506947426
47104.7112.595805599851-7.89580559985058
4856.948.64729348665798.25270651334211
4986.7100.609831659968-13.9098316599678
50108.5109.742063010662-1.24206301066177
51103.4108.880110355078-5.48011035507831
5286.2100.839641963244-14.6396419632436
537176.744148221227-5.74414822122696
5475.985.2212656499404-9.32126564994044
5587.190.6863277515733-3.58632775157328
5610293.61565401996948.38434598003062
5788.5100.356814159878-11.856814159878
5887.895.3141764528612-7.51417645286118
59100.8105.202842870332-4.4028428703316
6050.649.4866744761011.11332552389902
6185.990.6958197761224-4.79581977612244


Extrapolation Forecasts of Exponential Smoothing
tForecast95% Lower Bound95% Upper Bound
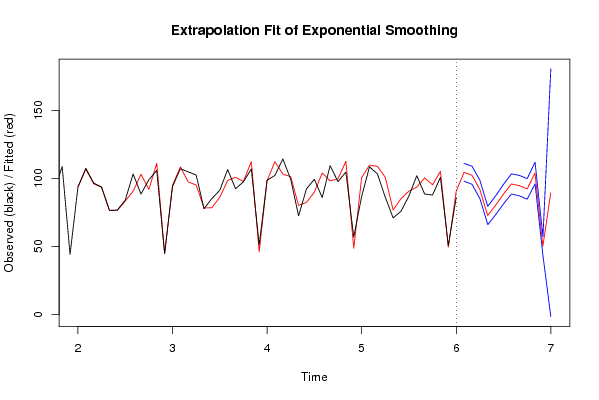
62104.45159605944897.9257210369499110.977471081946
63102.29861406685795.6466961243565108.950532009358
6491.875957599285485.143837934550798.60807726402
6572.73052799448965.993836880472379.4672191085057
6680.274188931190973.338974716287.2094031461818
6788.503800510570881.335868022230195.6717329989115
6895.901128573394888.4898251123848103.312432034405
6994.731126979339587.227866820326102.234387138353
7092.268502830090584.704266302662999.8327393575181
71103.95285107534495.995044678344111.910657472345
7250.213975998658543.298574983618257.1293770136988
7389.4156253643006-1.62654105975824180.457791788359

\begin{tabular}{lllllllll}
\hline
Extrapolation Forecasts of Exponential Smoothing \tabularnewline
t & Forecast & 95% Lower Bound & 95% Upper Bound \tabularnewline
62 & 104.451596059448 & 97.9257210369499 & 110.977471081946 \tabularnewline
63 & 102.298614066857 & 95.6466961243565 & 108.950532009358 \tabularnewline
64 & 91.8759575992854 & 85.1438379345507 & 98.60807726402 \tabularnewline
65 & 72.730527994489 & 65.9938368804723 & 79.4672191085057 \tabularnewline
66 & 80.2741889311909 & 73.3389747162 & 87.2094031461818 \tabularnewline
67 & 88.5038005105708 & 81.3358680222301 & 95.6717329989115 \tabularnewline
68 & 95.9011285733948 & 88.4898251123848 & 103.312432034405 \tabularnewline
69 & 94.7311269793395 & 87.227866820326 & 102.234387138353 \tabularnewline
70 & 92.2685028300905 & 84.7042663026629 & 99.8327393575181 \tabularnewline
71 & 103.952851075344 & 95.995044678344 & 111.910657472345 \tabularnewline
72 & 50.2139759986585 & 43.2985749836182 & 57.1293770136988 \tabularnewline
73 & 89.4156253643006 & -1.62654105975824 & 180.457791788359 \tabularnewline
\hline
\end{tabular}
%Source: https://freestatistics.org/blog/index.php?pk=63964&T=3

[TABLE]
[ROW][C]Extrapolation Forecasts of Exponential Smoothing[/C][/ROW]
[ROW][C]t[/C][C]Forecast[/C][C]95% Lower Bound[/C][C]95% Upper Bound[/C][/ROW]
[ROW][C]62[/C][C]104.451596059448[/C][C]97.9257210369499[/C][C]110.977471081946[/C][/ROW]
[ROW][C]63[/C][C]102.298614066857[/C][C]95.6466961243565[/C][C]108.950532009358[/C][/ROW]
[ROW][C]64[/C][C]91.8759575992854[/C][C]85.1438379345507[/C][C]98.60807726402[/C][/ROW]
[ROW][C]65[/C][C]72.730527994489[/C][C]65.9938368804723[/C][C]79.4672191085057[/C][/ROW]
[ROW][C]66[/C][C]80.2741889311909[/C][C]73.3389747162[/C][C]87.2094031461818[/C][/ROW]
[ROW][C]67[/C][C]88.5038005105708[/C][C]81.3358680222301[/C][C]95.6717329989115[/C][/ROW]
[ROW][C]68[/C][C]95.9011285733948[/C][C]88.4898251123848[/C][C]103.312432034405[/C][/ROW]
[ROW][C]69[/C][C]94.7311269793395[/C][C]87.227866820326[/C][C]102.234387138353[/C][/ROW]
[ROW][C]70[/C][C]92.2685028300905[/C][C]84.7042663026629[/C][C]99.8327393575181[/C][/ROW]
[ROW][C]71[/C][C]103.952851075344[/C][C]95.995044678344[/C][C]111.910657472345[/C][/ROW]
[ROW][C]72[/C][C]50.2139759986585[/C][C]43.2985749836182[/C][C]57.1293770136988[/C][/ROW]
[ROW][C]73[/C][C]89.4156253643006[/C][C]-1.62654105975824[/C][C]180.457791788359[/C][/ROW]
[/TABLE]
Source: https://freestatistics.org/blog/index.php?pk=63964&T=3

Globally Unique Identifier (entire table): ba.freestatistics.org/blog/index.php?pk=63964&T=3

As an alternative you can also use a QR Code:  

The GUIDs for individual cells are displayed in the table below:

Extrapolation Forecasts of Exponential Smoothing
tForecast95% Lower Bound95% Upper Bound
62104.45159605944897.9257210369499110.977471081946
63102.29861406685795.6466961243565108.950532009358
6491.875957599285485.143837934550798.60807726402
6572.73052799448965.993836880472379.4672191085057
6680.274188931190973.338974716287.2094031461818
6788.503800510570881.335868022230195.6717329989115
6895.901128573394888.4898251123848103.312432034405
6994.731126979339587.227866820326102.234387138353
7092.268502830090584.704266302662999.8327393575181
71103.95285107534495.995044678344111.910657472345
7250.213975998658543.298574983618257.1293770136988
7389.4156253643006-1.62654105975824180.457791788359


Parameters (Session):
par1 = 12 ; par2 = Triple ; par3 = multiplicative ;
Parameters (R input):
par1 = 12 ; par2 = Triple ; par3 = multiplicative ;
R code (references can be found in the software module):
par1 <- as.numeric(par1)
if (par2 == 'Single') K <- 1
if (par2 == 'Double') K <- 2
if (par2 == 'Triple') K <- par1
nx <- length(x)
nxmK <- nx - K
x <- ts(x, frequency = par1)
if (par2 == 'Single') fit <- HoltWinters(x, gamma=0, beta=0)
if (par2 == 'Double') fit <- HoltWinters(x, gamma=0)
if (par2 == 'Triple') fit <- HoltWinters(x, seasonal=par3)
fit
myresid <- x - fit$fitted[,'xhat']
bitmap(file='test1.png')
op <- par(mfrow=c(2,1))
plot(fit,ylab='Observed (black) / Fitted (red)',main='Interpolation Fit of Exponential Smoothing')
plot(myresid,ylab='Residuals',main='Interpolation Prediction Errors')
par(op)
dev.off()
bitmap(file='test2.png')
p <- predict(fit, par1, prediction.interval=TRUE)
np <- length(p[,1])
plot(fit,p,ylab='Observed (black) / Fitted (red)',main='Extrapolation Fit of Exponential Smoothing')
dev.off()
bitmap(file='test3.png')
op <- par(mfrow = c(2,2))
acf(as.numeric(myresid),lag.max = nx/2,main='Residual ACF')
spectrum(myresid,main='Residals Periodogram')
cpgram(myresid,main='Residal Cumulative Periodogram')
qqnorm(myresid,main='Residual Normal QQ Plot')
qqline(myresid)
par(op)
dev.off()
load(file='createtable')
a<-table.start()
a<-table.row.start(a)
a<-table.element(a,'Estimated Parameters of Exponential Smoothing',2,TRUE)
a<-table.row.end(a)
a<-table.row.start(a)
a<-table.element(a,'Parameter',header=TRUE)
a<-table.element(a,'Value',header=TRUE)
a<-table.row.end(a)
a<-table.row.start(a)
a<-table.element(a,'alpha',header=TRUE)
a<-table.element(a,fit$alpha)
a<-table.row.end(a)
a<-table.row.start(a)
a<-table.element(a,'beta',header=TRUE)
a<-table.element(a,fit$beta)
a<-table.row.end(a)
a<-table.row.start(a)
a<-table.element(a,'gamma',header=TRUE)
a<-table.element(a,fit$gamma)
a<-table.row.end(a)
a<-table.end(a)
table.save(a,file='mytable.tab')
a<-table.start()
a<-table.row.start(a)
a<-table.element(a,'Interpolation Forecasts of Exponential Smoothing',4,TRUE)
a<-table.row.end(a)
a<-table.row.start(a)
a<-table.element(a,'t',header=TRUE)
a<-table.element(a,'Observed',header=TRUE)
a<-table.element(a,'Fitted',header=TRUE)
a<-table.element(a,'Residuals',header=TRUE)
a<-table.row.end(a)
for (i in 1:nxmK) {
a<-table.row.start(a)
a<-table.element(a,i+K,header=TRUE)
a<-table.element(a,x[i+K])
a<-table.element(a,fit$fitted[i,'xhat'])
a<-table.element(a,myresid[i])
a<-table.row.end(a)
}
a<-table.end(a)
table.save(a,file='mytable1.tab')
a<-table.start()
a<-table.row.start(a)
a<-table.element(a,'Extrapolation Forecasts of Exponential Smoothing',4,TRUE)
a<-table.row.end(a)
a<-table.row.start(a)
a<-table.element(a,'t',header=TRUE)
a<-table.element(a,'Forecast',header=TRUE)
a<-table.element(a,'95% Lower Bound',header=TRUE)
a<-table.element(a,'95% Upper Bound',header=TRUE)
a<-table.row.end(a)
for (i in 1:np) {
a<-table.row.start(a)
a<-table.element(a,nx+i,header=TRUE)
a<-table.element(a,p[i,'fit'])
a<-table.element(a,p[i,'lwr'])
a<-table.element(a,p[i,'upr'])
a<-table.row.end(a)
}
a<-table.end(a)
table.save(a,file='mytable2.tab')