Free Statistics

of Irreproducible Research!

Author's title

Author*The author of this computation has been verified*
R Software Modulerwasp_autocorrelation.wasp
Title produced by software(Partial) Autocorrelation Function
Date of computationFri, 04 Dec 2009 10:43:26 -0700
Cite this page as followsStatistical Computations at FreeStatistics.org, Office for Research Development and Education, URL https://freestatistics.org/blog/index.php?v=date/2009/Dec/04/t1259948657g8upbrzskhh5vp1.htm/, Retrieved Sun, 28 Apr 2024 11:51:43 +0000
Statistical Computations at FreeStatistics.org, Office for Research Development and Education, URL https://freestatistics.org/blog/index.php?pk=63966, Retrieved Sun, 28 Apr 2024 11:51:43 +0000
QR Codes:

Original text written by user:
IsPrivate?No (this computation is public)
User-defined keywords
Estimated Impact77
Family? (F = Feedback message, R = changed R code, M = changed R Module, P = changed Parameters, D = changed Data)
-       [(Partial) Autocorrelation Function] [] [2009-12-04 17:43:26] [99bf2a1e962091d45abf4c2600a412f9] [Current]
Feedback Forum

Post a new message
Dataseries X:
12.610
10.862
52.929
56.902
81.776
87.876
82.103
72.846
60.632
33.521
15.342
7.758
8.668
13.082
38.157
58.263
81.153
88.476
72.329
75.845
61.108
37.665
12.755
2.793
12.935
19.533
33.404
52.074
70.735
69.702
61.656
82.993
53.990
32.283
15.686
2.713
12.842
19.244
48.488
54.464
84.192
84.458
85.793
75.163
68.212
49.233
24.302
5.402
15.058
33.559
70.358
85.934
94.452
129.305
113.882
107.256
94.274
57.842
26.611
14.521


Summary of computational transaction
Raw Inputview raw input (R code)
Raw Outputview raw output of R engine
Computing time3 seconds
R Server'Gwilym Jenkins' @ 72.249.127.135

\begin{tabular}{lllllllll}
\hline
Summary of computational transaction \tabularnewline
Raw Input & view raw input (R code)  \tabularnewline
Raw Output & view raw output of R engine  \tabularnewline
Computing time & 3 seconds \tabularnewline
R Server & 'Gwilym Jenkins' @ 72.249.127.135 \tabularnewline
\hline
\end{tabular}
%Source: https://freestatistics.org/blog/index.php?pk=63966&T=0

[TABLE]
[ROW][C]Summary of computational transaction[/C][/ROW]
[ROW][C]Raw Input[/C][C]view raw input (R code) [/C][/ROW]
[ROW][C]Raw Output[/C][C]view raw output of R engine [/C][/ROW]
[ROW][C]Computing time[/C][C]3 seconds[/C][/ROW]
[ROW][C]R Server[/C][C]'Gwilym Jenkins' @ 72.249.127.135[/C][/ROW]
[/TABLE]
Source: https://freestatistics.org/blog/index.php?pk=63966&T=0

Globally Unique Identifier (entire table): ba.freestatistics.org/blog/index.php?pk=63966&T=0

As an alternative you can also use a QR Code:  

The GUIDs for individual cells are displayed in the table below:

Summary of computational transaction
Raw Inputview raw input (R code)
Raw Outputview raw output of R engine
Computing time3 seconds
R Server'Gwilym Jenkins' @ 72.249.127.135


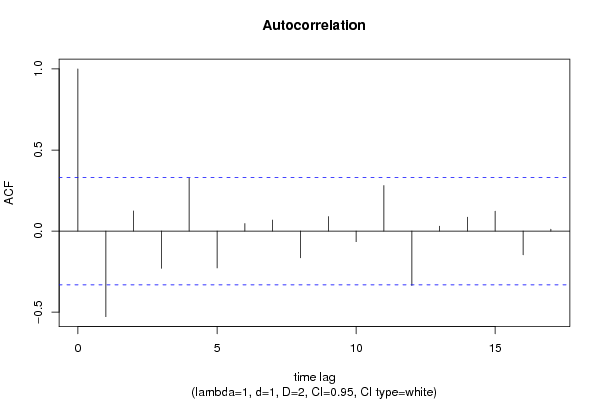
Autocorrelation Function
Time lag kACF(k)T-STATP-value
1-0.527377-3.120.001806
20.1242420.7350.23361
3-0.229307-1.35660.091798
40.3259721.92850.030969
5-0.226635-1.34080.094313
60.046870.27730.391596
70.0684860.40520.34391
8-0.164557-0.97350.168484
90.0894950.52950.299916
10-0.064964-0.38430.351528
110.2811821.66350.052572
12-0.334859-1.98110.027743
130.0303620.17960.429242
140.0856240.50660.307821
150.122630.72550.236488
16-0.146006-0.86380.196793
170.0117980.06980.472375

\begin{tabular}{lllllllll}
\hline
Autocorrelation Function \tabularnewline
Time lag k & ACF(k) & T-STAT & P-value \tabularnewline
1 & -0.527377 & -3.12 & 0.001806 \tabularnewline
2 & 0.124242 & 0.735 & 0.23361 \tabularnewline
3 & -0.229307 & -1.3566 & 0.091798 \tabularnewline
4 & 0.325972 & 1.9285 & 0.030969 \tabularnewline
5 & -0.226635 & -1.3408 & 0.094313 \tabularnewline
6 & 0.04687 & 0.2773 & 0.391596 \tabularnewline
7 & 0.068486 & 0.4052 & 0.34391 \tabularnewline
8 & -0.164557 & -0.9735 & 0.168484 \tabularnewline
9 & 0.089495 & 0.5295 & 0.299916 \tabularnewline
10 & -0.064964 & -0.3843 & 0.351528 \tabularnewline
11 & 0.281182 & 1.6635 & 0.052572 \tabularnewline
12 & -0.334859 & -1.9811 & 0.027743 \tabularnewline
13 & 0.030362 & 0.1796 & 0.429242 \tabularnewline
14 & 0.085624 & 0.5066 & 0.307821 \tabularnewline
15 & 0.12263 & 0.7255 & 0.236488 \tabularnewline
16 & -0.146006 & -0.8638 & 0.196793 \tabularnewline
17 & 0.011798 & 0.0698 & 0.472375 \tabularnewline
\hline
\end{tabular}
%Source: https://freestatistics.org/blog/index.php?pk=63966&T=1

[TABLE]
[ROW][C]Autocorrelation Function[/C][/ROW]
[ROW][C]Time lag k[/C][C]ACF(k)[/C][C]T-STAT[/C][C]P-value[/C][/ROW]
[ROW][C]1[/C][C]-0.527377[/C][C]-3.12[/C][C]0.001806[/C][/ROW]
[ROW][C]2[/C][C]0.124242[/C][C]0.735[/C][C]0.23361[/C][/ROW]
[ROW][C]3[/C][C]-0.229307[/C][C]-1.3566[/C][C]0.091798[/C][/ROW]
[ROW][C]4[/C][C]0.325972[/C][C]1.9285[/C][C]0.030969[/C][/ROW]
[ROW][C]5[/C][C]-0.226635[/C][C]-1.3408[/C][C]0.094313[/C][/ROW]
[ROW][C]6[/C][C]0.04687[/C][C]0.2773[/C][C]0.391596[/C][/ROW]
[ROW][C]7[/C][C]0.068486[/C][C]0.4052[/C][C]0.34391[/C][/ROW]
[ROW][C]8[/C][C]-0.164557[/C][C]-0.9735[/C][C]0.168484[/C][/ROW]
[ROW][C]9[/C][C]0.089495[/C][C]0.5295[/C][C]0.299916[/C][/ROW]
[ROW][C]10[/C][C]-0.064964[/C][C]-0.3843[/C][C]0.351528[/C][/ROW]
[ROW][C]11[/C][C]0.281182[/C][C]1.6635[/C][C]0.052572[/C][/ROW]
[ROW][C]12[/C][C]-0.334859[/C][C]-1.9811[/C][C]0.027743[/C][/ROW]
[ROW][C]13[/C][C]0.030362[/C][C]0.1796[/C][C]0.429242[/C][/ROW]
[ROW][C]14[/C][C]0.085624[/C][C]0.5066[/C][C]0.307821[/C][/ROW]
[ROW][C]15[/C][C]0.12263[/C][C]0.7255[/C][C]0.236488[/C][/ROW]
[ROW][C]16[/C][C]-0.146006[/C][C]-0.8638[/C][C]0.196793[/C][/ROW]
[ROW][C]17[/C][C]0.011798[/C][C]0.0698[/C][C]0.472375[/C][/ROW]
[/TABLE]
Source: https://freestatistics.org/blog/index.php?pk=63966&T=1

Globally Unique Identifier (entire table): ba.freestatistics.org/blog/index.php?pk=63966&T=1

As an alternative you can also use a QR Code:  

The GUIDs for individual cells are displayed in the table below:

Autocorrelation Function
Time lag kACF(k)T-STATP-value
1-0.527377-3.120.001806
20.1242420.7350.23361
3-0.229307-1.35660.091798
40.3259721.92850.030969
5-0.226635-1.34080.094313
60.046870.27730.391596
70.0684860.40520.34391
8-0.164557-0.97350.168484
90.0894950.52950.299916
10-0.064964-0.38430.351528
110.2811821.66350.052572
12-0.334859-1.98110.027743
130.0303620.17960.429242
140.0856240.50660.307821
150.122630.72550.236488
16-0.146006-0.86380.196793
170.0117980.06980.472375


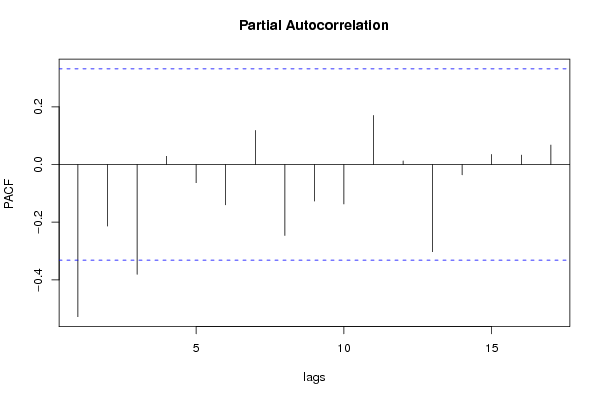
Partial Autocorrelation Function
Time lag kPACF(k)T-STATP-value
1-0.527377-3.120.001806
2-0.213172-1.26110.107799
3-0.380569-2.25150.015368
40.0283270.16760.433937
5-0.063201-0.37390.355367
6-0.139648-0.82620.207153
70.1179560.69780.244945
8-0.245851-1.45450.077363
9-0.126731-0.74980.229207
10-0.136628-0.80830.212189
110.1702561.00720.160365
120.0122390.07240.471345
13-0.302317-1.78850.041175
14-0.035676-0.21110.41703
150.0350780.20750.418403
160.0325770.19270.424143
170.0673950.39870.346263

\begin{tabular}{lllllllll}
\hline
Partial Autocorrelation Function \tabularnewline
Time lag k & PACF(k) & T-STAT & P-value \tabularnewline
1 & -0.527377 & -3.12 & 0.001806 \tabularnewline
2 & -0.213172 & -1.2611 & 0.107799 \tabularnewline
3 & -0.380569 & -2.2515 & 0.015368 \tabularnewline
4 & 0.028327 & 0.1676 & 0.433937 \tabularnewline
5 & -0.063201 & -0.3739 & 0.355367 \tabularnewline
6 & -0.139648 & -0.8262 & 0.207153 \tabularnewline
7 & 0.117956 & 0.6978 & 0.244945 \tabularnewline
8 & -0.245851 & -1.4545 & 0.077363 \tabularnewline
9 & -0.126731 & -0.7498 & 0.229207 \tabularnewline
10 & -0.136628 & -0.8083 & 0.212189 \tabularnewline
11 & 0.170256 & 1.0072 & 0.160365 \tabularnewline
12 & 0.012239 & 0.0724 & 0.471345 \tabularnewline
13 & -0.302317 & -1.7885 & 0.041175 \tabularnewline
14 & -0.035676 & -0.2111 & 0.41703 \tabularnewline
15 & 0.035078 & 0.2075 & 0.418403 \tabularnewline
16 & 0.032577 & 0.1927 & 0.424143 \tabularnewline
17 & 0.067395 & 0.3987 & 0.346263 \tabularnewline
\hline
\end{tabular}
%Source: https://freestatistics.org/blog/index.php?pk=63966&T=2

[TABLE]
[ROW][C]Partial Autocorrelation Function[/C][/ROW]
[ROW][C]Time lag k[/C][C]PACF(k)[/C][C]T-STAT[/C][C]P-value[/C][/ROW]
[ROW][C]1[/C][C]-0.527377[/C][C]-3.12[/C][C]0.001806[/C][/ROW]
[ROW][C]2[/C][C]-0.213172[/C][C]-1.2611[/C][C]0.107799[/C][/ROW]
[ROW][C]3[/C][C]-0.380569[/C][C]-2.2515[/C][C]0.015368[/C][/ROW]
[ROW][C]4[/C][C]0.028327[/C][C]0.1676[/C][C]0.433937[/C][/ROW]
[ROW][C]5[/C][C]-0.063201[/C][C]-0.3739[/C][C]0.355367[/C][/ROW]
[ROW][C]6[/C][C]-0.139648[/C][C]-0.8262[/C][C]0.207153[/C][/ROW]
[ROW][C]7[/C][C]0.117956[/C][C]0.6978[/C][C]0.244945[/C][/ROW]
[ROW][C]8[/C][C]-0.245851[/C][C]-1.4545[/C][C]0.077363[/C][/ROW]
[ROW][C]9[/C][C]-0.126731[/C][C]-0.7498[/C][C]0.229207[/C][/ROW]
[ROW][C]10[/C][C]-0.136628[/C][C]-0.8083[/C][C]0.212189[/C][/ROW]
[ROW][C]11[/C][C]0.170256[/C][C]1.0072[/C][C]0.160365[/C][/ROW]
[ROW][C]12[/C][C]0.012239[/C][C]0.0724[/C][C]0.471345[/C][/ROW]
[ROW][C]13[/C][C]-0.302317[/C][C]-1.7885[/C][C]0.041175[/C][/ROW]
[ROW][C]14[/C][C]-0.035676[/C][C]-0.2111[/C][C]0.41703[/C][/ROW]
[ROW][C]15[/C][C]0.035078[/C][C]0.2075[/C][C]0.418403[/C][/ROW]
[ROW][C]16[/C][C]0.032577[/C][C]0.1927[/C][C]0.424143[/C][/ROW]
[ROW][C]17[/C][C]0.067395[/C][C]0.3987[/C][C]0.346263[/C][/ROW]
[/TABLE]
Source: https://freestatistics.org/blog/index.php?pk=63966&T=2

Globally Unique Identifier (entire table): ba.freestatistics.org/blog/index.php?pk=63966&T=2

As an alternative you can also use a QR Code:  

The GUIDs for individual cells are displayed in the table below:

Partial Autocorrelation Function
Time lag kPACF(k)T-STATP-value
1-0.527377-3.120.001806
2-0.213172-1.26110.107799
3-0.380569-2.25150.015368
40.0283270.16760.433937
5-0.063201-0.37390.355367
6-0.139648-0.82620.207153
70.1179560.69780.244945
8-0.245851-1.45450.077363
9-0.126731-0.74980.229207
10-0.136628-0.80830.212189
110.1702561.00720.160365
120.0122390.07240.471345
13-0.302317-1.78850.041175
14-0.035676-0.21110.41703
150.0350780.20750.418403
160.0325770.19270.424143
170.0673950.39870.346263


Parameters (Session):
par1 = Default ; par2 = 1 ; par3 = 1 ; par4 = 2 ; par5 = 12 ; par6 = White Noise ; par7 = 0.95 ;
Parameters (R input):
par1 = Default ; par2 = 1 ; par3 = 1 ; par4 = 2 ; par5 = 12 ; par6 = White Noise ; par7 = 0.95 ;
R code (references can be found in the software module):
if (par1 == 'Default') {
par1 = 10*log10(length(x))
} else {
par1 <- as.numeric(par1)
}
par2 <- as.numeric(par2)
par3 <- as.numeric(par3)
par4 <- as.numeric(par4)
par5 <- as.numeric(par5)
if (par6 == 'White Noise') par6 <- 'white' else par6 <- 'ma'
par7 <- as.numeric(par7)
if (par2 == 0) {
x <- log(x)
} else {
x <- (x ^ par2 - 1) / par2
}
if (par3 > 0) x <- diff(x,lag=1,difference=par3)
if (par4 > 0) x <- diff(x,lag=par5,difference=par4)
bitmap(file='pic1.png')
racf <- acf(x, par1, main='Autocorrelation', xlab='time lag', ylab='ACF', ci.type=par6, ci=par7, sub=paste('(lambda=',par2,', d=',par3,', D=',par4,', CI=', par7, ', CI type=',par6,')',sep=''))
dev.off()
bitmap(file='pic2.png')
rpacf <- pacf(x,par1,main='Partial Autocorrelation',xlab='lags',ylab='PACF')
dev.off()
(myacf <- c(racf$acf))
(mypacf <- c(rpacf$acf))
lengthx <- length(x)
sqrtn <- sqrt(lengthx)
load(file='createtable')
a<-table.start()
a<-table.row.start(a)
a<-table.element(a,'Autocorrelation Function',4,TRUE)
a<-table.row.end(a)
a<-table.row.start(a)
a<-table.element(a,'Time lag k',header=TRUE)
a<-table.element(a,hyperlink('basics.htm','ACF(k)','click here for more information about the Autocorrelation Function'),header=TRUE)
a<-table.element(a,'T-STAT',header=TRUE)
a<-table.element(a,'P-value',header=TRUE)
a<-table.row.end(a)
for (i in 2:(par1+1)) {
a<-table.row.start(a)
a<-table.element(a,i-1,header=TRUE)
a<-table.element(a,round(myacf[i],6))
mytstat <- myacf[i]*sqrtn
a<-table.element(a,round(mytstat,4))
a<-table.element(a,round(1-pt(abs(mytstat),lengthx),6))
a<-table.row.end(a)
}
a<-table.end(a)
table.save(a,file='mytable.tab')
a<-table.start()
a<-table.row.start(a)
a<-table.element(a,'Partial Autocorrelation Function',4,TRUE)
a<-table.row.end(a)
a<-table.row.start(a)
a<-table.element(a,'Time lag k',header=TRUE)
a<-table.element(a,hyperlink('basics.htm','PACF(k)','click here for more information about the Partial Autocorrelation Function'),header=TRUE)
a<-table.element(a,'T-STAT',header=TRUE)
a<-table.element(a,'P-value',header=TRUE)
a<-table.row.end(a)
for (i in 1:par1) {
a<-table.row.start(a)
a<-table.element(a,i,header=TRUE)
a<-table.element(a,round(mypacf[i],6))
mytstat <- mypacf[i]*sqrtn
a<-table.element(a,round(mytstat,4))
a<-table.element(a,round(1-pt(abs(mytstat),lengthx),6))
a<-table.row.end(a)
}
a<-table.end(a)
table.save(a,file='mytable1.tab')