Free Statistics

of Irreproducible Research!

Author's title

Author*Unverified author*
R Software Modulerwasp_exponentialsmoothing.wasp
Title produced by softwareExponential Smoothing
Date of computationFri, 04 Dec 2009 10:47:48 -0700
Cite this page as followsStatistical Computations at FreeStatistics.org, Office for Research Development and Education, URL https://freestatistics.org/blog/index.php?v=date/2009/Dec/04/t1259949001u6fbj8yf9khu1yb.htm/, Retrieved Sun, 28 Apr 2024 00:54:10 +0000
Statistical Computations at FreeStatistics.org, Office for Research Development and Education, URL https://freestatistics.org/blog/index.php?pk=63974, Retrieved Sun, 28 Apr 2024 00:54:10 +0000
QR Codes:

Original text written by user:
IsPrivate?No (this computation is public)
User-defined keywords
Estimated Impact78
Family? (F = Feedback message, R = changed R code, M = changed R Module, P = changed Parameters, D = changed Data)
-     [Univariate Data Series] [data set] [2008-12-01 19:54:57] [b98453cac15ba1066b407e146608df68]
- RMP   [Exponential Smoothing] [] [2009-11-27 15:04:36] [b98453cac15ba1066b407e146608df68]
-   PD      [Exponential Smoothing] [] [2009-12-04 17:47:48] [1c886d75b2eec2d50a82160bb8104e3b] [Current]
Feedback Forum

Post a new message
Dataseries X:
95.5
76.7
79.4
55.2
60
64.8
82.3
210.5
106
80.8
97.3
189.5
90
69.3
87.3
57.4
56.2
61.6
77.7
177.2
97.6
81.6
96.8
191.3
106
75.1
72
63.5
57.4
62.3
79.4
178.1
109.3
85.2
102.7
193.7
108.4
73.4
85.9
58.5
58.6
62.7
77.5
180.5
102.2
82.6
97.8
197.8
93.8
72.4
77.7
58.7
53.1
64.3
76.4
188.4
105.5
79.8
96.1
202.5


Summary of computational transaction
Raw Inputview raw input (R code)
Raw Outputview raw output of R engine
Computing time2 seconds
R Server'Gwilym Jenkins' @ 72.249.127.135

\begin{tabular}{lllllllll}
\hline
Summary of computational transaction \tabularnewline
Raw Input & view raw input (R code)  \tabularnewline
Raw Output & view raw output of R engine  \tabularnewline
Computing time & 2 seconds \tabularnewline
R Server & 'Gwilym Jenkins' @ 72.249.127.135 \tabularnewline
\hline
\end{tabular}
%Source: https://freestatistics.org/blog/index.php?pk=63974&T=0

[TABLE]
[ROW][C]Summary of computational transaction[/C][/ROW]
[ROW][C]Raw Input[/C][C]view raw input (R code) [/C][/ROW]
[ROW][C]Raw Output[/C][C]view raw output of R engine [/C][/ROW]
[ROW][C]Computing time[/C][C]2 seconds[/C][/ROW]
[ROW][C]R Server[/C][C]'Gwilym Jenkins' @ 72.249.127.135[/C][/ROW]
[/TABLE]
Source: https://freestatistics.org/blog/index.php?pk=63974&T=0

Globally Unique Identifier (entire table): ba.freestatistics.org/blog/index.php?pk=63974&T=0

As an alternative you can also use a QR Code:  

The GUIDs for individual cells are displayed in the table below:

Summary of computational transaction
Raw Inputview raw input (R code)
Raw Outputview raw output of R engine
Computing time2 seconds
R Server'Gwilym Jenkins' @ 72.249.127.135


Estimated Parameters of Exponential Smoothing
ParameterValue
alpha0.177301097189880
beta0.0428118109755981
gamma0.788749875228097

\begin{tabular}{lllllllll}
\hline
Estimated Parameters of Exponential Smoothing \tabularnewline
Parameter & Value \tabularnewline
alpha & 0.177301097189880 \tabularnewline
beta & 0.0428118109755981 \tabularnewline
gamma & 0.788749875228097 \tabularnewline
\hline
\end{tabular}
%Source: https://freestatistics.org/blog/index.php?pk=63974&T=1

[TABLE]
[ROW][C]Estimated Parameters of Exponential Smoothing[/C][/ROW]
[ROW][C]Parameter[/C][C]Value[/C][/ROW]
[ROW][C]alpha[/C][C]0.177301097189880[/C][/ROW]
[ROW][C]beta[/C][C]0.0428118109755981[/C][/ROW]
[ROW][C]gamma[/C][C]0.788749875228097[/C][/ROW]
[/TABLE]
Source: https://freestatistics.org/blog/index.php?pk=63974&T=1

Globally Unique Identifier (entire table): ba.freestatistics.org/blog/index.php?pk=63974&T=1

As an alternative you can also use a QR Code:  

The GUIDs for individual cells are displayed in the table below:

Estimated Parameters of Exponential Smoothing
ParameterValue
alpha0.177301097189880
beta0.0428118109755981
gamma0.788749875228097


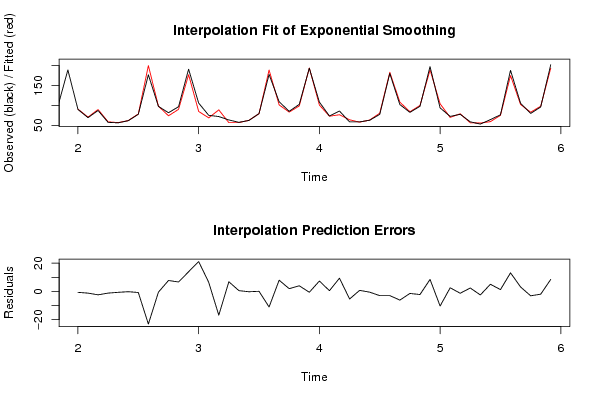
Interpolation Forecasts of Exponential Smoothing
tObservedFittedResiduals
139090.6679905850666-0.667990585066647
1469.370.5134914823573-1.21349148235733
1587.389.7183509239835-2.41835092398351
1657.458.5942509902544-1.19425099025437
1756.256.8428931646303-0.642893164630287
1861.661.7977112556271-0.197711255627119
1977.778.4721393845347-0.772139384534668
20177.2200.287272333324-23.0872723333240
2197.698.1034213700852-0.503421370085192
2281.673.88391207646277.71608792353734
2396.890.13242858531936.66757141468065
24191.3177.39577236430713.9042276356927
2510684.882693331312921.1173066686871
2675.168.70964993877936.39035006122073
277288.8210993332873-16.8210993332873
2863.556.66725397054576.83274602945426
2957.456.84780364133350.552196358666471
3062.362.5491549075878-0.249154907587801
3179.479.308396737960.091603262039996
32178.1189.122959763264-11.0229597632636
33109.3101.3625613672937.93743863270656
3485.283.2646797202071.93532027979296
35102.798.70775831562083.99224168437922
36193.7194.311714496881-0.61171449688095
37108.4101.0461475161687.35385248383209
3873.472.90071206595640.499287934043579
3985.976.5286016109799.37139838902107
4058.563.8698634562511-5.36986345625113
4158.657.85036698694480.749633013055217
4262.763.2261291791202-0.526129179120154
4377.580.4971951397315-2.99719513973155
44180.5183.457234392854-2.95723439285408
45102.2108.341102339044-6.14110233904414
4682.684.0364303675374-1.43643036753740
4797.8100.009468172683-2.20946817268329
48197.8189.3190376195918.4809623804091
4993.8104.138505398718-10.3385053987177
5072.469.84201946783722.55798053216279
5177.779.002386465694-1.302386465694
5258.756.27511555463682.42488444536320
5353.155.5947129314329-2.49471293143286
5464.359.22144529623125.07855470376884
5576.475.13556307105391.26443692894613
56188.4175.26422705403013.1357729459704
57105.5102.3723939272023.12760607279837
5879.882.9074429994715-3.10744299947149
5996.198.0627110525615-1.96271105256153
60202.5194.0093879912128.4906120087881

\begin{tabular}{lllllllll}
\hline
Interpolation Forecasts of Exponential Smoothing \tabularnewline
t & Observed & Fitted & Residuals \tabularnewline
13 & 90 & 90.6679905850666 & -0.667990585066647 \tabularnewline
14 & 69.3 & 70.5134914823573 & -1.21349148235733 \tabularnewline
15 & 87.3 & 89.7183509239835 & -2.41835092398351 \tabularnewline
16 & 57.4 & 58.5942509902544 & -1.19425099025437 \tabularnewline
17 & 56.2 & 56.8428931646303 & -0.642893164630287 \tabularnewline
18 & 61.6 & 61.7977112556271 & -0.197711255627119 \tabularnewline
19 & 77.7 & 78.4721393845347 & -0.772139384534668 \tabularnewline
20 & 177.2 & 200.287272333324 & -23.0872723333240 \tabularnewline
21 & 97.6 & 98.1034213700852 & -0.503421370085192 \tabularnewline
22 & 81.6 & 73.8839120764627 & 7.71608792353734 \tabularnewline
23 & 96.8 & 90.1324285853193 & 6.66757141468065 \tabularnewline
24 & 191.3 & 177.395772364307 & 13.9042276356927 \tabularnewline
25 & 106 & 84.8826933313129 & 21.1173066686871 \tabularnewline
26 & 75.1 & 68.7096499387793 & 6.39035006122073 \tabularnewline
27 & 72 & 88.8210993332873 & -16.8210993332873 \tabularnewline
28 & 63.5 & 56.6672539705457 & 6.83274602945426 \tabularnewline
29 & 57.4 & 56.8478036413335 & 0.552196358666471 \tabularnewline
30 & 62.3 & 62.5491549075878 & -0.249154907587801 \tabularnewline
31 & 79.4 & 79.30839673796 & 0.091603262039996 \tabularnewline
32 & 178.1 & 189.122959763264 & -11.0229597632636 \tabularnewline
33 & 109.3 & 101.362561367293 & 7.93743863270656 \tabularnewline
34 & 85.2 & 83.264679720207 & 1.93532027979296 \tabularnewline
35 & 102.7 & 98.7077583156208 & 3.99224168437922 \tabularnewline
36 & 193.7 & 194.311714496881 & -0.61171449688095 \tabularnewline
37 & 108.4 & 101.046147516168 & 7.35385248383209 \tabularnewline
38 & 73.4 & 72.9007120659564 & 0.499287934043579 \tabularnewline
39 & 85.9 & 76.528601610979 & 9.37139838902107 \tabularnewline
40 & 58.5 & 63.8698634562511 & -5.36986345625113 \tabularnewline
41 & 58.6 & 57.8503669869448 & 0.749633013055217 \tabularnewline
42 & 62.7 & 63.2261291791202 & -0.526129179120154 \tabularnewline
43 & 77.5 & 80.4971951397315 & -2.99719513973155 \tabularnewline
44 & 180.5 & 183.457234392854 & -2.95723439285408 \tabularnewline
45 & 102.2 & 108.341102339044 & -6.14110233904414 \tabularnewline
46 & 82.6 & 84.0364303675374 & -1.43643036753740 \tabularnewline
47 & 97.8 & 100.009468172683 & -2.20946817268329 \tabularnewline
48 & 197.8 & 189.319037619591 & 8.4809623804091 \tabularnewline
49 & 93.8 & 104.138505398718 & -10.3385053987177 \tabularnewline
50 & 72.4 & 69.8420194678372 & 2.55798053216279 \tabularnewline
51 & 77.7 & 79.002386465694 & -1.302386465694 \tabularnewline
52 & 58.7 & 56.2751155546368 & 2.42488444536320 \tabularnewline
53 & 53.1 & 55.5947129314329 & -2.49471293143286 \tabularnewline
54 & 64.3 & 59.2214452962312 & 5.07855470376884 \tabularnewline
55 & 76.4 & 75.1355630710539 & 1.26443692894613 \tabularnewline
56 & 188.4 & 175.264227054030 & 13.1357729459704 \tabularnewline
57 & 105.5 & 102.372393927202 & 3.12760607279837 \tabularnewline
58 & 79.8 & 82.9074429994715 & -3.10744299947149 \tabularnewline
59 & 96.1 & 98.0627110525615 & -1.96271105256153 \tabularnewline
60 & 202.5 & 194.009387991212 & 8.4906120087881 \tabularnewline
\hline
\end{tabular}
%Source: https://freestatistics.org/blog/index.php?pk=63974&T=2

[TABLE]
[ROW][C]Interpolation Forecasts of Exponential Smoothing[/C][/ROW]
[ROW][C]t[/C][C]Observed[/C][C]Fitted[/C][C]Residuals[/C][/ROW]
[ROW][C]13[/C][C]90[/C][C]90.6679905850666[/C][C]-0.667990585066647[/C][/ROW]
[ROW][C]14[/C][C]69.3[/C][C]70.5134914823573[/C][C]-1.21349148235733[/C][/ROW]
[ROW][C]15[/C][C]87.3[/C][C]89.7183509239835[/C][C]-2.41835092398351[/C][/ROW]
[ROW][C]16[/C][C]57.4[/C][C]58.5942509902544[/C][C]-1.19425099025437[/C][/ROW]
[ROW][C]17[/C][C]56.2[/C][C]56.8428931646303[/C][C]-0.642893164630287[/C][/ROW]
[ROW][C]18[/C][C]61.6[/C][C]61.7977112556271[/C][C]-0.197711255627119[/C][/ROW]
[ROW][C]19[/C][C]77.7[/C][C]78.4721393845347[/C][C]-0.772139384534668[/C][/ROW]
[ROW][C]20[/C][C]177.2[/C][C]200.287272333324[/C][C]-23.0872723333240[/C][/ROW]
[ROW][C]21[/C][C]97.6[/C][C]98.1034213700852[/C][C]-0.503421370085192[/C][/ROW]
[ROW][C]22[/C][C]81.6[/C][C]73.8839120764627[/C][C]7.71608792353734[/C][/ROW]
[ROW][C]23[/C][C]96.8[/C][C]90.1324285853193[/C][C]6.66757141468065[/C][/ROW]
[ROW][C]24[/C][C]191.3[/C][C]177.395772364307[/C][C]13.9042276356927[/C][/ROW]
[ROW][C]25[/C][C]106[/C][C]84.8826933313129[/C][C]21.1173066686871[/C][/ROW]
[ROW][C]26[/C][C]75.1[/C][C]68.7096499387793[/C][C]6.39035006122073[/C][/ROW]
[ROW][C]27[/C][C]72[/C][C]88.8210993332873[/C][C]-16.8210993332873[/C][/ROW]
[ROW][C]28[/C][C]63.5[/C][C]56.6672539705457[/C][C]6.83274602945426[/C][/ROW]
[ROW][C]29[/C][C]57.4[/C][C]56.8478036413335[/C][C]0.552196358666471[/C][/ROW]
[ROW][C]30[/C][C]62.3[/C][C]62.5491549075878[/C][C]-0.249154907587801[/C][/ROW]
[ROW][C]31[/C][C]79.4[/C][C]79.30839673796[/C][C]0.091603262039996[/C][/ROW]
[ROW][C]32[/C][C]178.1[/C][C]189.122959763264[/C][C]-11.0229597632636[/C][/ROW]
[ROW][C]33[/C][C]109.3[/C][C]101.362561367293[/C][C]7.93743863270656[/C][/ROW]
[ROW][C]34[/C][C]85.2[/C][C]83.264679720207[/C][C]1.93532027979296[/C][/ROW]
[ROW][C]35[/C][C]102.7[/C][C]98.7077583156208[/C][C]3.99224168437922[/C][/ROW]
[ROW][C]36[/C][C]193.7[/C][C]194.311714496881[/C][C]-0.61171449688095[/C][/ROW]
[ROW][C]37[/C][C]108.4[/C][C]101.046147516168[/C][C]7.35385248383209[/C][/ROW]
[ROW][C]38[/C][C]73.4[/C][C]72.9007120659564[/C][C]0.499287934043579[/C][/ROW]
[ROW][C]39[/C][C]85.9[/C][C]76.528601610979[/C][C]9.37139838902107[/C][/ROW]
[ROW][C]40[/C][C]58.5[/C][C]63.8698634562511[/C][C]-5.36986345625113[/C][/ROW]
[ROW][C]41[/C][C]58.6[/C][C]57.8503669869448[/C][C]0.749633013055217[/C][/ROW]
[ROW][C]42[/C][C]62.7[/C][C]63.2261291791202[/C][C]-0.526129179120154[/C][/ROW]
[ROW][C]43[/C][C]77.5[/C][C]80.4971951397315[/C][C]-2.99719513973155[/C][/ROW]
[ROW][C]44[/C][C]180.5[/C][C]183.457234392854[/C][C]-2.95723439285408[/C][/ROW]
[ROW][C]45[/C][C]102.2[/C][C]108.341102339044[/C][C]-6.14110233904414[/C][/ROW]
[ROW][C]46[/C][C]82.6[/C][C]84.0364303675374[/C][C]-1.43643036753740[/C][/ROW]
[ROW][C]47[/C][C]97.8[/C][C]100.009468172683[/C][C]-2.20946817268329[/C][/ROW]
[ROW][C]48[/C][C]197.8[/C][C]189.319037619591[/C][C]8.4809623804091[/C][/ROW]
[ROW][C]49[/C][C]93.8[/C][C]104.138505398718[/C][C]-10.3385053987177[/C][/ROW]
[ROW][C]50[/C][C]72.4[/C][C]69.8420194678372[/C][C]2.55798053216279[/C][/ROW]
[ROW][C]51[/C][C]77.7[/C][C]79.002386465694[/C][C]-1.302386465694[/C][/ROW]
[ROW][C]52[/C][C]58.7[/C][C]56.2751155546368[/C][C]2.42488444536320[/C][/ROW]
[ROW][C]53[/C][C]53.1[/C][C]55.5947129314329[/C][C]-2.49471293143286[/C][/ROW]
[ROW][C]54[/C][C]64.3[/C][C]59.2214452962312[/C][C]5.07855470376884[/C][/ROW]
[ROW][C]55[/C][C]76.4[/C][C]75.1355630710539[/C][C]1.26443692894613[/C][/ROW]
[ROW][C]56[/C][C]188.4[/C][C]175.264227054030[/C][C]13.1357729459704[/C][/ROW]
[ROW][C]57[/C][C]105.5[/C][C]102.372393927202[/C][C]3.12760607279837[/C][/ROW]
[ROW][C]58[/C][C]79.8[/C][C]82.9074429994715[/C][C]-3.10744299947149[/C][/ROW]
[ROW][C]59[/C][C]96.1[/C][C]98.0627110525615[/C][C]-1.96271105256153[/C][/ROW]
[ROW][C]60[/C][C]202.5[/C][C]194.009387991212[/C][C]8.4906120087881[/C][/ROW]
[/TABLE]
Source: https://freestatistics.org/blog/index.php?pk=63974&T=2

Globally Unique Identifier (entire table): ba.freestatistics.org/blog/index.php?pk=63974&T=2

As an alternative you can also use a QR Code:  

The GUIDs for individual cells are displayed in the table below:

Interpolation Forecasts of Exponential Smoothing
tObservedFittedResiduals
139090.6679905850666-0.667990585066647
1469.370.5134914823573-1.21349148235733
1587.389.7183509239835-2.41835092398351
1657.458.5942509902544-1.19425099025437
1756.256.8428931646303-0.642893164630287
1861.661.7977112556271-0.197711255627119
1977.778.4721393845347-0.772139384534668
20177.2200.287272333324-23.0872723333240
2197.698.1034213700852-0.503421370085192
2281.673.88391207646277.71608792353734
2396.890.13242858531936.66757141468065
24191.3177.39577236430713.9042276356927
2510684.882693331312921.1173066686871
2675.168.70964993877936.39035006122073
277288.8210993332873-16.8210993332873
2863.556.66725397054576.83274602945426
2957.456.84780364133350.552196358666471
3062.362.5491549075878-0.249154907587801
3179.479.308396737960.091603262039996
32178.1189.122959763264-11.0229597632636
33109.3101.3625613672937.93743863270656
3485.283.2646797202071.93532027979296
35102.798.70775831562083.99224168437922
36193.7194.311714496881-0.61171449688095
37108.4101.0461475161687.35385248383209
3873.472.90071206595640.499287934043579
3985.976.5286016109799.37139838902107
4058.563.8698634562511-5.36986345625113
4158.657.85036698694480.749633013055217
4262.763.2261291791202-0.526129179120154
4377.580.4971951397315-2.99719513973155
44180.5183.457234392854-2.95723439285408
45102.2108.341102339044-6.14110233904414
4682.684.0364303675374-1.43643036753740
4797.8100.009468172683-2.20946817268329
48197.8189.3190376195918.4809623804091
4993.8104.138505398718-10.3385053987177
5072.469.84201946783722.55798053216279
5177.779.002386465694-1.302386465694
5258.756.27511555463682.42488444536320
5353.155.5947129314329-2.49471293143286
5464.359.22144529623125.07855470376884
5576.475.13556307105391.26443692894613
56188.4175.26422705403013.1357729459704
57105.5102.3723939272023.12760607279837
5879.882.9074429994715-3.10744299947149
5996.198.0627110525615-1.96271105256153
60202.5194.0093879912128.4906120087881


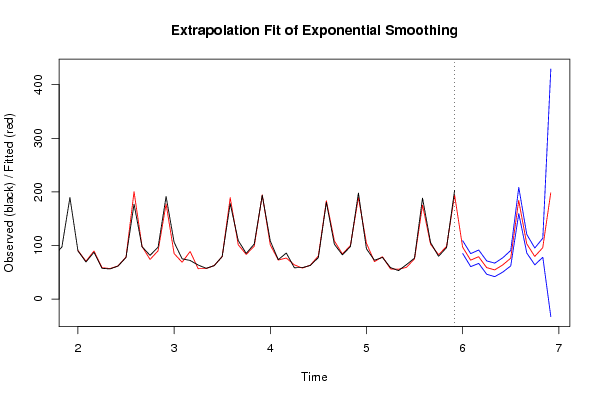
Extrapolation Forecasts of Exponential Smoothing
tForecast95% Lower Bound95% Upper Bound
6196.987027300322885.0394651893925108.934589411253
6272.648982686679160.534346048209284.763619325149
6379.013778995132766.50836238402291.5191956062434
6458.730444464023646.285363397132971.1755255309143
6554.443171479382541.786239729522267.1001032292427
6663.624559207075250.270614355777576.978504058373
6776.264767755173261.831628852474390.6979066578721
68184.008021584436159.584621183844208.431421985029
69103.21949214868385.9322732952686120.506711002098
7079.52900391629563.825005188749495.2330026438407
7195.823488143680278.0766209665477113.570355320813
72198.263447889791-32.8209580904064429.347853869989

\begin{tabular}{lllllllll}
\hline
Extrapolation Forecasts of Exponential Smoothing \tabularnewline
t & Forecast & 95% Lower Bound & 95% Upper Bound \tabularnewline
61 & 96.9870273003228 & 85.0394651893925 & 108.934589411253 \tabularnewline
62 & 72.6489826866791 & 60.5343460482092 & 84.763619325149 \tabularnewline
63 & 79.0137789951327 & 66.508362384022 & 91.5191956062434 \tabularnewline
64 & 58.7304444640236 & 46.2853633971329 & 71.1755255309143 \tabularnewline
65 & 54.4431714793825 & 41.7862397295222 & 67.1001032292427 \tabularnewline
66 & 63.6245592070752 & 50.2706143557775 & 76.978504058373 \tabularnewline
67 & 76.2647677551732 & 61.8316288524743 & 90.6979066578721 \tabularnewline
68 & 184.008021584436 & 159.584621183844 & 208.431421985029 \tabularnewline
69 & 103.219492148683 & 85.9322732952686 & 120.506711002098 \tabularnewline
70 & 79.529003916295 & 63.8250051887494 & 95.2330026438407 \tabularnewline
71 & 95.8234881436802 & 78.0766209665477 & 113.570355320813 \tabularnewline
72 & 198.263447889791 & -32.8209580904064 & 429.347853869989 \tabularnewline
\hline
\end{tabular}
%Source: https://freestatistics.org/blog/index.php?pk=63974&T=3

[TABLE]
[ROW][C]Extrapolation Forecasts of Exponential Smoothing[/C][/ROW]
[ROW][C]t[/C][C]Forecast[/C][C]95% Lower Bound[/C][C]95% Upper Bound[/C][/ROW]
[ROW][C]61[/C][C]96.9870273003228[/C][C]85.0394651893925[/C][C]108.934589411253[/C][/ROW]
[ROW][C]62[/C][C]72.6489826866791[/C][C]60.5343460482092[/C][C]84.763619325149[/C][/ROW]
[ROW][C]63[/C][C]79.0137789951327[/C][C]66.508362384022[/C][C]91.5191956062434[/C][/ROW]
[ROW][C]64[/C][C]58.7304444640236[/C][C]46.2853633971329[/C][C]71.1755255309143[/C][/ROW]
[ROW][C]65[/C][C]54.4431714793825[/C][C]41.7862397295222[/C][C]67.1001032292427[/C][/ROW]
[ROW][C]66[/C][C]63.6245592070752[/C][C]50.2706143557775[/C][C]76.978504058373[/C][/ROW]
[ROW][C]67[/C][C]76.2647677551732[/C][C]61.8316288524743[/C][C]90.6979066578721[/C][/ROW]
[ROW][C]68[/C][C]184.008021584436[/C][C]159.584621183844[/C][C]208.431421985029[/C][/ROW]
[ROW][C]69[/C][C]103.219492148683[/C][C]85.9322732952686[/C][C]120.506711002098[/C][/ROW]
[ROW][C]70[/C][C]79.529003916295[/C][C]63.8250051887494[/C][C]95.2330026438407[/C][/ROW]
[ROW][C]71[/C][C]95.8234881436802[/C][C]78.0766209665477[/C][C]113.570355320813[/C][/ROW]
[ROW][C]72[/C][C]198.263447889791[/C][C]-32.8209580904064[/C][C]429.347853869989[/C][/ROW]
[/TABLE]
Source: https://freestatistics.org/blog/index.php?pk=63974&T=3

Globally Unique Identifier (entire table): ba.freestatistics.org/blog/index.php?pk=63974&T=3

As an alternative you can also use a QR Code:  

The GUIDs for individual cells are displayed in the table below:

Extrapolation Forecasts of Exponential Smoothing
tForecast95% Lower Bound95% Upper Bound
6196.987027300322885.0394651893925108.934589411253
6272.648982686679160.534346048209284.763619325149
6379.013778995132766.50836238402291.5191956062434
6458.730444464023646.285363397132971.1755255309143
6554.443171479382541.786239729522267.1001032292427
6663.624559207075250.270614355777576.978504058373
6776.264767755173261.831628852474390.6979066578721
68184.008021584436159.584621183844208.431421985029
69103.21949214868385.9322732952686120.506711002098
7079.52900391629563.825005188749495.2330026438407
7195.823488143680278.0766209665477113.570355320813
72198.263447889791-32.8209580904064429.347853869989


Parameters (Session):
par1 = FALSE ; par2 = -0.4 ; par3 = 1 ; par4 = 1 ; par5 = 12 ; par6 = 3 ; par7 = 1 ; par8 = 2 ; par9 = 1 ;
Parameters (R input):
par1 = 12 ; par2 = Triple ; par3 = multiplicative ;
R code (references can be found in the software module):
par1 <- as.numeric(par1)
if (par2 == 'Single') K <- 1
if (par2 == 'Double') K <- 2
if (par2 == 'Triple') K <- par1
nx <- length(x)
nxmK <- nx - K
x <- ts(x, frequency = par1)
if (par2 == 'Single') fit <- HoltWinters(x, gamma=0, beta=0)
if (par2 == 'Double') fit <- HoltWinters(x, gamma=0)
if (par2 == 'Triple') fit <- HoltWinters(x, seasonal=par3)
fit
myresid <- x - fit$fitted[,'xhat']
bitmap(file='test1.png')
op <- par(mfrow=c(2,1))
plot(fit,ylab='Observed (black) / Fitted (red)',main='Interpolation Fit of Exponential Smoothing')
plot(myresid,ylab='Residuals',main='Interpolation Prediction Errors')
par(op)
dev.off()
bitmap(file='test2.png')
p <- predict(fit, par1, prediction.interval=TRUE)
np <- length(p[,1])
plot(fit,p,ylab='Observed (black) / Fitted (red)',main='Extrapolation Fit of Exponential Smoothing')
dev.off()
bitmap(file='test3.png')
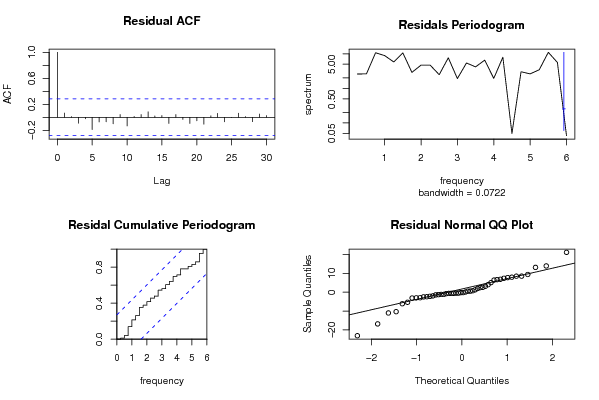
op <- par(mfrow = c(2,2))
acf(as.numeric(myresid),lag.max = nx/2,main='Residual ACF')
spectrum(myresid,main='Residals Periodogram')
cpgram(myresid,main='Residal Cumulative Periodogram')
qqnorm(myresid,main='Residual Normal QQ Plot')
qqline(myresid)
par(op)
dev.off()
load(file='createtable')
a<-table.start()
a<-table.row.start(a)
a<-table.element(a,'Estimated Parameters of Exponential Smoothing',2,TRUE)
a<-table.row.end(a)
a<-table.row.start(a)
a<-table.element(a,'Parameter',header=TRUE)
a<-table.element(a,'Value',header=TRUE)
a<-table.row.end(a)
a<-table.row.start(a)
a<-table.element(a,'alpha',header=TRUE)
a<-table.element(a,fit$alpha)
a<-table.row.end(a)
a<-table.row.start(a)
a<-table.element(a,'beta',header=TRUE)
a<-table.element(a,fit$beta)
a<-table.row.end(a)
a<-table.row.start(a)
a<-table.element(a,'gamma',header=TRUE)
a<-table.element(a,fit$gamma)
a<-table.row.end(a)
a<-table.end(a)
table.save(a,file='mytable.tab')
a<-table.start()
a<-table.row.start(a)
a<-table.element(a,'Interpolation Forecasts of Exponential Smoothing',4,TRUE)
a<-table.row.end(a)
a<-table.row.start(a)
a<-table.element(a,'t',header=TRUE)
a<-table.element(a,'Observed',header=TRUE)
a<-table.element(a,'Fitted',header=TRUE)
a<-table.element(a,'Residuals',header=TRUE)
a<-table.row.end(a)
for (i in 1:nxmK) {
a<-table.row.start(a)
a<-table.element(a,i+K,header=TRUE)
a<-table.element(a,x[i+K])
a<-table.element(a,fit$fitted[i,'xhat'])
a<-table.element(a,myresid[i])
a<-table.row.end(a)
}
a<-table.end(a)
table.save(a,file='mytable1.tab')
a<-table.start()
a<-table.row.start(a)
a<-table.element(a,'Extrapolation Forecasts of Exponential Smoothing',4,TRUE)
a<-table.row.end(a)
a<-table.row.start(a)
a<-table.element(a,'t',header=TRUE)
a<-table.element(a,'Forecast',header=TRUE)
a<-table.element(a,'95% Lower Bound',header=TRUE)
a<-table.element(a,'95% Upper Bound',header=TRUE)
a<-table.row.end(a)
for (i in 1:np) {
a<-table.row.start(a)
a<-table.element(a,nx+i,header=TRUE)
a<-table.element(a,p[i,'fit'])
a<-table.element(a,p[i,'lwr'])
a<-table.element(a,p[i,'upr'])
a<-table.row.end(a)
}
a<-table.end(a)
table.save(a,file='mytable2.tab')