Free Statistics

of Irreproducible Research!

Author's title

Author*The author of this computation has been verified*
R Software Modulerwasp_autocorrelation.wasp
Title produced by software(Partial) Autocorrelation Function
Date of computationFri, 04 Dec 2009 10:40:48 -0700
Cite this page as followsStatistical Computations at FreeStatistics.org, Office for Research Development and Education, URL https://freestatistics.org/blog/index.php?v=date/2009/Dec/04/t1259949434rgck6kyj48j7ual.htm/, Retrieved Sun, 28 Apr 2024 05:55:50 +0000
Statistical Computations at FreeStatistics.org, Office for Research Development and Education, URL https://freestatistics.org/blog/index.php?pk=63978, Retrieved Sun, 28 Apr 2024 05:55:50 +0000
QR Codes:

Original text written by user:
IsPrivate?No (this computation is public)
User-defined keywords
Estimated Impact96
Family? (F = Feedback message, R = changed R code, M = changed R Module, P = changed Parameters, D = changed Data)
-     [Univariate Data Series] [data set] [2008-12-01 19:54:57] [b98453cac15ba1066b407e146608df68]
- RMP   [(Partial) Autocorrelation Function] [] [2009-11-27 14:46:03] [b98453cac15ba1066b407e146608df68]
-    D      [(Partial) Autocorrelation Function] [] [2009-12-04 17:40:48] [e76c6d261190c0179bc6006a5cdb804c] [Current]
Feedback Forum

Post a new message
Dataseries X:
10800
10642
10269
10189
9876
10164
9906
10003
10564
10221
10052
10512
10573
10821
10167
10901
10896
10934
11059
10513
10270
10399
10740
10263
9883
10204
10201
10416
10557
10166
10066
10117
9973
10360
10133
10667
10883
10794
11212
11242
11483
11106
11019
10767
10577
10859
10575
10680
10926
11781
11241
12347
12699
12214
12066
12085
11894
11793
15567
16135


Summary of computational transaction
Raw Inputview raw input (R code)
Raw Outputview raw output of R engine
Computing time1 seconds
R Server'Gwilym Jenkins' @ 72.249.127.135

\begin{tabular}{lllllllll}
\hline
Summary of computational transaction \tabularnewline
Raw Input & view raw input (R code)  \tabularnewline
Raw Output & view raw output of R engine  \tabularnewline
Computing time & 1 seconds \tabularnewline
R Server & 'Gwilym Jenkins' @ 72.249.127.135 \tabularnewline
\hline
\end{tabular}
%Source: https://freestatistics.org/blog/index.php?pk=63978&T=0

[TABLE]
[ROW][C]Summary of computational transaction[/C][/ROW]
[ROW][C]Raw Input[/C][C]view raw input (R code) [/C][/ROW]
[ROW][C]Raw Output[/C][C]view raw output of R engine [/C][/ROW]
[ROW][C]Computing time[/C][C]1 seconds[/C][/ROW]
[ROW][C]R Server[/C][C]'Gwilym Jenkins' @ 72.249.127.135[/C][/ROW]
[/TABLE]
Source: https://freestatistics.org/blog/index.php?pk=63978&T=0

Globally Unique Identifier (entire table): ba.freestatistics.org/blog/index.php?pk=63978&T=0

As an alternative you can also use a QR Code:  

The GUIDs for individual cells are displayed in the table below:

Summary of computational transaction
Raw Inputview raw input (R code)
Raw Outputview raw output of R engine
Computing time1 seconds
R Server'Gwilym Jenkins' @ 72.249.127.135


Autocorrelation Function
Time lag kACF(k)T-STATP-value
10.6785245.25581e-06
20.3949823.05950.001656
30.3790282.93590.002354
40.3460762.68070.004736
50.309472.39710.009827
60.3030132.34710.011118
70.2862262.21710.015208
80.1757881.36160.0892
90.1306111.01170.157869
100.1275150.98770.163627
110.0540620.41880.338443
120.0368070.28510.388273
130.0507070.39280.347939
140.0506880.39260.347994
150.0335250.25970.397997
160.0549350.42550.335988
170.0667940.51740.303396
180.080830.62610.266809
190.0744950.5770.283036
200.0509790.39490.347165
210.0122750.09510.462283
22-0.016052-0.12430.450733
23-0.025542-0.19790.421915
24-0.077371-0.59930.27561
25-0.112102-0.86830.194335
26-0.127096-0.98450.164417
27-0.14403-1.11570.134509
28-0.150294-1.16420.124481
29-0.151572-1.17410.122503
30-0.123062-0.95320.172149
31-0.114587-0.88760.189153
32-0.136332-1.0560.147596
33-0.14304-1.1080.136146
34-0.149918-1.16130.125068
35-0.149755-1.160.125323
36-0.086407-0.66930.252934

\begin{tabular}{lllllllll}
\hline
Autocorrelation Function \tabularnewline
Time lag k & ACF(k) & T-STAT & P-value \tabularnewline
1 & 0.678524 & 5.2558 & 1e-06 \tabularnewline
2 & 0.394982 & 3.0595 & 0.001656 \tabularnewline
3 & 0.379028 & 2.9359 & 0.002354 \tabularnewline
4 & 0.346076 & 2.6807 & 0.004736 \tabularnewline
5 & 0.30947 & 2.3971 & 0.009827 \tabularnewline
6 & 0.303013 & 2.3471 & 0.011118 \tabularnewline
7 & 0.286226 & 2.2171 & 0.015208 \tabularnewline
8 & 0.175788 & 1.3616 & 0.0892 \tabularnewline
9 & 0.130611 & 1.0117 & 0.157869 \tabularnewline
10 & 0.127515 & 0.9877 & 0.163627 \tabularnewline
11 & 0.054062 & 0.4188 & 0.338443 \tabularnewline
12 & 0.036807 & 0.2851 & 0.388273 \tabularnewline
13 & 0.050707 & 0.3928 & 0.347939 \tabularnewline
14 & 0.050688 & 0.3926 & 0.347994 \tabularnewline
15 & 0.033525 & 0.2597 & 0.397997 \tabularnewline
16 & 0.054935 & 0.4255 & 0.335988 \tabularnewline
17 & 0.066794 & 0.5174 & 0.303396 \tabularnewline
18 & 0.08083 & 0.6261 & 0.266809 \tabularnewline
19 & 0.074495 & 0.577 & 0.283036 \tabularnewline
20 & 0.050979 & 0.3949 & 0.347165 \tabularnewline
21 & 0.012275 & 0.0951 & 0.462283 \tabularnewline
22 & -0.016052 & -0.1243 & 0.450733 \tabularnewline
23 & -0.025542 & -0.1979 & 0.421915 \tabularnewline
24 & -0.077371 & -0.5993 & 0.27561 \tabularnewline
25 & -0.112102 & -0.8683 & 0.194335 \tabularnewline
26 & -0.127096 & -0.9845 & 0.164417 \tabularnewline
27 & -0.14403 & -1.1157 & 0.134509 \tabularnewline
28 & -0.150294 & -1.1642 & 0.124481 \tabularnewline
29 & -0.151572 & -1.1741 & 0.122503 \tabularnewline
30 & -0.123062 & -0.9532 & 0.172149 \tabularnewline
31 & -0.114587 & -0.8876 & 0.189153 \tabularnewline
32 & -0.136332 & -1.056 & 0.147596 \tabularnewline
33 & -0.14304 & -1.108 & 0.136146 \tabularnewline
34 & -0.149918 & -1.1613 & 0.125068 \tabularnewline
35 & -0.149755 & -1.16 & 0.125323 \tabularnewline
36 & -0.086407 & -0.6693 & 0.252934 \tabularnewline
\hline
\end{tabular}
%Source: https://freestatistics.org/blog/index.php?pk=63978&T=1

[TABLE]
[ROW][C]Autocorrelation Function[/C][/ROW]
[ROW][C]Time lag k[/C][C]ACF(k)[/C][C]T-STAT[/C][C]P-value[/C][/ROW]
[ROW][C]1[/C][C]0.678524[/C][C]5.2558[/C][C]1e-06[/C][/ROW]
[ROW][C]2[/C][C]0.394982[/C][C]3.0595[/C][C]0.001656[/C][/ROW]
[ROW][C]3[/C][C]0.379028[/C][C]2.9359[/C][C]0.002354[/C][/ROW]
[ROW][C]4[/C][C]0.346076[/C][C]2.6807[/C][C]0.004736[/C][/ROW]
[ROW][C]5[/C][C]0.30947[/C][C]2.3971[/C][C]0.009827[/C][/ROW]
[ROW][C]6[/C][C]0.303013[/C][C]2.3471[/C][C]0.011118[/C][/ROW]
[ROW][C]7[/C][C]0.286226[/C][C]2.2171[/C][C]0.015208[/C][/ROW]
[ROW][C]8[/C][C]0.175788[/C][C]1.3616[/C][C]0.0892[/C][/ROW]
[ROW][C]9[/C][C]0.130611[/C][C]1.0117[/C][C]0.157869[/C][/ROW]
[ROW][C]10[/C][C]0.127515[/C][C]0.9877[/C][C]0.163627[/C][/ROW]
[ROW][C]11[/C][C]0.054062[/C][C]0.4188[/C][C]0.338443[/C][/ROW]
[ROW][C]12[/C][C]0.036807[/C][C]0.2851[/C][C]0.388273[/C][/ROW]
[ROW][C]13[/C][C]0.050707[/C][C]0.3928[/C][C]0.347939[/C][/ROW]
[ROW][C]14[/C][C]0.050688[/C][C]0.3926[/C][C]0.347994[/C][/ROW]
[ROW][C]15[/C][C]0.033525[/C][C]0.2597[/C][C]0.397997[/C][/ROW]
[ROW][C]16[/C][C]0.054935[/C][C]0.4255[/C][C]0.335988[/C][/ROW]
[ROW][C]17[/C][C]0.066794[/C][C]0.5174[/C][C]0.303396[/C][/ROW]
[ROW][C]18[/C][C]0.08083[/C][C]0.6261[/C][C]0.266809[/C][/ROW]
[ROW][C]19[/C][C]0.074495[/C][C]0.577[/C][C]0.283036[/C][/ROW]
[ROW][C]20[/C][C]0.050979[/C][C]0.3949[/C][C]0.347165[/C][/ROW]
[ROW][C]21[/C][C]0.012275[/C][C]0.0951[/C][C]0.462283[/C][/ROW]
[ROW][C]22[/C][C]-0.016052[/C][C]-0.1243[/C][C]0.450733[/C][/ROW]
[ROW][C]23[/C][C]-0.025542[/C][C]-0.1979[/C][C]0.421915[/C][/ROW]
[ROW][C]24[/C][C]-0.077371[/C][C]-0.5993[/C][C]0.27561[/C][/ROW]
[ROW][C]25[/C][C]-0.112102[/C][C]-0.8683[/C][C]0.194335[/C][/ROW]
[ROW][C]26[/C][C]-0.127096[/C][C]-0.9845[/C][C]0.164417[/C][/ROW]
[ROW][C]27[/C][C]-0.14403[/C][C]-1.1157[/C][C]0.134509[/C][/ROW]
[ROW][C]28[/C][C]-0.150294[/C][C]-1.1642[/C][C]0.124481[/C][/ROW]
[ROW][C]29[/C][C]-0.151572[/C][C]-1.1741[/C][C]0.122503[/C][/ROW]
[ROW][C]30[/C][C]-0.123062[/C][C]-0.9532[/C][C]0.172149[/C][/ROW]
[ROW][C]31[/C][C]-0.114587[/C][C]-0.8876[/C][C]0.189153[/C][/ROW]
[ROW][C]32[/C][C]-0.136332[/C][C]-1.056[/C][C]0.147596[/C][/ROW]
[ROW][C]33[/C][C]-0.14304[/C][C]-1.108[/C][C]0.136146[/C][/ROW]
[ROW][C]34[/C][C]-0.149918[/C][C]-1.1613[/C][C]0.125068[/C][/ROW]
[ROW][C]35[/C][C]-0.149755[/C][C]-1.16[/C][C]0.125323[/C][/ROW]
[ROW][C]36[/C][C]-0.086407[/C][C]-0.6693[/C][C]0.252934[/C][/ROW]
[/TABLE]
Source: https://freestatistics.org/blog/index.php?pk=63978&T=1

Globally Unique Identifier (entire table): ba.freestatistics.org/blog/index.php?pk=63978&T=1

As an alternative you can also use a QR Code:  

The GUIDs for individual cells are displayed in the table below:

Autocorrelation Function
Time lag kACF(k)T-STATP-value
10.6785245.25581e-06
20.3949823.05950.001656
30.3790282.93590.002354
40.3460762.68070.004736
50.309472.39710.009827
60.3030132.34710.011118
70.2862262.21710.015208
80.1757881.36160.0892
90.1306111.01170.157869
100.1275150.98770.163627
110.0540620.41880.338443
120.0368070.28510.388273
130.0507070.39280.347939
140.0506880.39260.347994
150.0335250.25970.397997
160.0549350.42550.335988
170.0667940.51740.303396
180.080830.62610.266809
190.0744950.5770.283036
200.0509790.39490.347165
210.0122750.09510.462283
22-0.016052-0.12430.450733
23-0.025542-0.19790.421915
24-0.077371-0.59930.27561
25-0.112102-0.86830.194335
26-0.127096-0.98450.164417
27-0.14403-1.11570.134509
28-0.150294-1.16420.124481
29-0.151572-1.17410.122503
30-0.123062-0.95320.172149
31-0.114587-0.88760.189153
32-0.136332-1.0560.147596
33-0.14304-1.1080.136146
34-0.149918-1.16130.125068
35-0.149755-1.160.125323
36-0.086407-0.66930.252934


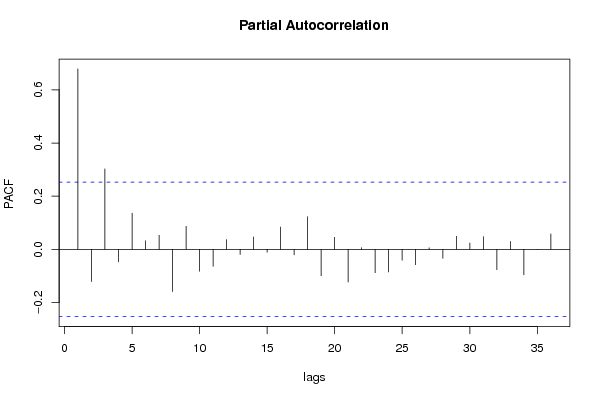
Partial Autocorrelation Function
Time lag kPACF(k)T-STATP-value
10.6785245.25581e-06
2-0.121222-0.9390.175752
30.3024152.34250.011245
4-0.046817-0.36260.359074
50.1360011.05350.148178
60.032160.24910.402064
70.0530590.4110.341272
8-0.158654-1.22890.111948
90.0865750.67060.252521
10-0.08206-0.63560.263716
11-0.063927-0.49520.311143
120.036890.28580.388027
13-0.019044-0.14750.441611
140.0467180.36190.359357
15-0.010361-0.08030.468149
160.084020.65080.258826
17-0.020447-0.15840.437344
180.1230770.95340.172119
19-0.099281-0.7690.222446
200.0455910.35310.36261
21-0.122946-0.95230.172374
220.006550.05070.479853
23-0.087793-0.680.249547
24-0.08512-0.65930.256102
25-0.040538-0.3140.377304
26-0.057469-0.44520.328906
270.0059060.04570.481833
28-0.033649-0.26060.397629
290.0491780.38090.352301
300.0237840.18420.427227
310.0478520.37070.356099
32-0.076398-0.59180.278112
330.0297360.23030.409307
34-0.095826-0.74230.230412
35-0.000164-0.00130.499497
360.0579470.44890.327576

\begin{tabular}{lllllllll}
\hline
Partial Autocorrelation Function \tabularnewline
Time lag k & PACF(k) & T-STAT & P-value \tabularnewline
1 & 0.678524 & 5.2558 & 1e-06 \tabularnewline
2 & -0.121222 & -0.939 & 0.175752 \tabularnewline
3 & 0.302415 & 2.3425 & 0.011245 \tabularnewline
4 & -0.046817 & -0.3626 & 0.359074 \tabularnewline
5 & 0.136001 & 1.0535 & 0.148178 \tabularnewline
6 & 0.03216 & 0.2491 & 0.402064 \tabularnewline
7 & 0.053059 & 0.411 & 0.341272 \tabularnewline
8 & -0.158654 & -1.2289 & 0.111948 \tabularnewline
9 & 0.086575 & 0.6706 & 0.252521 \tabularnewline
10 & -0.08206 & -0.6356 & 0.263716 \tabularnewline
11 & -0.063927 & -0.4952 & 0.311143 \tabularnewline
12 & 0.03689 & 0.2858 & 0.388027 \tabularnewline
13 & -0.019044 & -0.1475 & 0.441611 \tabularnewline
14 & 0.046718 & 0.3619 & 0.359357 \tabularnewline
15 & -0.010361 & -0.0803 & 0.468149 \tabularnewline
16 & 0.08402 & 0.6508 & 0.258826 \tabularnewline
17 & -0.020447 & -0.1584 & 0.437344 \tabularnewline
18 & 0.123077 & 0.9534 & 0.172119 \tabularnewline
19 & -0.099281 & -0.769 & 0.222446 \tabularnewline
20 & 0.045591 & 0.3531 & 0.36261 \tabularnewline
21 & -0.122946 & -0.9523 & 0.172374 \tabularnewline
22 & 0.00655 & 0.0507 & 0.479853 \tabularnewline
23 & -0.087793 & -0.68 & 0.249547 \tabularnewline
24 & -0.08512 & -0.6593 & 0.256102 \tabularnewline
25 & -0.040538 & -0.314 & 0.377304 \tabularnewline
26 & -0.057469 & -0.4452 & 0.328906 \tabularnewline
27 & 0.005906 & 0.0457 & 0.481833 \tabularnewline
28 & -0.033649 & -0.2606 & 0.397629 \tabularnewline
29 & 0.049178 & 0.3809 & 0.352301 \tabularnewline
30 & 0.023784 & 0.1842 & 0.427227 \tabularnewline
31 & 0.047852 & 0.3707 & 0.356099 \tabularnewline
32 & -0.076398 & -0.5918 & 0.278112 \tabularnewline
33 & 0.029736 & 0.2303 & 0.409307 \tabularnewline
34 & -0.095826 & -0.7423 & 0.230412 \tabularnewline
35 & -0.000164 & -0.0013 & 0.499497 \tabularnewline
36 & 0.057947 & 0.4489 & 0.327576 \tabularnewline
\hline
\end{tabular}
%Source: https://freestatistics.org/blog/index.php?pk=63978&T=2

[TABLE]
[ROW][C]Partial Autocorrelation Function[/C][/ROW]
[ROW][C]Time lag k[/C][C]PACF(k)[/C][C]T-STAT[/C][C]P-value[/C][/ROW]
[ROW][C]1[/C][C]0.678524[/C][C]5.2558[/C][C]1e-06[/C][/ROW]
[ROW][C]2[/C][C]-0.121222[/C][C]-0.939[/C][C]0.175752[/C][/ROW]
[ROW][C]3[/C][C]0.302415[/C][C]2.3425[/C][C]0.011245[/C][/ROW]
[ROW][C]4[/C][C]-0.046817[/C][C]-0.3626[/C][C]0.359074[/C][/ROW]
[ROW][C]5[/C][C]0.136001[/C][C]1.0535[/C][C]0.148178[/C][/ROW]
[ROW][C]6[/C][C]0.03216[/C][C]0.2491[/C][C]0.402064[/C][/ROW]
[ROW][C]7[/C][C]0.053059[/C][C]0.411[/C][C]0.341272[/C][/ROW]
[ROW][C]8[/C][C]-0.158654[/C][C]-1.2289[/C][C]0.111948[/C][/ROW]
[ROW][C]9[/C][C]0.086575[/C][C]0.6706[/C][C]0.252521[/C][/ROW]
[ROW][C]10[/C][C]-0.08206[/C][C]-0.6356[/C][C]0.263716[/C][/ROW]
[ROW][C]11[/C][C]-0.063927[/C][C]-0.4952[/C][C]0.311143[/C][/ROW]
[ROW][C]12[/C][C]0.03689[/C][C]0.2858[/C][C]0.388027[/C][/ROW]
[ROW][C]13[/C][C]-0.019044[/C][C]-0.1475[/C][C]0.441611[/C][/ROW]
[ROW][C]14[/C][C]0.046718[/C][C]0.3619[/C][C]0.359357[/C][/ROW]
[ROW][C]15[/C][C]-0.010361[/C][C]-0.0803[/C][C]0.468149[/C][/ROW]
[ROW][C]16[/C][C]0.08402[/C][C]0.6508[/C][C]0.258826[/C][/ROW]
[ROW][C]17[/C][C]-0.020447[/C][C]-0.1584[/C][C]0.437344[/C][/ROW]
[ROW][C]18[/C][C]0.123077[/C][C]0.9534[/C][C]0.172119[/C][/ROW]
[ROW][C]19[/C][C]-0.099281[/C][C]-0.769[/C][C]0.222446[/C][/ROW]
[ROW][C]20[/C][C]0.045591[/C][C]0.3531[/C][C]0.36261[/C][/ROW]
[ROW][C]21[/C][C]-0.122946[/C][C]-0.9523[/C][C]0.172374[/C][/ROW]
[ROW][C]22[/C][C]0.00655[/C][C]0.0507[/C][C]0.479853[/C][/ROW]
[ROW][C]23[/C][C]-0.087793[/C][C]-0.68[/C][C]0.249547[/C][/ROW]
[ROW][C]24[/C][C]-0.08512[/C][C]-0.6593[/C][C]0.256102[/C][/ROW]
[ROW][C]25[/C][C]-0.040538[/C][C]-0.314[/C][C]0.377304[/C][/ROW]
[ROW][C]26[/C][C]-0.057469[/C][C]-0.4452[/C][C]0.328906[/C][/ROW]
[ROW][C]27[/C][C]0.005906[/C][C]0.0457[/C][C]0.481833[/C][/ROW]
[ROW][C]28[/C][C]-0.033649[/C][C]-0.2606[/C][C]0.397629[/C][/ROW]
[ROW][C]29[/C][C]0.049178[/C][C]0.3809[/C][C]0.352301[/C][/ROW]
[ROW][C]30[/C][C]0.023784[/C][C]0.1842[/C][C]0.427227[/C][/ROW]
[ROW][C]31[/C][C]0.047852[/C][C]0.3707[/C][C]0.356099[/C][/ROW]
[ROW][C]32[/C][C]-0.076398[/C][C]-0.5918[/C][C]0.278112[/C][/ROW]
[ROW][C]33[/C][C]0.029736[/C][C]0.2303[/C][C]0.409307[/C][/ROW]
[ROW][C]34[/C][C]-0.095826[/C][C]-0.7423[/C][C]0.230412[/C][/ROW]
[ROW][C]35[/C][C]-0.000164[/C][C]-0.0013[/C][C]0.499497[/C][/ROW]
[ROW][C]36[/C][C]0.057947[/C][C]0.4489[/C][C]0.327576[/C][/ROW]
[/TABLE]
Source: https://freestatistics.org/blog/index.php?pk=63978&T=2

Globally Unique Identifier (entire table): ba.freestatistics.org/blog/index.php?pk=63978&T=2

As an alternative you can also use a QR Code:  

The GUIDs for individual cells are displayed in the table below:

Partial Autocorrelation Function
Time lag kPACF(k)T-STATP-value
10.6785245.25581e-06
2-0.121222-0.9390.175752
30.3024152.34250.011245
4-0.046817-0.36260.359074
50.1360011.05350.148178
60.032160.24910.402064
70.0530590.4110.341272
8-0.158654-1.22890.111948
90.0865750.67060.252521
10-0.08206-0.63560.263716
11-0.063927-0.49520.311143
120.036890.28580.388027
13-0.019044-0.14750.441611
140.0467180.36190.359357
15-0.010361-0.08030.468149
160.084020.65080.258826
17-0.020447-0.15840.437344
180.1230770.95340.172119
19-0.099281-0.7690.222446
200.0455910.35310.36261
21-0.122946-0.95230.172374
220.006550.05070.479853
23-0.087793-0.680.249547
24-0.08512-0.65930.256102
25-0.040538-0.3140.377304
26-0.057469-0.44520.328906
270.0059060.04570.481833
28-0.033649-0.26060.397629
290.0491780.38090.352301
300.0237840.18420.427227
310.0478520.37070.356099
32-0.076398-0.59180.278112
330.0297360.23030.409307
34-0.095826-0.74230.230412
35-0.000164-0.00130.499497
360.0579470.44890.327576


Parameters (Session):
par1 = 36 ; par2 = 1 ; par3 = 0 ; par4 = 0 ; par5 = 12 ; par6 = MA ; par7 = 0.95 ;
Parameters (R input):
par1 = 36 ; par2 = 1 ; par3 = 0 ; par4 = 0 ; par5 = 12 ; par6 = MA ; par7 = 0.95 ;
R code (references can be found in the software module):
if (par1 == 'Default') {
par1 = 10*log10(length(x))
} else {
par1 <- as.numeric(par1)
}
par2 <- as.numeric(par2)
par3 <- as.numeric(par3)
par4 <- as.numeric(par4)
par5 <- as.numeric(par5)
if (par6 == 'White Noise') par6 <- 'white' else par6 <- 'ma'
par7 <- as.numeric(par7)
if (par2 == 0) {
x <- log(x)
} else {
x <- (x ^ par2 - 1) / par2
}
if (par3 > 0) x <- diff(x,lag=1,difference=par3)
if (par4 > 0) x <- diff(x,lag=par5,difference=par4)
bitmap(file='pic1.png')
racf <- acf(x, par1, main='Autocorrelation', xlab='time lag', ylab='ACF', ci.type=par6, ci=par7, sub=paste('(lambda=',par2,', d=',par3,', D=',par4,', CI=', par7, ', CI type=',par6,')',sep=''))
dev.off()
bitmap(file='pic2.png')
rpacf <- pacf(x,par1,main='Partial Autocorrelation',xlab='lags',ylab='PACF')
dev.off()
(myacf <- c(racf$acf))
(mypacf <- c(rpacf$acf))
lengthx <- length(x)
sqrtn <- sqrt(lengthx)
load(file='createtable')
a<-table.start()
a<-table.row.start(a)
a<-table.element(a,'Autocorrelation Function',4,TRUE)
a<-table.row.end(a)
a<-table.row.start(a)
a<-table.element(a,'Time lag k',header=TRUE)
a<-table.element(a,hyperlink('basics.htm','ACF(k)','click here for more information about the Autocorrelation Function'),header=TRUE)
a<-table.element(a,'T-STAT',header=TRUE)
a<-table.element(a,'P-value',header=TRUE)
a<-table.row.end(a)
for (i in 2:(par1+1)) {
a<-table.row.start(a)
a<-table.element(a,i-1,header=TRUE)
a<-table.element(a,round(myacf[i],6))
mytstat <- myacf[i]*sqrtn
a<-table.element(a,round(mytstat,4))
a<-table.element(a,round(1-pt(abs(mytstat),lengthx),6))
a<-table.row.end(a)
}
a<-table.end(a)
table.save(a,file='mytable.tab')
a<-table.start()
a<-table.row.start(a)
a<-table.element(a,'Partial Autocorrelation Function',4,TRUE)
a<-table.row.end(a)
a<-table.row.start(a)
a<-table.element(a,'Time lag k',header=TRUE)
a<-table.element(a,hyperlink('basics.htm','PACF(k)','click here for more information about the Partial Autocorrelation Function'),header=TRUE)
a<-table.element(a,'T-STAT',header=TRUE)
a<-table.element(a,'P-value',header=TRUE)
a<-table.row.end(a)
for (i in 1:par1) {
a<-table.row.start(a)
a<-table.element(a,i,header=TRUE)
a<-table.element(a,round(mypacf[i],6))
mytstat <- mypacf[i]*sqrtn
a<-table.element(a,round(mytstat,4))
a<-table.element(a,round(1-pt(abs(mytstat),lengthx),6))
a<-table.row.end(a)
}
a<-table.end(a)
table.save(a,file='mytable1.tab')