Free Statistics

of Irreproducible Research!

Author's title

Author*The author of this computation has been verified*
R Software Modulerwasp_autocorrelation.wasp
Title produced by software(Partial) Autocorrelation Function
Date of computationFri, 04 Dec 2009 11:00:23 -0700
Cite this page as followsStatistical Computations at FreeStatistics.org, Office for Research Development and Education, URL https://freestatistics.org/blog/index.php?v=date/2009/Dec/04/t1259949684fwth3f8a0j0c29u.htm/, Retrieved Sat, 27 Apr 2024 17:08:16 +0000
Statistical Computations at FreeStatistics.org, Office for Research Development and Education, URL https://freestatistics.org/blog/index.php?pk=63987, Retrieved Sat, 27 Apr 2024 17:08:16 +0000
QR Codes:

Original text written by user:
IsPrivate?No (this computation is public)
User-defined keywords
Estimated Impact95
Family? (F = Feedback message, R = changed R code, M = changed R Module, P = changed Parameters, D = changed Data)
-     [Univariate Data Series] [data set] [2008-12-01 19:54:57] [b98453cac15ba1066b407e146608df68]
- RMP   [(Partial) Autocorrelation Function] [] [2009-11-27 14:47:30] [b98453cac15ba1066b407e146608df68]
-    D      [(Partial) Autocorrelation Function] [] [2009-12-04 18:00:23] [e76c6d261190c0179bc6006a5cdb804c] [Current]
Feedback Forum

Post a new message
Dataseries X:
10800
10642
10269
10189
9876
10164
9906
10003
10564
10221
10052
10512
10573
10821
10167
10901
10896
10934
11059
10513
10270
10399
10740
10263
9883
10204
10201
10416
10557
10166
10066
10117
9973
10360
10133
10667
10883
10794
11212
11242
11483
11106
11019
10767
10577
10859
10575
10680
10926
11781
11241
12347
12699
12214
12066
12085
11894
11793
15567
16135


Summary of computational transaction
Raw Inputview raw input (R code)
Raw Outputview raw output of R engine
Computing time1 seconds
R Server'Gwilym Jenkins' @ 72.249.127.135

\begin{tabular}{lllllllll}
\hline
Summary of computational transaction \tabularnewline
Raw Input & view raw input (R code)  \tabularnewline
Raw Output & view raw output of R engine  \tabularnewline
Computing time & 1 seconds \tabularnewline
R Server & 'Gwilym Jenkins' @ 72.249.127.135 \tabularnewline
\hline
\end{tabular}
%Source: https://freestatistics.org/blog/index.php?pk=63987&T=0

[TABLE]
[ROW][C]Summary of computational transaction[/C][/ROW]
[ROW][C]Raw Input[/C][C]view raw input (R code) [/C][/ROW]
[ROW][C]Raw Output[/C][C]view raw output of R engine [/C][/ROW]
[ROW][C]Computing time[/C][C]1 seconds[/C][/ROW]
[ROW][C]R Server[/C][C]'Gwilym Jenkins' @ 72.249.127.135[/C][/ROW]
[/TABLE]
Source: https://freestatistics.org/blog/index.php?pk=63987&T=0

Globally Unique Identifier (entire table): ba.freestatistics.org/blog/index.php?pk=63987&T=0

As an alternative you can also use a QR Code:  

The GUIDs for individual cells are displayed in the table below:

Summary of computational transaction
Raw Inputview raw input (R code)
Raw Outputview raw output of R engine
Computing time1 seconds
R Server'Gwilym Jenkins' @ 72.249.127.135


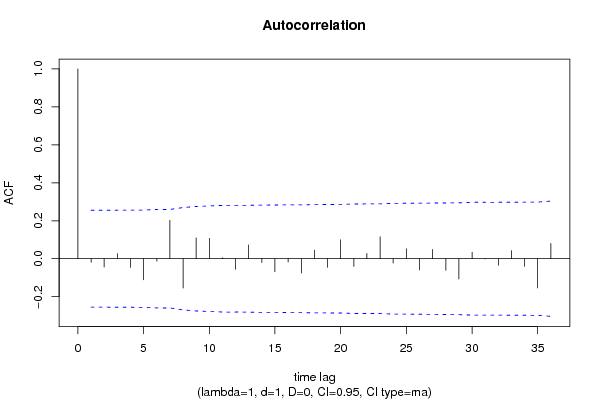
Autocorrelation Function
Time lag kACF(k)T-STATP-value
1-0.018996-0.14590.442243
2-0.043978-0.33780.368356
30.0271890.20880.417645
4-0.046202-0.35490.361972
5-0.111209-0.85420.198221
6-0.012777-0.09810.461075
70.2023371.55420.062745
8-0.154358-1.18560.120258
90.1097460.8430.201323
100.1072330.82370.206721
110.0046440.03570.485834
12-0.055862-0.42910.334712
130.0727530.55880.289198
14-0.020139-0.15470.438796
15-0.068977-0.52980.299113
16-0.017845-0.13710.445722
17-0.075837-0.58250.28122
180.0451030.34640.365122
19-0.045134-0.34670.365033
200.0997570.76620.223292
21-0.040429-0.31050.378621
220.0280290.21530.415141
230.1151570.88450.189999
24-0.023033-0.17690.430087
250.0523540.40210.344517
26-0.059042-0.45350.325922
270.049060.37680.353823
28-0.06092-0.46790.320778
29-0.10676-0.820.207748
300.0346220.26590.395607
31-0.000934-0.00720.49715
32-0.034212-0.26280.396816
330.0433030.33260.370302
34-0.040465-0.31080.378516
35-0.154129-1.18390.120603
360.0803010.61680.269869

\begin{tabular}{lllllllll}
\hline
Autocorrelation Function \tabularnewline
Time lag k & ACF(k) & T-STAT & P-value \tabularnewline
1 & -0.018996 & -0.1459 & 0.442243 \tabularnewline
2 & -0.043978 & -0.3378 & 0.368356 \tabularnewline
3 & 0.027189 & 0.2088 & 0.417645 \tabularnewline
4 & -0.046202 & -0.3549 & 0.361972 \tabularnewline
5 & -0.111209 & -0.8542 & 0.198221 \tabularnewline
6 & -0.012777 & -0.0981 & 0.461075 \tabularnewline
7 & 0.202337 & 1.5542 & 0.062745 \tabularnewline
8 & -0.154358 & -1.1856 & 0.120258 \tabularnewline
9 & 0.109746 & 0.843 & 0.201323 \tabularnewline
10 & 0.107233 & 0.8237 & 0.206721 \tabularnewline
11 & 0.004644 & 0.0357 & 0.485834 \tabularnewline
12 & -0.055862 & -0.4291 & 0.334712 \tabularnewline
13 & 0.072753 & 0.5588 & 0.289198 \tabularnewline
14 & -0.020139 & -0.1547 & 0.438796 \tabularnewline
15 & -0.068977 & -0.5298 & 0.299113 \tabularnewline
16 & -0.017845 & -0.1371 & 0.445722 \tabularnewline
17 & -0.075837 & -0.5825 & 0.28122 \tabularnewline
18 & 0.045103 & 0.3464 & 0.365122 \tabularnewline
19 & -0.045134 & -0.3467 & 0.365033 \tabularnewline
20 & 0.099757 & 0.7662 & 0.223292 \tabularnewline
21 & -0.040429 & -0.3105 & 0.378621 \tabularnewline
22 & 0.028029 & 0.2153 & 0.415141 \tabularnewline
23 & 0.115157 & 0.8845 & 0.189999 \tabularnewline
24 & -0.023033 & -0.1769 & 0.430087 \tabularnewline
25 & 0.052354 & 0.4021 & 0.344517 \tabularnewline
26 & -0.059042 & -0.4535 & 0.325922 \tabularnewline
27 & 0.04906 & 0.3768 & 0.353823 \tabularnewline
28 & -0.06092 & -0.4679 & 0.320778 \tabularnewline
29 & -0.10676 & -0.82 & 0.207748 \tabularnewline
30 & 0.034622 & 0.2659 & 0.395607 \tabularnewline
31 & -0.000934 & -0.0072 & 0.49715 \tabularnewline
32 & -0.034212 & -0.2628 & 0.396816 \tabularnewline
33 & 0.043303 & 0.3326 & 0.370302 \tabularnewline
34 & -0.040465 & -0.3108 & 0.378516 \tabularnewline
35 & -0.154129 & -1.1839 & 0.120603 \tabularnewline
36 & 0.080301 & 0.6168 & 0.269869 \tabularnewline
\hline
\end{tabular}
%Source: https://freestatistics.org/blog/index.php?pk=63987&T=1

[TABLE]
[ROW][C]Autocorrelation Function[/C][/ROW]
[ROW][C]Time lag k[/C][C]ACF(k)[/C][C]T-STAT[/C][C]P-value[/C][/ROW]
[ROW][C]1[/C][C]-0.018996[/C][C]-0.1459[/C][C]0.442243[/C][/ROW]
[ROW][C]2[/C][C]-0.043978[/C][C]-0.3378[/C][C]0.368356[/C][/ROW]
[ROW][C]3[/C][C]0.027189[/C][C]0.2088[/C][C]0.417645[/C][/ROW]
[ROW][C]4[/C][C]-0.046202[/C][C]-0.3549[/C][C]0.361972[/C][/ROW]
[ROW][C]5[/C][C]-0.111209[/C][C]-0.8542[/C][C]0.198221[/C][/ROW]
[ROW][C]6[/C][C]-0.012777[/C][C]-0.0981[/C][C]0.461075[/C][/ROW]
[ROW][C]7[/C][C]0.202337[/C][C]1.5542[/C][C]0.062745[/C][/ROW]
[ROW][C]8[/C][C]-0.154358[/C][C]-1.1856[/C][C]0.120258[/C][/ROW]
[ROW][C]9[/C][C]0.109746[/C][C]0.843[/C][C]0.201323[/C][/ROW]
[ROW][C]10[/C][C]0.107233[/C][C]0.8237[/C][C]0.206721[/C][/ROW]
[ROW][C]11[/C][C]0.004644[/C][C]0.0357[/C][C]0.485834[/C][/ROW]
[ROW][C]12[/C][C]-0.055862[/C][C]-0.4291[/C][C]0.334712[/C][/ROW]
[ROW][C]13[/C][C]0.072753[/C][C]0.5588[/C][C]0.289198[/C][/ROW]
[ROW][C]14[/C][C]-0.020139[/C][C]-0.1547[/C][C]0.438796[/C][/ROW]
[ROW][C]15[/C][C]-0.068977[/C][C]-0.5298[/C][C]0.299113[/C][/ROW]
[ROW][C]16[/C][C]-0.017845[/C][C]-0.1371[/C][C]0.445722[/C][/ROW]
[ROW][C]17[/C][C]-0.075837[/C][C]-0.5825[/C][C]0.28122[/C][/ROW]
[ROW][C]18[/C][C]0.045103[/C][C]0.3464[/C][C]0.365122[/C][/ROW]
[ROW][C]19[/C][C]-0.045134[/C][C]-0.3467[/C][C]0.365033[/C][/ROW]
[ROW][C]20[/C][C]0.099757[/C][C]0.7662[/C][C]0.223292[/C][/ROW]
[ROW][C]21[/C][C]-0.040429[/C][C]-0.3105[/C][C]0.378621[/C][/ROW]
[ROW][C]22[/C][C]0.028029[/C][C]0.2153[/C][C]0.415141[/C][/ROW]
[ROW][C]23[/C][C]0.115157[/C][C]0.8845[/C][C]0.189999[/C][/ROW]
[ROW][C]24[/C][C]-0.023033[/C][C]-0.1769[/C][C]0.430087[/C][/ROW]
[ROW][C]25[/C][C]0.052354[/C][C]0.4021[/C][C]0.344517[/C][/ROW]
[ROW][C]26[/C][C]-0.059042[/C][C]-0.4535[/C][C]0.325922[/C][/ROW]
[ROW][C]27[/C][C]0.04906[/C][C]0.3768[/C][C]0.353823[/C][/ROW]
[ROW][C]28[/C][C]-0.06092[/C][C]-0.4679[/C][C]0.320778[/C][/ROW]
[ROW][C]29[/C][C]-0.10676[/C][C]-0.82[/C][C]0.207748[/C][/ROW]
[ROW][C]30[/C][C]0.034622[/C][C]0.2659[/C][C]0.395607[/C][/ROW]
[ROW][C]31[/C][C]-0.000934[/C][C]-0.0072[/C][C]0.49715[/C][/ROW]
[ROW][C]32[/C][C]-0.034212[/C][C]-0.2628[/C][C]0.396816[/C][/ROW]
[ROW][C]33[/C][C]0.043303[/C][C]0.3326[/C][C]0.370302[/C][/ROW]
[ROW][C]34[/C][C]-0.040465[/C][C]-0.3108[/C][C]0.378516[/C][/ROW]
[ROW][C]35[/C][C]-0.154129[/C][C]-1.1839[/C][C]0.120603[/C][/ROW]
[ROW][C]36[/C][C]0.080301[/C][C]0.6168[/C][C]0.269869[/C][/ROW]
[/TABLE]
Source: https://freestatistics.org/blog/index.php?pk=63987&T=1

Globally Unique Identifier (entire table): ba.freestatistics.org/blog/index.php?pk=63987&T=1

As an alternative you can also use a QR Code:  

The GUIDs for individual cells are displayed in the table below:

Autocorrelation Function
Time lag kACF(k)T-STATP-value
1-0.018996-0.14590.442243
2-0.043978-0.33780.368356
30.0271890.20880.417645
4-0.046202-0.35490.361972
5-0.111209-0.85420.198221
6-0.012777-0.09810.461075
70.2023371.55420.062745
8-0.154358-1.18560.120258
90.1097460.8430.201323
100.1072330.82370.206721
110.0046440.03570.485834
12-0.055862-0.42910.334712
130.0727530.55880.289198
14-0.020139-0.15470.438796
15-0.068977-0.52980.299113
16-0.017845-0.13710.445722
17-0.075837-0.58250.28122
180.0451030.34640.365122
19-0.045134-0.34670.365033
200.0997570.76620.223292
21-0.040429-0.31050.378621
220.0280290.21530.415141
230.1151570.88450.189999
24-0.023033-0.17690.430087
250.0523540.40210.344517
26-0.059042-0.45350.325922
270.049060.37680.353823
28-0.06092-0.46790.320778
29-0.10676-0.820.207748
300.0346220.26590.395607
31-0.000934-0.00720.49715
32-0.034212-0.26280.396816
330.0433030.33260.370302
34-0.040465-0.31080.378516
35-0.154129-1.18390.120603
360.0803010.61680.269869


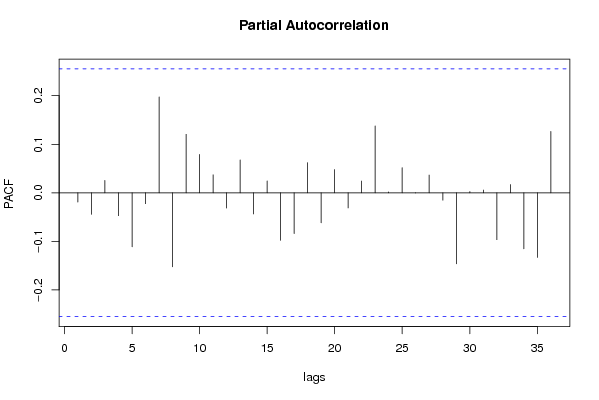
Partial Autocorrelation Function
Time lag kPACF(k)T-STATP-value
1-0.018996-0.14590.442243
2-0.044355-0.34070.367272
30.0255340.19610.422592
4-0.047277-0.36310.358898
5-0.111162-0.85380.198321
6-0.022504-0.17290.431676
70.1975941.51770.067209
8-0.152412-1.17070.123214
90.1205770.92620.179066
100.0789630.60650.273245
110.037010.28430.388596
12-0.031491-0.24190.404854
130.0676540.51970.302622
14-0.043659-0.33540.369274
150.0244230.18760.425918
16-0.097865-0.75170.227606
17-0.083944-0.64480.260782
180.0620610.47670.317668
19-0.061939-0.47580.318002
200.0479620.36840.356945
21-0.031281-0.24030.405476
220.0243090.18670.426261
230.1376741.05750.147299
240.0017920.01380.494531
250.0516640.39680.346458
26-0.000399-0.00310.498784
270.0366420.28150.389674
28-0.015125-0.11620.453954
29-0.146277-1.12360.132872
300.0026230.02010.491998
310.0057190.04390.482555
32-0.096477-0.74110.2308
330.0170530.1310.448116
34-0.115325-0.88580.189653
35-0.133139-1.02270.155322
360.1263310.97040.167912

\begin{tabular}{lllllllll}
\hline
Partial Autocorrelation Function \tabularnewline
Time lag k & PACF(k) & T-STAT & P-value \tabularnewline
1 & -0.018996 & -0.1459 & 0.442243 \tabularnewline
2 & -0.044355 & -0.3407 & 0.367272 \tabularnewline
3 & 0.025534 & 0.1961 & 0.422592 \tabularnewline
4 & -0.047277 & -0.3631 & 0.358898 \tabularnewline
5 & -0.111162 & -0.8538 & 0.198321 \tabularnewline
6 & -0.022504 & -0.1729 & 0.431676 \tabularnewline
7 & 0.197594 & 1.5177 & 0.067209 \tabularnewline
8 & -0.152412 & -1.1707 & 0.123214 \tabularnewline
9 & 0.120577 & 0.9262 & 0.179066 \tabularnewline
10 & 0.078963 & 0.6065 & 0.273245 \tabularnewline
11 & 0.03701 & 0.2843 & 0.388596 \tabularnewline
12 & -0.031491 & -0.2419 & 0.404854 \tabularnewline
13 & 0.067654 & 0.5197 & 0.302622 \tabularnewline
14 & -0.043659 & -0.3354 & 0.369274 \tabularnewline
15 & 0.024423 & 0.1876 & 0.425918 \tabularnewline
16 & -0.097865 & -0.7517 & 0.227606 \tabularnewline
17 & -0.083944 & -0.6448 & 0.260782 \tabularnewline
18 & 0.062061 & 0.4767 & 0.317668 \tabularnewline
19 & -0.061939 & -0.4758 & 0.318002 \tabularnewline
20 & 0.047962 & 0.3684 & 0.356945 \tabularnewline
21 & -0.031281 & -0.2403 & 0.405476 \tabularnewline
22 & 0.024309 & 0.1867 & 0.426261 \tabularnewline
23 & 0.137674 & 1.0575 & 0.147299 \tabularnewline
24 & 0.001792 & 0.0138 & 0.494531 \tabularnewline
25 & 0.051664 & 0.3968 & 0.346458 \tabularnewline
26 & -0.000399 & -0.0031 & 0.498784 \tabularnewline
27 & 0.036642 & 0.2815 & 0.389674 \tabularnewline
28 & -0.015125 & -0.1162 & 0.453954 \tabularnewline
29 & -0.146277 & -1.1236 & 0.132872 \tabularnewline
30 & 0.002623 & 0.0201 & 0.491998 \tabularnewline
31 & 0.005719 & 0.0439 & 0.482555 \tabularnewline
32 & -0.096477 & -0.7411 & 0.2308 \tabularnewline
33 & 0.017053 & 0.131 & 0.448116 \tabularnewline
34 & -0.115325 & -0.8858 & 0.189653 \tabularnewline
35 & -0.133139 & -1.0227 & 0.155322 \tabularnewline
36 & 0.126331 & 0.9704 & 0.167912 \tabularnewline
\hline
\end{tabular}
%Source: https://freestatistics.org/blog/index.php?pk=63987&T=2

[TABLE]
[ROW][C]Partial Autocorrelation Function[/C][/ROW]
[ROW][C]Time lag k[/C][C]PACF(k)[/C][C]T-STAT[/C][C]P-value[/C][/ROW]
[ROW][C]1[/C][C]-0.018996[/C][C]-0.1459[/C][C]0.442243[/C][/ROW]
[ROW][C]2[/C][C]-0.044355[/C][C]-0.3407[/C][C]0.367272[/C][/ROW]
[ROW][C]3[/C][C]0.025534[/C][C]0.1961[/C][C]0.422592[/C][/ROW]
[ROW][C]4[/C][C]-0.047277[/C][C]-0.3631[/C][C]0.358898[/C][/ROW]
[ROW][C]5[/C][C]-0.111162[/C][C]-0.8538[/C][C]0.198321[/C][/ROW]
[ROW][C]6[/C][C]-0.022504[/C][C]-0.1729[/C][C]0.431676[/C][/ROW]
[ROW][C]7[/C][C]0.197594[/C][C]1.5177[/C][C]0.067209[/C][/ROW]
[ROW][C]8[/C][C]-0.152412[/C][C]-1.1707[/C][C]0.123214[/C][/ROW]
[ROW][C]9[/C][C]0.120577[/C][C]0.9262[/C][C]0.179066[/C][/ROW]
[ROW][C]10[/C][C]0.078963[/C][C]0.6065[/C][C]0.273245[/C][/ROW]
[ROW][C]11[/C][C]0.03701[/C][C]0.2843[/C][C]0.388596[/C][/ROW]
[ROW][C]12[/C][C]-0.031491[/C][C]-0.2419[/C][C]0.404854[/C][/ROW]
[ROW][C]13[/C][C]0.067654[/C][C]0.5197[/C][C]0.302622[/C][/ROW]
[ROW][C]14[/C][C]-0.043659[/C][C]-0.3354[/C][C]0.369274[/C][/ROW]
[ROW][C]15[/C][C]0.024423[/C][C]0.1876[/C][C]0.425918[/C][/ROW]
[ROW][C]16[/C][C]-0.097865[/C][C]-0.7517[/C][C]0.227606[/C][/ROW]
[ROW][C]17[/C][C]-0.083944[/C][C]-0.6448[/C][C]0.260782[/C][/ROW]
[ROW][C]18[/C][C]0.062061[/C][C]0.4767[/C][C]0.317668[/C][/ROW]
[ROW][C]19[/C][C]-0.061939[/C][C]-0.4758[/C][C]0.318002[/C][/ROW]
[ROW][C]20[/C][C]0.047962[/C][C]0.3684[/C][C]0.356945[/C][/ROW]
[ROW][C]21[/C][C]-0.031281[/C][C]-0.2403[/C][C]0.405476[/C][/ROW]
[ROW][C]22[/C][C]0.024309[/C][C]0.1867[/C][C]0.426261[/C][/ROW]
[ROW][C]23[/C][C]0.137674[/C][C]1.0575[/C][C]0.147299[/C][/ROW]
[ROW][C]24[/C][C]0.001792[/C][C]0.0138[/C][C]0.494531[/C][/ROW]
[ROW][C]25[/C][C]0.051664[/C][C]0.3968[/C][C]0.346458[/C][/ROW]
[ROW][C]26[/C][C]-0.000399[/C][C]-0.0031[/C][C]0.498784[/C][/ROW]
[ROW][C]27[/C][C]0.036642[/C][C]0.2815[/C][C]0.389674[/C][/ROW]
[ROW][C]28[/C][C]-0.015125[/C][C]-0.1162[/C][C]0.453954[/C][/ROW]
[ROW][C]29[/C][C]-0.146277[/C][C]-1.1236[/C][C]0.132872[/C][/ROW]
[ROW][C]30[/C][C]0.002623[/C][C]0.0201[/C][C]0.491998[/C][/ROW]
[ROW][C]31[/C][C]0.005719[/C][C]0.0439[/C][C]0.482555[/C][/ROW]
[ROW][C]32[/C][C]-0.096477[/C][C]-0.7411[/C][C]0.2308[/C][/ROW]
[ROW][C]33[/C][C]0.017053[/C][C]0.131[/C][C]0.448116[/C][/ROW]
[ROW][C]34[/C][C]-0.115325[/C][C]-0.8858[/C][C]0.189653[/C][/ROW]
[ROW][C]35[/C][C]-0.133139[/C][C]-1.0227[/C][C]0.155322[/C][/ROW]
[ROW][C]36[/C][C]0.126331[/C][C]0.9704[/C][C]0.167912[/C][/ROW]
[/TABLE]
Source: https://freestatistics.org/blog/index.php?pk=63987&T=2

Globally Unique Identifier (entire table): ba.freestatistics.org/blog/index.php?pk=63987&T=2

As an alternative you can also use a QR Code:  

The GUIDs for individual cells are displayed in the table below:

Partial Autocorrelation Function
Time lag kPACF(k)T-STATP-value
1-0.018996-0.14590.442243
2-0.044355-0.34070.367272
30.0255340.19610.422592
4-0.047277-0.36310.358898
5-0.111162-0.85380.198321
6-0.022504-0.17290.431676
70.1975941.51770.067209
8-0.152412-1.17070.123214
90.1205770.92620.179066
100.0789630.60650.273245
110.037010.28430.388596
12-0.031491-0.24190.404854
130.0676540.51970.302622
14-0.043659-0.33540.369274
150.0244230.18760.425918
16-0.097865-0.75170.227606
17-0.083944-0.64480.260782
180.0620610.47670.317668
19-0.061939-0.47580.318002
200.0479620.36840.356945
21-0.031281-0.24030.405476
220.0243090.18670.426261
230.1376741.05750.147299
240.0017920.01380.494531
250.0516640.39680.346458
26-0.000399-0.00310.498784
270.0366420.28150.389674
28-0.015125-0.11620.453954
29-0.146277-1.12360.132872
300.0026230.02010.491998
310.0057190.04390.482555
32-0.096477-0.74110.2308
330.0170530.1310.448116
34-0.115325-0.88580.189653
35-0.133139-1.02270.155322
360.1263310.97040.167912


Parameters (Session):
par1 = 36 ; par2 = 1 ; par3 = 1 ; par4 = 0 ; par5 = 12 ; par6 = MA ; par7 = 0.95 ;
Parameters (R input):
par1 = 36 ; par2 = 1 ; par3 = 1 ; par4 = 0 ; par5 = 12 ; par6 = MA ; par7 = 0.95 ;
R code (references can be found in the software module):
if (par1 == 'Default') {
par1 = 10*log10(length(x))
} else {
par1 <- as.numeric(par1)
}
par2 <- as.numeric(par2)
par3 <- as.numeric(par3)
par4 <- as.numeric(par4)
par5 <- as.numeric(par5)
if (par6 == 'White Noise') par6 <- 'white' else par6 <- 'ma'
par7 <- as.numeric(par7)
if (par2 == 0) {
x <- log(x)
} else {
x <- (x ^ par2 - 1) / par2
}
if (par3 > 0) x <- diff(x,lag=1,difference=par3)
if (par4 > 0) x <- diff(x,lag=par5,difference=par4)
bitmap(file='pic1.png')
racf <- acf(x, par1, main='Autocorrelation', xlab='time lag', ylab='ACF', ci.type=par6, ci=par7, sub=paste('(lambda=',par2,', d=',par3,', D=',par4,', CI=', par7, ', CI type=',par6,')',sep=''))
dev.off()
bitmap(file='pic2.png')
rpacf <- pacf(x,par1,main='Partial Autocorrelation',xlab='lags',ylab='PACF')
dev.off()
(myacf <- c(racf$acf))
(mypacf <- c(rpacf$acf))
lengthx <- length(x)
sqrtn <- sqrt(lengthx)
load(file='createtable')
a<-table.start()
a<-table.row.start(a)
a<-table.element(a,'Autocorrelation Function',4,TRUE)
a<-table.row.end(a)
a<-table.row.start(a)
a<-table.element(a,'Time lag k',header=TRUE)
a<-table.element(a,hyperlink('basics.htm','ACF(k)','click here for more information about the Autocorrelation Function'),header=TRUE)
a<-table.element(a,'T-STAT',header=TRUE)
a<-table.element(a,'P-value',header=TRUE)
a<-table.row.end(a)
for (i in 2:(par1+1)) {
a<-table.row.start(a)
a<-table.element(a,i-1,header=TRUE)
a<-table.element(a,round(myacf[i],6))
mytstat <- myacf[i]*sqrtn
a<-table.element(a,round(mytstat,4))
a<-table.element(a,round(1-pt(abs(mytstat),lengthx),6))
a<-table.row.end(a)
}
a<-table.end(a)
table.save(a,file='mytable.tab')
a<-table.start()
a<-table.row.start(a)
a<-table.element(a,'Partial Autocorrelation Function',4,TRUE)
a<-table.row.end(a)
a<-table.row.start(a)
a<-table.element(a,'Time lag k',header=TRUE)
a<-table.element(a,hyperlink('basics.htm','PACF(k)','click here for more information about the Partial Autocorrelation Function'),header=TRUE)
a<-table.element(a,'T-STAT',header=TRUE)
a<-table.element(a,'P-value',header=TRUE)
a<-table.row.end(a)
for (i in 1:par1) {
a<-table.row.start(a)
a<-table.element(a,i,header=TRUE)
a<-table.element(a,round(mypacf[i],6))
mytstat <- mypacf[i]*sqrtn
a<-table.element(a,round(mytstat,4))
a<-table.element(a,round(1-pt(abs(mytstat),lengthx),6))
a<-table.row.end(a)
}
a<-table.end(a)
table.save(a,file='mytable1.tab')