Free Statistics

of Irreproducible Research!

Author's title

Author*The author of this computation has been verified*
R Software Modulerwasp_autocorrelation.wasp
Title produced by software(Partial) Autocorrelation Function
Date of computationFri, 04 Dec 2009 11:18:08 -0700
Cite this page as followsStatistical Computations at FreeStatistics.org, Office for Research Development and Education, URL https://freestatistics.org/blog/index.php?v=date/2009/Dec/04/t1259950725bos9gj5kvvu8ypj.htm/, Retrieved Sun, 28 Apr 2024 05:02:41 +0000
Statistical Computations at FreeStatistics.org, Office for Research Development and Education, URL https://freestatistics.org/blog/index.php?pk=64002, Retrieved Sun, 28 Apr 2024 05:02:41 +0000
QR Codes:

Original text written by user:
IsPrivate?No (this computation is public)
User-defined keywords
Estimated Impact104
Family? (F = Feedback message, R = changed R code, M = changed R Module, P = changed Parameters, D = changed Data)
-     [Univariate Data Series] [data set] [2008-12-01 19:54:57] [b98453cac15ba1066b407e146608df68]
- RMP   [(Partial) Autocorrelation Function] [] [2009-11-27 14:46:03] [b98453cac15ba1066b407e146608df68]
-    D      [(Partial) Autocorrelation Function] [] [2009-12-04 18:18:08] [f90b018c65398c2fee7b197f24b65ddd] [Current]
Feedback Forum

Post a new message
Dataseries X:
902.2
891.9
874
930.9
944.2
935.9
937.1
885.1
892.4
987.3
946.3
799.6
875.4
846.2
880.6
885.7
868.9
882.5
789.6
773.3
804.3
817.8
836.7
721.8
760.8
841.4
1045.6
949.2
850.1
957.4
851.8
913.9
888
973.8
927.6
833
879.5
797.3
834.5
735.1
835
892.8
697.2
821.1
732.7
797.6
866.3
826.3
778.6
779.2
951
692.3
841.4
857.3
760.7
841.2
810.3
1007.4
931.3
931.2


Summary of computational transaction
Raw Inputview raw input (R code)
Raw Outputview raw output of R engine
Computing time1 seconds
R Server'Gwilym Jenkins' @ 72.249.127.135

\begin{tabular}{lllllllll}
\hline
Summary of computational transaction \tabularnewline
Raw Input & view raw input (R code)  \tabularnewline
Raw Output & view raw output of R engine  \tabularnewline
Computing time & 1 seconds \tabularnewline
R Server & 'Gwilym Jenkins' @ 72.249.127.135 \tabularnewline
\hline
\end{tabular}
%Source: https://freestatistics.org/blog/index.php?pk=64002&T=0

[TABLE]
[ROW][C]Summary of computational transaction[/C][/ROW]
[ROW][C]Raw Input[/C][C]view raw input (R code) [/C][/ROW]
[ROW][C]Raw Output[/C][C]view raw output of R engine [/C][/ROW]
[ROW][C]Computing time[/C][C]1 seconds[/C][/ROW]
[ROW][C]R Server[/C][C]'Gwilym Jenkins' @ 72.249.127.135[/C][/ROW]
[/TABLE]
Source: https://freestatistics.org/blog/index.php?pk=64002&T=0

Globally Unique Identifier (entire table): ba.freestatistics.org/blog/index.php?pk=64002&T=0

As an alternative you can also use a QR Code:  

The GUIDs for individual cells are displayed in the table below:

Summary of computational transaction
Raw Inputview raw input (R code)
Raw Outputview raw output of R engine
Computing time1 seconds
R Server'Gwilym Jenkins' @ 72.249.127.135


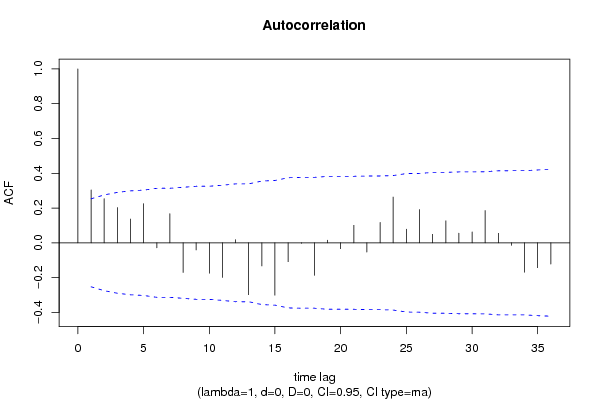
Autocorrelation Function
Time lag kACF(k)T-STATP-value
10.3043632.35760.010836
20.2538481.96630.026948
30.2029751.57220.060577
40.1364671.05710.147359
50.2250951.74360.043177
6-0.028459-0.22040.413138
70.1678091.29980.099313
8-0.170324-1.31930.096036
9-0.041322-0.32010.375009
10-0.174545-1.3520.090722
11-0.199356-1.54420.063898
120.0180870.14010.444524
13-0.298439-2.31170.012122
14-0.13318-1.03160.153199
15-0.301019-2.33170.011546
16-0.108763-0.84250.201435
17-0.002856-0.02210.491211
18-0.186713-1.44630.076653
190.0150030.11620.453936
20-0.03376-0.26150.397301
210.1006750.77980.21928
22-0.053236-0.41240.340772
230.1170060.90630.184195
240.2631352.03820.022971
250.0786760.60940.272274
260.1910461.47980.072075
270.0488780.37860.353158
280.1262210.97770.166073
290.0553170.42850.334915
300.0624350.48360.315208
310.1858431.43950.077598
320.0547090.42380.336624
33-0.014527-0.11250.455391
34-0.168808-1.30760.098002
35-0.143289-1.10990.135733
36-0.12216-0.94620.173909

\begin{tabular}{lllllllll}
\hline
Autocorrelation Function \tabularnewline
Time lag k & ACF(k) & T-STAT & P-value \tabularnewline
1 & 0.304363 & 2.3576 & 0.010836 \tabularnewline
2 & 0.253848 & 1.9663 & 0.026948 \tabularnewline
3 & 0.202975 & 1.5722 & 0.060577 \tabularnewline
4 & 0.136467 & 1.0571 & 0.147359 \tabularnewline
5 & 0.225095 & 1.7436 & 0.043177 \tabularnewline
6 & -0.028459 & -0.2204 & 0.413138 \tabularnewline
7 & 0.167809 & 1.2998 & 0.099313 \tabularnewline
8 & -0.170324 & -1.3193 & 0.096036 \tabularnewline
9 & -0.041322 & -0.3201 & 0.375009 \tabularnewline
10 & -0.174545 & -1.352 & 0.090722 \tabularnewline
11 & -0.199356 & -1.5442 & 0.063898 \tabularnewline
12 & 0.018087 & 0.1401 & 0.444524 \tabularnewline
13 & -0.298439 & -2.3117 & 0.012122 \tabularnewline
14 & -0.13318 & -1.0316 & 0.153199 \tabularnewline
15 & -0.301019 & -2.3317 & 0.011546 \tabularnewline
16 & -0.108763 & -0.8425 & 0.201435 \tabularnewline
17 & -0.002856 & -0.0221 & 0.491211 \tabularnewline
18 & -0.186713 & -1.4463 & 0.076653 \tabularnewline
19 & 0.015003 & 0.1162 & 0.453936 \tabularnewline
20 & -0.03376 & -0.2615 & 0.397301 \tabularnewline
21 & 0.100675 & 0.7798 & 0.21928 \tabularnewline
22 & -0.053236 & -0.4124 & 0.340772 \tabularnewline
23 & 0.117006 & 0.9063 & 0.184195 \tabularnewline
24 & 0.263135 & 2.0382 & 0.022971 \tabularnewline
25 & 0.078676 & 0.6094 & 0.272274 \tabularnewline
26 & 0.191046 & 1.4798 & 0.072075 \tabularnewline
27 & 0.048878 & 0.3786 & 0.353158 \tabularnewline
28 & 0.126221 & 0.9777 & 0.166073 \tabularnewline
29 & 0.055317 & 0.4285 & 0.334915 \tabularnewline
30 & 0.062435 & 0.4836 & 0.315208 \tabularnewline
31 & 0.185843 & 1.4395 & 0.077598 \tabularnewline
32 & 0.054709 & 0.4238 & 0.336624 \tabularnewline
33 & -0.014527 & -0.1125 & 0.455391 \tabularnewline
34 & -0.168808 & -1.3076 & 0.098002 \tabularnewline
35 & -0.143289 & -1.1099 & 0.135733 \tabularnewline
36 & -0.12216 & -0.9462 & 0.173909 \tabularnewline
\hline
\end{tabular}
%Source: https://freestatistics.org/blog/index.php?pk=64002&T=1

[TABLE]
[ROW][C]Autocorrelation Function[/C][/ROW]
[ROW][C]Time lag k[/C][C]ACF(k)[/C][C]T-STAT[/C][C]P-value[/C][/ROW]
[ROW][C]1[/C][C]0.304363[/C][C]2.3576[/C][C]0.010836[/C][/ROW]
[ROW][C]2[/C][C]0.253848[/C][C]1.9663[/C][C]0.026948[/C][/ROW]
[ROW][C]3[/C][C]0.202975[/C][C]1.5722[/C][C]0.060577[/C][/ROW]
[ROW][C]4[/C][C]0.136467[/C][C]1.0571[/C][C]0.147359[/C][/ROW]
[ROW][C]5[/C][C]0.225095[/C][C]1.7436[/C][C]0.043177[/C][/ROW]
[ROW][C]6[/C][C]-0.028459[/C][C]-0.2204[/C][C]0.413138[/C][/ROW]
[ROW][C]7[/C][C]0.167809[/C][C]1.2998[/C][C]0.099313[/C][/ROW]
[ROW][C]8[/C][C]-0.170324[/C][C]-1.3193[/C][C]0.096036[/C][/ROW]
[ROW][C]9[/C][C]-0.041322[/C][C]-0.3201[/C][C]0.375009[/C][/ROW]
[ROW][C]10[/C][C]-0.174545[/C][C]-1.352[/C][C]0.090722[/C][/ROW]
[ROW][C]11[/C][C]-0.199356[/C][C]-1.5442[/C][C]0.063898[/C][/ROW]
[ROW][C]12[/C][C]0.018087[/C][C]0.1401[/C][C]0.444524[/C][/ROW]
[ROW][C]13[/C][C]-0.298439[/C][C]-2.3117[/C][C]0.012122[/C][/ROW]
[ROW][C]14[/C][C]-0.13318[/C][C]-1.0316[/C][C]0.153199[/C][/ROW]
[ROW][C]15[/C][C]-0.301019[/C][C]-2.3317[/C][C]0.011546[/C][/ROW]
[ROW][C]16[/C][C]-0.108763[/C][C]-0.8425[/C][C]0.201435[/C][/ROW]
[ROW][C]17[/C][C]-0.002856[/C][C]-0.0221[/C][C]0.491211[/C][/ROW]
[ROW][C]18[/C][C]-0.186713[/C][C]-1.4463[/C][C]0.076653[/C][/ROW]
[ROW][C]19[/C][C]0.015003[/C][C]0.1162[/C][C]0.453936[/C][/ROW]
[ROW][C]20[/C][C]-0.03376[/C][C]-0.2615[/C][C]0.397301[/C][/ROW]
[ROW][C]21[/C][C]0.100675[/C][C]0.7798[/C][C]0.21928[/C][/ROW]
[ROW][C]22[/C][C]-0.053236[/C][C]-0.4124[/C][C]0.340772[/C][/ROW]
[ROW][C]23[/C][C]0.117006[/C][C]0.9063[/C][C]0.184195[/C][/ROW]
[ROW][C]24[/C][C]0.263135[/C][C]2.0382[/C][C]0.022971[/C][/ROW]
[ROW][C]25[/C][C]0.078676[/C][C]0.6094[/C][C]0.272274[/C][/ROW]
[ROW][C]26[/C][C]0.191046[/C][C]1.4798[/C][C]0.072075[/C][/ROW]
[ROW][C]27[/C][C]0.048878[/C][C]0.3786[/C][C]0.353158[/C][/ROW]
[ROW][C]28[/C][C]0.126221[/C][C]0.9777[/C][C]0.166073[/C][/ROW]
[ROW][C]29[/C][C]0.055317[/C][C]0.4285[/C][C]0.334915[/C][/ROW]
[ROW][C]30[/C][C]0.062435[/C][C]0.4836[/C][C]0.315208[/C][/ROW]
[ROW][C]31[/C][C]0.185843[/C][C]1.4395[/C][C]0.077598[/C][/ROW]
[ROW][C]32[/C][C]0.054709[/C][C]0.4238[/C][C]0.336624[/C][/ROW]
[ROW][C]33[/C][C]-0.014527[/C][C]-0.1125[/C][C]0.455391[/C][/ROW]
[ROW][C]34[/C][C]-0.168808[/C][C]-1.3076[/C][C]0.098002[/C][/ROW]
[ROW][C]35[/C][C]-0.143289[/C][C]-1.1099[/C][C]0.135733[/C][/ROW]
[ROW][C]36[/C][C]-0.12216[/C][C]-0.9462[/C][C]0.173909[/C][/ROW]
[/TABLE]
Source: https://freestatistics.org/blog/index.php?pk=64002&T=1

Globally Unique Identifier (entire table): ba.freestatistics.org/blog/index.php?pk=64002&T=1

As an alternative you can also use a QR Code:  

The GUIDs for individual cells are displayed in the table below:

Autocorrelation Function
Time lag kACF(k)T-STATP-value
10.3043632.35760.010836
20.2538481.96630.026948
30.2029751.57220.060577
40.1364671.05710.147359
50.2250951.74360.043177
6-0.028459-0.22040.413138
70.1678091.29980.099313
8-0.170324-1.31930.096036
9-0.041322-0.32010.375009
10-0.174545-1.3520.090722
11-0.199356-1.54420.063898
120.0180870.14010.444524
13-0.298439-2.31170.012122
14-0.13318-1.03160.153199
15-0.301019-2.33170.011546
16-0.108763-0.84250.201435
17-0.002856-0.02210.491211
18-0.186713-1.44630.076653
190.0150030.11620.453936
20-0.03376-0.26150.397301
210.1006750.77980.21928
22-0.053236-0.41240.340772
230.1170060.90630.184195
240.2631352.03820.022971
250.0786760.60940.272274
260.1910461.47980.072075
270.0488780.37860.353158
280.1262210.97770.166073
290.0553170.42850.334915
300.0624350.48360.315208
310.1858431.43950.077598
320.0547090.42380.336624
33-0.014527-0.11250.455391
34-0.168808-1.30760.098002
35-0.143289-1.10990.135733
36-0.12216-0.94620.173909


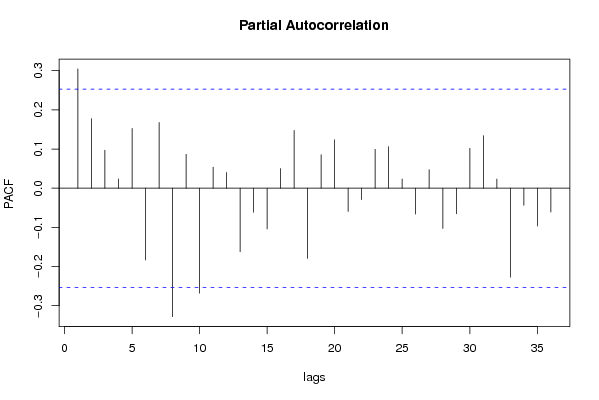
Partial Autocorrelation Function
Time lag kPACF(k)T-STATP-value
10.3043632.35760.010836
20.1776691.37620.086934
30.0971470.75250.227348
40.0237480.1840.427335
50.1525831.18190.120954
6-0.183117-1.41840.080621
70.1675711.2980.099627
8-0.327899-2.53990.006848
90.086620.6710.252413
10-0.267861-2.07480.021149
110.0536950.41590.339477
120.0402840.3120.378046
13-0.16195-1.25450.10727
14-0.061217-0.47420.318546
15-0.104179-0.8070.211435
160.0502110.38890.349352
170.1474151.14190.129022
18-0.179173-1.38790.085154
190.085380.66130.25546
200.1236470.95780.171012
21-0.05928-0.45920.323882
22-0.028939-0.22420.411698
230.099310.76930.222381
240.1060390.82140.207343
250.0233790.18110.428452
26-0.066024-0.51140.305466
270.0472220.36580.357907
28-0.102848-0.79670.214395
29-0.065547-0.50770.306753
300.1016910.78770.216988
310.1339521.03760.151813
320.023270.18020.428783
33-0.227032-1.75860.041874
34-0.04368-0.33830.368143
35-0.096421-0.74690.229029
36-0.06109-0.47320.318893

\begin{tabular}{lllllllll}
\hline
Partial Autocorrelation Function \tabularnewline
Time lag k & PACF(k) & T-STAT & P-value \tabularnewline
1 & 0.304363 & 2.3576 & 0.010836 \tabularnewline
2 & 0.177669 & 1.3762 & 0.086934 \tabularnewline
3 & 0.097147 & 0.7525 & 0.227348 \tabularnewline
4 & 0.023748 & 0.184 & 0.427335 \tabularnewline
5 & 0.152583 & 1.1819 & 0.120954 \tabularnewline
6 & -0.183117 & -1.4184 & 0.080621 \tabularnewline
7 & 0.167571 & 1.298 & 0.099627 \tabularnewline
8 & -0.327899 & -2.5399 & 0.006848 \tabularnewline
9 & 0.08662 & 0.671 & 0.252413 \tabularnewline
10 & -0.267861 & -2.0748 & 0.021149 \tabularnewline
11 & 0.053695 & 0.4159 & 0.339477 \tabularnewline
12 & 0.040284 & 0.312 & 0.378046 \tabularnewline
13 & -0.16195 & -1.2545 & 0.10727 \tabularnewline
14 & -0.061217 & -0.4742 & 0.318546 \tabularnewline
15 & -0.104179 & -0.807 & 0.211435 \tabularnewline
16 & 0.050211 & 0.3889 & 0.349352 \tabularnewline
17 & 0.147415 & 1.1419 & 0.129022 \tabularnewline
18 & -0.179173 & -1.3879 & 0.085154 \tabularnewline
19 & 0.08538 & 0.6613 & 0.25546 \tabularnewline
20 & 0.123647 & 0.9578 & 0.171012 \tabularnewline
21 & -0.05928 & -0.4592 & 0.323882 \tabularnewline
22 & -0.028939 & -0.2242 & 0.411698 \tabularnewline
23 & 0.09931 & 0.7693 & 0.222381 \tabularnewline
24 & 0.106039 & 0.8214 & 0.207343 \tabularnewline
25 & 0.023379 & 0.1811 & 0.428452 \tabularnewline
26 & -0.066024 & -0.5114 & 0.305466 \tabularnewline
27 & 0.047222 & 0.3658 & 0.357907 \tabularnewline
28 & -0.102848 & -0.7967 & 0.214395 \tabularnewline
29 & -0.065547 & -0.5077 & 0.306753 \tabularnewline
30 & 0.101691 & 0.7877 & 0.216988 \tabularnewline
31 & 0.133952 & 1.0376 & 0.151813 \tabularnewline
32 & 0.02327 & 0.1802 & 0.428783 \tabularnewline
33 & -0.227032 & -1.7586 & 0.041874 \tabularnewline
34 & -0.04368 & -0.3383 & 0.368143 \tabularnewline
35 & -0.096421 & -0.7469 & 0.229029 \tabularnewline
36 & -0.06109 & -0.4732 & 0.318893 \tabularnewline
\hline
\end{tabular}
%Source: https://freestatistics.org/blog/index.php?pk=64002&T=2

[TABLE]
[ROW][C]Partial Autocorrelation Function[/C][/ROW]
[ROW][C]Time lag k[/C][C]PACF(k)[/C][C]T-STAT[/C][C]P-value[/C][/ROW]
[ROW][C]1[/C][C]0.304363[/C][C]2.3576[/C][C]0.010836[/C][/ROW]
[ROW][C]2[/C][C]0.177669[/C][C]1.3762[/C][C]0.086934[/C][/ROW]
[ROW][C]3[/C][C]0.097147[/C][C]0.7525[/C][C]0.227348[/C][/ROW]
[ROW][C]4[/C][C]0.023748[/C][C]0.184[/C][C]0.427335[/C][/ROW]
[ROW][C]5[/C][C]0.152583[/C][C]1.1819[/C][C]0.120954[/C][/ROW]
[ROW][C]6[/C][C]-0.183117[/C][C]-1.4184[/C][C]0.080621[/C][/ROW]
[ROW][C]7[/C][C]0.167571[/C][C]1.298[/C][C]0.099627[/C][/ROW]
[ROW][C]8[/C][C]-0.327899[/C][C]-2.5399[/C][C]0.006848[/C][/ROW]
[ROW][C]9[/C][C]0.08662[/C][C]0.671[/C][C]0.252413[/C][/ROW]
[ROW][C]10[/C][C]-0.267861[/C][C]-2.0748[/C][C]0.021149[/C][/ROW]
[ROW][C]11[/C][C]0.053695[/C][C]0.4159[/C][C]0.339477[/C][/ROW]
[ROW][C]12[/C][C]0.040284[/C][C]0.312[/C][C]0.378046[/C][/ROW]
[ROW][C]13[/C][C]-0.16195[/C][C]-1.2545[/C][C]0.10727[/C][/ROW]
[ROW][C]14[/C][C]-0.061217[/C][C]-0.4742[/C][C]0.318546[/C][/ROW]
[ROW][C]15[/C][C]-0.104179[/C][C]-0.807[/C][C]0.211435[/C][/ROW]
[ROW][C]16[/C][C]0.050211[/C][C]0.3889[/C][C]0.349352[/C][/ROW]
[ROW][C]17[/C][C]0.147415[/C][C]1.1419[/C][C]0.129022[/C][/ROW]
[ROW][C]18[/C][C]-0.179173[/C][C]-1.3879[/C][C]0.085154[/C][/ROW]
[ROW][C]19[/C][C]0.08538[/C][C]0.6613[/C][C]0.25546[/C][/ROW]
[ROW][C]20[/C][C]0.123647[/C][C]0.9578[/C][C]0.171012[/C][/ROW]
[ROW][C]21[/C][C]-0.05928[/C][C]-0.4592[/C][C]0.323882[/C][/ROW]
[ROW][C]22[/C][C]-0.028939[/C][C]-0.2242[/C][C]0.411698[/C][/ROW]
[ROW][C]23[/C][C]0.09931[/C][C]0.7693[/C][C]0.222381[/C][/ROW]
[ROW][C]24[/C][C]0.106039[/C][C]0.8214[/C][C]0.207343[/C][/ROW]
[ROW][C]25[/C][C]0.023379[/C][C]0.1811[/C][C]0.428452[/C][/ROW]
[ROW][C]26[/C][C]-0.066024[/C][C]-0.5114[/C][C]0.305466[/C][/ROW]
[ROW][C]27[/C][C]0.047222[/C][C]0.3658[/C][C]0.357907[/C][/ROW]
[ROW][C]28[/C][C]-0.102848[/C][C]-0.7967[/C][C]0.214395[/C][/ROW]
[ROW][C]29[/C][C]-0.065547[/C][C]-0.5077[/C][C]0.306753[/C][/ROW]
[ROW][C]30[/C][C]0.101691[/C][C]0.7877[/C][C]0.216988[/C][/ROW]
[ROW][C]31[/C][C]0.133952[/C][C]1.0376[/C][C]0.151813[/C][/ROW]
[ROW][C]32[/C][C]0.02327[/C][C]0.1802[/C][C]0.428783[/C][/ROW]
[ROW][C]33[/C][C]-0.227032[/C][C]-1.7586[/C][C]0.041874[/C][/ROW]
[ROW][C]34[/C][C]-0.04368[/C][C]-0.3383[/C][C]0.368143[/C][/ROW]
[ROW][C]35[/C][C]-0.096421[/C][C]-0.7469[/C][C]0.229029[/C][/ROW]
[ROW][C]36[/C][C]-0.06109[/C][C]-0.4732[/C][C]0.318893[/C][/ROW]
[/TABLE]
Source: https://freestatistics.org/blog/index.php?pk=64002&T=2

Globally Unique Identifier (entire table): ba.freestatistics.org/blog/index.php?pk=64002&T=2

As an alternative you can also use a QR Code:  

The GUIDs for individual cells are displayed in the table below:

Partial Autocorrelation Function
Time lag kPACF(k)T-STATP-value
10.3043632.35760.010836
20.1776691.37620.086934
30.0971470.75250.227348
40.0237480.1840.427335
50.1525831.18190.120954
6-0.183117-1.41840.080621
70.1675711.2980.099627
8-0.327899-2.53990.006848
90.086620.6710.252413
10-0.267861-2.07480.021149
110.0536950.41590.339477
120.0402840.3120.378046
13-0.16195-1.25450.10727
14-0.061217-0.47420.318546
15-0.104179-0.8070.211435
160.0502110.38890.349352
170.1474151.14190.129022
18-0.179173-1.38790.085154
190.085380.66130.25546
200.1236470.95780.171012
21-0.05928-0.45920.323882
22-0.028939-0.22420.411698
230.099310.76930.222381
240.1060390.82140.207343
250.0233790.18110.428452
26-0.066024-0.51140.305466
270.0472220.36580.357907
28-0.102848-0.79670.214395
29-0.065547-0.50770.306753
300.1016910.78770.216988
310.1339521.03760.151813
320.023270.18020.428783
33-0.227032-1.75860.041874
34-0.04368-0.33830.368143
35-0.096421-0.74690.229029
36-0.06109-0.47320.318893


Parameters (Session):
par1 = 36 ; par2 = 1 ; par3 = 0 ; par4 = 0 ; par5 = 12 ; par6 = MA ; par7 = 0.95 ;
Parameters (R input):
par1 = 36 ; par2 = 1 ; par3 = 0 ; par4 = 0 ; par5 = 12 ; par6 = MA ; par7 = 0.95 ;
R code (references can be found in the software module):
if (par1 == 'Default') {
par1 = 10*log10(length(x))
} else {
par1 <- as.numeric(par1)
}
par2 <- as.numeric(par2)
par3 <- as.numeric(par3)
par4 <- as.numeric(par4)
par5 <- as.numeric(par5)
if (par6 == 'White Noise') par6 <- 'white' else par6 <- 'ma'
par7 <- as.numeric(par7)
if (par2 == 0) {
x <- log(x)
} else {
x <- (x ^ par2 - 1) / par2
}
if (par3 > 0) x <- diff(x,lag=1,difference=par3)
if (par4 > 0) x <- diff(x,lag=par5,difference=par4)
bitmap(file='pic1.png')
racf <- acf(x, par1, main='Autocorrelation', xlab='time lag', ylab='ACF', ci.type=par6, ci=par7, sub=paste('(lambda=',par2,', d=',par3,', D=',par4,', CI=', par7, ', CI type=',par6,')',sep=''))
dev.off()
bitmap(file='pic2.png')
rpacf <- pacf(x,par1,main='Partial Autocorrelation',xlab='lags',ylab='PACF')
dev.off()
(myacf <- c(racf$acf))
(mypacf <- c(rpacf$acf))
lengthx <- length(x)
sqrtn <- sqrt(lengthx)
load(file='createtable')
a<-table.start()
a<-table.row.start(a)
a<-table.element(a,'Autocorrelation Function',4,TRUE)
a<-table.row.end(a)
a<-table.row.start(a)
a<-table.element(a,'Time lag k',header=TRUE)
a<-table.element(a,hyperlink('basics.htm','ACF(k)','click here for more information about the Autocorrelation Function'),header=TRUE)
a<-table.element(a,'T-STAT',header=TRUE)
a<-table.element(a,'P-value',header=TRUE)
a<-table.row.end(a)
for (i in 2:(par1+1)) {
a<-table.row.start(a)
a<-table.element(a,i-1,header=TRUE)
a<-table.element(a,round(myacf[i],6))
mytstat <- myacf[i]*sqrtn
a<-table.element(a,round(mytstat,4))
a<-table.element(a,round(1-pt(abs(mytstat),lengthx),6))
a<-table.row.end(a)
}
a<-table.end(a)
table.save(a,file='mytable.tab')
a<-table.start()
a<-table.row.start(a)
a<-table.element(a,'Partial Autocorrelation Function',4,TRUE)
a<-table.row.end(a)
a<-table.row.start(a)
a<-table.element(a,'Time lag k',header=TRUE)
a<-table.element(a,hyperlink('basics.htm','PACF(k)','click here for more information about the Partial Autocorrelation Function'),header=TRUE)
a<-table.element(a,'T-STAT',header=TRUE)
a<-table.element(a,'P-value',header=TRUE)
a<-table.row.end(a)
for (i in 1:par1) {
a<-table.row.start(a)
a<-table.element(a,i,header=TRUE)
a<-table.element(a,round(mypacf[i],6))
mytstat <- mypacf[i]*sqrtn
a<-table.element(a,round(mytstat,4))
a<-table.element(a,round(1-pt(abs(mytstat),lengthx),6))
a<-table.row.end(a)
}
a<-table.end(a)
table.save(a,file='mytable1.tab')