Free Statistics

of Irreproducible Research!

Author's title

Author*The author of this computation has been verified*
R Software Modulerwasp_arimabackwardselection.wasp
Title produced by softwareARIMA Backward Selection
Date of computationFri, 04 Dec 2009 11:56:18 -0700
Cite this page as followsStatistical Computations at FreeStatistics.org, Office for Research Development and Education, URL https://freestatistics.org/blog/index.php?v=date/2009/Dec/04/t1259953062k9ud858h9k1oc4p.htm/, Retrieved Sat, 27 Apr 2024 18:21:19 +0000
Statistical Computations at FreeStatistics.org, Office for Research Development and Education, URL https://freestatistics.org/blog/index.php?pk=64034, Retrieved Sat, 27 Apr 2024 18:21:19 +0000
QR Codes:

Original text written by user:
IsPrivate?No (this computation is public)
User-defined keywords
Estimated Impact120
Family? (F = Feedback message, R = changed R code, M = changed R Module, P = changed Parameters, D = changed Data)
-     [Univariate Data Series] [data set] [2008-12-01 19:54:57] [b98453cac15ba1066b407e146608df68]
- RMP   [ARIMA Backward Selection] [] [2009-11-27 14:53:14] [b98453cac15ba1066b407e146608df68]
-   PD      [ARIMA Backward Selection] [Stap 4 Workshop 5] [2009-12-04 18:56:18] [865cd78857e928bd6e7d79509c6cdcc5] [Current]
- R PD        [ARIMA Backward Selection] [] [2009-12-05 19:14:29] [6998f38352c0f6bc3cf32a17448703fc]
Feedback Forum

Post a new message
Dataseries X:
2916
2434
2540
2349
2310
2189
2660
2194
2419
2742
2137
2710
2173
2363
2126
1905
2121
1983
1734
2074
2049
2406
2558
2251
2059
2397
1747
1707
2319
1631
1627
1791
2034
1997
2169
2028
2253
2218
1855
2187
1852
1570
1851
1954
1828
2251
2277
2085
2282
2266
1878
2267
2069
1746
2299
2360
2214
2825
2355
2333
3016
2155
2172
2150
2533
2058
2160
2260
2498
2695
2799
2947
2930
2318
2540
2570
2669
2450
2842
3440
2678
2981
2260
2844
2546
2456
2295
2379
2479
2057
2280
2351
2276
2548
2311
2201
2725
2408
2139
1898
2537
2069
2063
2524
2437
2189
2793
2074
2622
2278
2144
2427
2139
1828
2072
1800
1758
2246
1987
1868
2514


Summary of computational transaction
Raw Inputview raw input (R code)
Raw Outputview raw output of R engine
Computing time12 seconds
R Server'Gwilym Jenkins' @ 72.249.127.135

\begin{tabular}{lllllllll}
\hline
Summary of computational transaction \tabularnewline
Raw Input & view raw input (R code)  \tabularnewline
Raw Output & view raw output of R engine  \tabularnewline
Computing time & 12 seconds \tabularnewline
R Server & 'Gwilym Jenkins' @ 72.249.127.135 \tabularnewline
\hline
\end{tabular}
%Source: https://freestatistics.org/blog/index.php?pk=64034&T=0

[TABLE]
[ROW][C]Summary of computational transaction[/C][/ROW]
[ROW][C]Raw Input[/C][C]view raw input (R code) [/C][/ROW]
[ROW][C]Raw Output[/C][C]view raw output of R engine [/C][/ROW]
[ROW][C]Computing time[/C][C]12 seconds[/C][/ROW]
[ROW][C]R Server[/C][C]'Gwilym Jenkins' @ 72.249.127.135[/C][/ROW]
[/TABLE]
Source: https://freestatistics.org/blog/index.php?pk=64034&T=0

Globally Unique Identifier (entire table): ba.freestatistics.org/blog/index.php?pk=64034&T=0

As an alternative you can also use a QR Code:  

The GUIDs for individual cells are displayed in the table below:

Summary of computational transaction
Raw Inputview raw input (R code)
Raw Outputview raw output of R engine
Computing time12 seconds
R Server'Gwilym Jenkins' @ 72.249.127.135


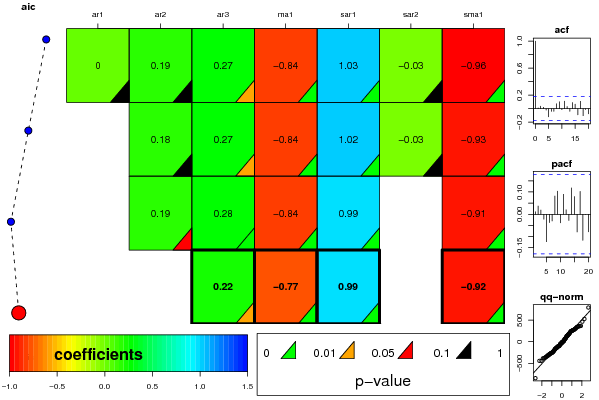
ARIMA Parameter Estimation and Backward Selection
Iterationar1ar2ar3ma1sar1sar2sma1
Estimates ( 1 )0.00170.18630.2743-0.84421.0303-0.0327-0.959
(p-val)(0.9928 )(0.2637 )(0.0318 )(0 )(0 )(0.7745 )(0 )
Estimates ( 2 )00.18290.272-0.84111.0191-0.0257-0.9307
(p-val)(NA )(0.1102 )(0.0108 )(0 )(0 )(0.8182 )(0 )
Estimates ( 3 )00.19070.2785-0.84280.98930-0.9095
(p-val)(NA )(0.0969 )(0.0092 )(0 )(0 )(NA )(0 )
Estimates ( 4 )000.2247-0.76920.99180-0.9231
(p-val)(NA )(NA )(0.0231 )(0 )(0 )(NA )(0 )
Estimates ( 5 )NANANANANANANA
(p-val)(NA )(NA )(NA )(NA )(NA )(NA )(NA )
Estimates ( 6 )NANANANANANANA
(p-val)(NA )(NA )(NA )(NA )(NA )(NA )(NA )
Estimates ( 7 )NANANANANANANA
(p-val)(NA )(NA )(NA )(NA )(NA )(NA )(NA )
Estimates ( 8 )NANANANANANANA
(p-val)(NA )(NA )(NA )(NA )(NA )(NA )(NA )
Estimates ( 9 )NANANANANANANA
(p-val)(NA )(NA )(NA )(NA )(NA )(NA )(NA )
Estimates ( 10 )NANANANANANANA
(p-val)(NA )(NA )(NA )(NA )(NA )(NA )(NA )
Estimates ( 11 )NANANANANANANA
(p-val)(NA )(NA )(NA )(NA )(NA )(NA )(NA )
Estimates ( 12 )NANANANANANANA
(p-val)(NA )(NA )(NA )(NA )(NA )(NA )(NA )
Estimates ( 13 )NANANANANANANA
(p-val)(NA )(NA )(NA )(NA )(NA )(NA )(NA )

\begin{tabular}{lllllllll}
\hline
ARIMA Parameter Estimation and Backward Selection \tabularnewline
Iteration & ar1 & ar2 & ar3 & ma1 & sar1 & sar2 & sma1 \tabularnewline
Estimates ( 1 ) & 0.0017 & 0.1863 & 0.2743 & -0.8442 & 1.0303 & -0.0327 & -0.959 \tabularnewline
(p-val) & (0.9928 ) & (0.2637 ) & (0.0318 ) & (0 ) & (0 ) & (0.7745 ) & (0 ) \tabularnewline
Estimates ( 2 ) & 0 & 0.1829 & 0.272 & -0.8411 & 1.0191 & -0.0257 & -0.9307 \tabularnewline
(p-val) & (NA ) & (0.1102 ) & (0.0108 ) & (0 ) & (0 ) & (0.8182 ) & (0 ) \tabularnewline
Estimates ( 3 ) & 0 & 0.1907 & 0.2785 & -0.8428 & 0.9893 & 0 & -0.9095 \tabularnewline
(p-val) & (NA ) & (0.0969 ) & (0.0092 ) & (0 ) & (0 ) & (NA ) & (0 ) \tabularnewline
Estimates ( 4 ) & 0 & 0 & 0.2247 & -0.7692 & 0.9918 & 0 & -0.9231 \tabularnewline
(p-val) & (NA ) & (NA ) & (0.0231 ) & (0 ) & (0 ) & (NA ) & (0 ) \tabularnewline
Estimates ( 5 ) & NA & NA & NA & NA & NA & NA & NA \tabularnewline
(p-val) & (NA ) & (NA ) & (NA ) & (NA ) & (NA ) & (NA ) & (NA ) \tabularnewline
Estimates ( 6 ) & NA & NA & NA & NA & NA & NA & NA \tabularnewline
(p-val) & (NA ) & (NA ) & (NA ) & (NA ) & (NA ) & (NA ) & (NA ) \tabularnewline
Estimates ( 7 ) & NA & NA & NA & NA & NA & NA & NA \tabularnewline
(p-val) & (NA ) & (NA ) & (NA ) & (NA ) & (NA ) & (NA ) & (NA ) \tabularnewline
Estimates ( 8 ) & NA & NA & NA & NA & NA & NA & NA \tabularnewline
(p-val) & (NA ) & (NA ) & (NA ) & (NA ) & (NA ) & (NA ) & (NA ) \tabularnewline
Estimates ( 9 ) & NA & NA & NA & NA & NA & NA & NA \tabularnewline
(p-val) & (NA ) & (NA ) & (NA ) & (NA ) & (NA ) & (NA ) & (NA ) \tabularnewline
Estimates ( 10 ) & NA & NA & NA & NA & NA & NA & NA \tabularnewline
(p-val) & (NA ) & (NA ) & (NA ) & (NA ) & (NA ) & (NA ) & (NA ) \tabularnewline
Estimates ( 11 ) & NA & NA & NA & NA & NA & NA & NA \tabularnewline
(p-val) & (NA ) & (NA ) & (NA ) & (NA ) & (NA ) & (NA ) & (NA ) \tabularnewline
Estimates ( 12 ) & NA & NA & NA & NA & NA & NA & NA \tabularnewline
(p-val) & (NA ) & (NA ) & (NA ) & (NA ) & (NA ) & (NA ) & (NA ) \tabularnewline
Estimates ( 13 ) & NA & NA & NA & NA & NA & NA & NA \tabularnewline
(p-val) & (NA ) & (NA ) & (NA ) & (NA ) & (NA ) & (NA ) & (NA ) \tabularnewline
\hline
\end{tabular}
%Source: https://freestatistics.org/blog/index.php?pk=64034&T=1

[TABLE]
[ROW][C]ARIMA Parameter Estimation and Backward Selection[/C][/ROW]
[ROW][C]Iteration[/C][C]ar1[/C][C]ar2[/C][C]ar3[/C][C]ma1[/C][C]sar1[/C][C]sar2[/C][C]sma1[/C][/ROW]
[ROW][C]Estimates ( 1 )[/C][C]0.0017[/C][C]0.1863[/C][C]0.2743[/C][C]-0.8442[/C][C]1.0303[/C][C]-0.0327[/C][C]-0.959[/C][/ROW]
[ROW][C](p-val)[/C][C](0.9928 )[/C][C](0.2637 )[/C][C](0.0318 )[/C][C](0 )[/C][C](0 )[/C][C](0.7745 )[/C][C](0 )[/C][/ROW]
[ROW][C]Estimates ( 2 )[/C][C]0[/C][C]0.1829[/C][C]0.272[/C][C]-0.8411[/C][C]1.0191[/C][C]-0.0257[/C][C]-0.9307[/C][/ROW]
[ROW][C](p-val)[/C][C](NA )[/C][C](0.1102 )[/C][C](0.0108 )[/C][C](0 )[/C][C](0 )[/C][C](0.8182 )[/C][C](0 )[/C][/ROW]
[ROW][C]Estimates ( 3 )[/C][C]0[/C][C]0.1907[/C][C]0.2785[/C][C]-0.8428[/C][C]0.9893[/C][C]0[/C][C]-0.9095[/C][/ROW]
[ROW][C](p-val)[/C][C](NA )[/C][C](0.0969 )[/C][C](0.0092 )[/C][C](0 )[/C][C](0 )[/C][C](NA )[/C][C](0 )[/C][/ROW]
[ROW][C]Estimates ( 4 )[/C][C]0[/C][C]0[/C][C]0.2247[/C][C]-0.7692[/C][C]0.9918[/C][C]0[/C][C]-0.9231[/C][/ROW]
[ROW][C](p-val)[/C][C](NA )[/C][C](NA )[/C][C](0.0231 )[/C][C](0 )[/C][C](0 )[/C][C](NA )[/C][C](0 )[/C][/ROW]
[ROW][C]Estimates ( 5 )[/C][C]NA[/C][C]NA[/C][C]NA[/C][C]NA[/C][C]NA[/C][C]NA[/C][C]NA[/C][/ROW]
[ROW][C](p-val)[/C][C](NA )[/C][C](NA )[/C][C](NA )[/C][C](NA )[/C][C](NA )[/C][C](NA )[/C][C](NA )[/C][/ROW]
[ROW][C]Estimates ( 6 )[/C][C]NA[/C][C]NA[/C][C]NA[/C][C]NA[/C][C]NA[/C][C]NA[/C][C]NA[/C][/ROW]
[ROW][C](p-val)[/C][C](NA )[/C][C](NA )[/C][C](NA )[/C][C](NA )[/C][C](NA )[/C][C](NA )[/C][C](NA )[/C][/ROW]
[ROW][C]Estimates ( 7 )[/C][C]NA[/C][C]NA[/C][C]NA[/C][C]NA[/C][C]NA[/C][C]NA[/C][C]NA[/C][/ROW]
[ROW][C](p-val)[/C][C](NA )[/C][C](NA )[/C][C](NA )[/C][C](NA )[/C][C](NA )[/C][C](NA )[/C][C](NA )[/C][/ROW]
[ROW][C]Estimates ( 8 )[/C][C]NA[/C][C]NA[/C][C]NA[/C][C]NA[/C][C]NA[/C][C]NA[/C][C]NA[/C][/ROW]
[ROW][C](p-val)[/C][C](NA )[/C][C](NA )[/C][C](NA )[/C][C](NA )[/C][C](NA )[/C][C](NA )[/C][C](NA )[/C][/ROW]
[ROW][C]Estimates ( 9 )[/C][C]NA[/C][C]NA[/C][C]NA[/C][C]NA[/C][C]NA[/C][C]NA[/C][C]NA[/C][/ROW]
[ROW][C](p-val)[/C][C](NA )[/C][C](NA )[/C][C](NA )[/C][C](NA )[/C][C](NA )[/C][C](NA )[/C][C](NA )[/C][/ROW]
[ROW][C]Estimates ( 10 )[/C][C]NA[/C][C]NA[/C][C]NA[/C][C]NA[/C][C]NA[/C][C]NA[/C][C]NA[/C][/ROW]
[ROW][C](p-val)[/C][C](NA )[/C][C](NA )[/C][C](NA )[/C][C](NA )[/C][C](NA )[/C][C](NA )[/C][C](NA )[/C][/ROW]
[ROW][C]Estimates ( 11 )[/C][C]NA[/C][C]NA[/C][C]NA[/C][C]NA[/C][C]NA[/C][C]NA[/C][C]NA[/C][/ROW]
[ROW][C](p-val)[/C][C](NA )[/C][C](NA )[/C][C](NA )[/C][C](NA )[/C][C](NA )[/C][C](NA )[/C][C](NA )[/C][/ROW]
[ROW][C]Estimates ( 12 )[/C][C]NA[/C][C]NA[/C][C]NA[/C][C]NA[/C][C]NA[/C][C]NA[/C][C]NA[/C][/ROW]
[ROW][C](p-val)[/C][C](NA )[/C][C](NA )[/C][C](NA )[/C][C](NA )[/C][C](NA )[/C][C](NA )[/C][C](NA )[/C][/ROW]
[ROW][C]Estimates ( 13 )[/C][C]NA[/C][C]NA[/C][C]NA[/C][C]NA[/C][C]NA[/C][C]NA[/C][C]NA[/C][/ROW]
[ROW][C](p-val)[/C][C](NA )[/C][C](NA )[/C][C](NA )[/C][C](NA )[/C][C](NA )[/C][C](NA )[/C][C](NA )[/C][/ROW]
[/TABLE]
Source: https://freestatistics.org/blog/index.php?pk=64034&T=1

Globally Unique Identifier (entire table): ba.freestatistics.org/blog/index.php?pk=64034&T=1

As an alternative you can also use a QR Code:  

The GUIDs for individual cells are displayed in the table below:

ARIMA Parameter Estimation and Backward Selection
Iterationar1ar2ar3ma1sar1sar2sma1
Estimates ( 1 )0.00170.18630.2743-0.84421.0303-0.0327-0.959
(p-val)(0.9928 )(0.2637 )(0.0318 )(0 )(0 )(0.7745 )(0 )
Estimates ( 2 )00.18290.272-0.84111.0191-0.0257-0.9307
(p-val)(NA )(0.1102 )(0.0108 )(0 )(0 )(0.8182 )(0 )
Estimates ( 3 )00.19070.2785-0.84280.98930-0.9095
(p-val)(NA )(0.0969 )(0.0092 )(0 )(0 )(NA )(0 )
Estimates ( 4 )000.2247-0.76920.99180-0.9231
(p-val)(NA )(NA )(0.0231 )(0 )(0 )(NA )(0 )
Estimates ( 5 )NANANANANANANA
(p-val)(NA )(NA )(NA )(NA )(NA )(NA )(NA )
Estimates ( 6 )NANANANANANANA
(p-val)(NA )(NA )(NA )(NA )(NA )(NA )(NA )
Estimates ( 7 )NANANANANANANA
(p-val)(NA )(NA )(NA )(NA )(NA )(NA )(NA )
Estimates ( 8 )NANANANANANANA
(p-val)(NA )(NA )(NA )(NA )(NA )(NA )(NA )
Estimates ( 9 )NANANANANANANA
(p-val)(NA )(NA )(NA )(NA )(NA )(NA )(NA )
Estimates ( 10 )NANANANANANANA
(p-val)(NA )(NA )(NA )(NA )(NA )(NA )(NA )
Estimates ( 11 )NANANANANANANA
(p-val)(NA )(NA )(NA )(NA )(NA )(NA )(NA )
Estimates ( 12 )NANANANANANANA
(p-val)(NA )(NA )(NA )(NA )(NA )(NA )(NA )
Estimates ( 13 )NANANANANANANA
(p-val)(NA )(NA )(NA )(NA )(NA )(NA )(NA )


Estimated ARIMA Residuals
Value
2.91599657959305
-314.690195721457
-131.220833480998
-268.917947767282
-159.439515365829
-231.151004658484
267.044392985118
-154.512510517727
25.7409615118727
246.456648918020
-233.366964772720
215.919524381952
-367.41236901486
37.9438847988311
-243.929159186576
-259.633633035267
-48.4019268314602
-36.1098358274196
-384.851656925177
71.1186444594724
77.316757359951
303.168744728339
463.441263845151
-53.5166412814842
-281.970349652152
133.925285065607
-331.439302336317
-270.133357749759
315.438587569891
-172.04195532488
-313.331172965828
-120.780810486138
264.092955270475
8.45238796222739
191.208943755986
-36.5949730756585
272.500151850139
142.121715217948
-95.2364187055334
239.330199870058
-205.818261795618
-292.193225053669
-39.0297341781420
204.981450806571
-36.8738678724042
168.790551503655
237.431216178064
0.330732643278589
130.450867745819
104.110825627541
-101.713479604696
244.914189203759
-6.18144604834078
-150.79518020268
271.221837097494
360.770146236821
68.557377217791
344.893423553446
-93.1279856039695
-114.522740079364
526.405318328254
-281.896179799514
-143.623489131433
-209.076408238698
360.12984965874
-5.55904019529623
-94.2862156910384
-55.9151566564977
247.889552869425
172.680979597089
288.153701471317
347.86915596282
160.683461279427
-442.232734467198
-7.71029050842068
110.758109197836
180.242065520795
64.1542854692916
299.570739416230
790.457942284597
-177.469342112726
-247.029987338829
-841.714592630719
61.7694227302761
-211.765780056017
-34.1974973684119
-150.345216526762
9.08166053317513
15.9971597287940
-171.106373991858
-106.624160406896
-92.8295712694205
-61.8724683735086
-22.0667484358905
-89.4226620989526
-257.431702267460
276.247743566083
132.452635774569
-69.0222207058684
-439.610216247912
252.867995809012
91.5552220569018
-125.764484952995
138.017175338469
174.476794517594
-347.516521392373
366.817447450191
-352.943460500463
151.668286655436
-106.259237044249
42.69202734195
211.18673129362
-195.566632309542
-257.056647129099
-119.480898017098
-379.485664553236
-313.658400931524
90.8768427301727
6.80020953256393
-146.467950667005
338.425831918994

\begin{tabular}{lllllllll}
\hline
Estimated ARIMA Residuals \tabularnewline
Value \tabularnewline
2.91599657959305 \tabularnewline
-314.690195721457 \tabularnewline
-131.220833480998 \tabularnewline
-268.917947767282 \tabularnewline
-159.439515365829 \tabularnewline
-231.151004658484 \tabularnewline
267.044392985118 \tabularnewline
-154.512510517727 \tabularnewline
25.7409615118727 \tabularnewline
246.456648918020 \tabularnewline
-233.366964772720 \tabularnewline
215.919524381952 \tabularnewline
-367.41236901486 \tabularnewline
37.9438847988311 \tabularnewline
-243.929159186576 \tabularnewline
-259.633633035267 \tabularnewline
-48.4019268314602 \tabularnewline
-36.1098358274196 \tabularnewline
-384.851656925177 \tabularnewline
71.1186444594724 \tabularnewline
77.316757359951 \tabularnewline
303.168744728339 \tabularnewline
463.441263845151 \tabularnewline
-53.5166412814842 \tabularnewline
-281.970349652152 \tabularnewline
133.925285065607 \tabularnewline
-331.439302336317 \tabularnewline
-270.133357749759 \tabularnewline
315.438587569891 \tabularnewline
-172.04195532488 \tabularnewline
-313.331172965828 \tabularnewline
-120.780810486138 \tabularnewline
264.092955270475 \tabularnewline
8.45238796222739 \tabularnewline
191.208943755986 \tabularnewline
-36.5949730756585 \tabularnewline
272.500151850139 \tabularnewline
142.121715217948 \tabularnewline
-95.2364187055334 \tabularnewline
239.330199870058 \tabularnewline
-205.818261795618 \tabularnewline
-292.193225053669 \tabularnewline
-39.0297341781420 \tabularnewline
204.981450806571 \tabularnewline
-36.8738678724042 \tabularnewline
168.790551503655 \tabularnewline
237.431216178064 \tabularnewline
0.330732643278589 \tabularnewline
130.450867745819 \tabularnewline
104.110825627541 \tabularnewline
-101.713479604696 \tabularnewline
244.914189203759 \tabularnewline
-6.18144604834078 \tabularnewline
-150.79518020268 \tabularnewline
271.221837097494 \tabularnewline
360.770146236821 \tabularnewline
68.557377217791 \tabularnewline
344.893423553446 \tabularnewline
-93.1279856039695 \tabularnewline
-114.522740079364 \tabularnewline
526.405318328254 \tabularnewline
-281.896179799514 \tabularnewline
-143.623489131433 \tabularnewline
-209.076408238698 \tabularnewline
360.12984965874 \tabularnewline
-5.55904019529623 \tabularnewline
-94.2862156910384 \tabularnewline
-55.9151566564977 \tabularnewline
247.889552869425 \tabularnewline
172.680979597089 \tabularnewline
288.153701471317 \tabularnewline
347.86915596282 \tabularnewline
160.683461279427 \tabularnewline
-442.232734467198 \tabularnewline
-7.71029050842068 \tabularnewline
110.758109197836 \tabularnewline
180.242065520795 \tabularnewline
64.1542854692916 \tabularnewline
299.570739416230 \tabularnewline
790.457942284597 \tabularnewline
-177.469342112726 \tabularnewline
-247.029987338829 \tabularnewline
-841.714592630719 \tabularnewline
61.7694227302761 \tabularnewline
-211.765780056017 \tabularnewline
-34.1974973684119 \tabularnewline
-150.345216526762 \tabularnewline
9.08166053317513 \tabularnewline
15.9971597287940 \tabularnewline
-171.106373991858 \tabularnewline
-106.624160406896 \tabularnewline
-92.8295712694205 \tabularnewline
-61.8724683735086 \tabularnewline
-22.0667484358905 \tabularnewline
-89.4226620989526 \tabularnewline
-257.431702267460 \tabularnewline
276.247743566083 \tabularnewline
132.452635774569 \tabularnewline
-69.0222207058684 \tabularnewline
-439.610216247912 \tabularnewline
252.867995809012 \tabularnewline
91.5552220569018 \tabularnewline
-125.764484952995 \tabularnewline
138.017175338469 \tabularnewline
174.476794517594 \tabularnewline
-347.516521392373 \tabularnewline
366.817447450191 \tabularnewline
-352.943460500463 \tabularnewline
151.668286655436 \tabularnewline
-106.259237044249 \tabularnewline
42.69202734195 \tabularnewline
211.18673129362 \tabularnewline
-195.566632309542 \tabularnewline
-257.056647129099 \tabularnewline
-119.480898017098 \tabularnewline
-379.485664553236 \tabularnewline
-313.658400931524 \tabularnewline
90.8768427301727 \tabularnewline
6.80020953256393 \tabularnewline
-146.467950667005 \tabularnewline
338.425831918994 \tabularnewline
\hline
\end{tabular}
%Source: https://freestatistics.org/blog/index.php?pk=64034&T=2

[TABLE]
[ROW][C]Estimated ARIMA Residuals[/C][/ROW]
[ROW][C]Value[/C][/ROW]
[ROW][C]2.91599657959305[/C][/ROW]
[ROW][C]-314.690195721457[/C][/ROW]
[ROW][C]-131.220833480998[/C][/ROW]
[ROW][C]-268.917947767282[/C][/ROW]
[ROW][C]-159.439515365829[/C][/ROW]
[ROW][C]-231.151004658484[/C][/ROW]
[ROW][C]267.044392985118[/C][/ROW]
[ROW][C]-154.512510517727[/C][/ROW]
[ROW][C]25.7409615118727[/C][/ROW]
[ROW][C]246.456648918020[/C][/ROW]
[ROW][C]-233.366964772720[/C][/ROW]
[ROW][C]215.919524381952[/C][/ROW]
[ROW][C]-367.41236901486[/C][/ROW]
[ROW][C]37.9438847988311[/C][/ROW]
[ROW][C]-243.929159186576[/C][/ROW]
[ROW][C]-259.633633035267[/C][/ROW]
[ROW][C]-48.4019268314602[/C][/ROW]
[ROW][C]-36.1098358274196[/C][/ROW]
[ROW][C]-384.851656925177[/C][/ROW]
[ROW][C]71.1186444594724[/C][/ROW]
[ROW][C]77.316757359951[/C][/ROW]
[ROW][C]303.168744728339[/C][/ROW]
[ROW][C]463.441263845151[/C][/ROW]
[ROW][C]-53.5166412814842[/C][/ROW]
[ROW][C]-281.970349652152[/C][/ROW]
[ROW][C]133.925285065607[/C][/ROW]
[ROW][C]-331.439302336317[/C][/ROW]
[ROW][C]-270.133357749759[/C][/ROW]
[ROW][C]315.438587569891[/C][/ROW]
[ROW][C]-172.04195532488[/C][/ROW]
[ROW][C]-313.331172965828[/C][/ROW]
[ROW][C]-120.780810486138[/C][/ROW]
[ROW][C]264.092955270475[/C][/ROW]
[ROW][C]8.45238796222739[/C][/ROW]
[ROW][C]191.208943755986[/C][/ROW]
[ROW][C]-36.5949730756585[/C][/ROW]
[ROW][C]272.500151850139[/C][/ROW]
[ROW][C]142.121715217948[/C][/ROW]
[ROW][C]-95.2364187055334[/C][/ROW]
[ROW][C]239.330199870058[/C][/ROW]
[ROW][C]-205.818261795618[/C][/ROW]
[ROW][C]-292.193225053669[/C][/ROW]
[ROW][C]-39.0297341781420[/C][/ROW]
[ROW][C]204.981450806571[/C][/ROW]
[ROW][C]-36.8738678724042[/C][/ROW]
[ROW][C]168.790551503655[/C][/ROW]
[ROW][C]237.431216178064[/C][/ROW]
[ROW][C]0.330732643278589[/C][/ROW]
[ROW][C]130.450867745819[/C][/ROW]
[ROW][C]104.110825627541[/C][/ROW]
[ROW][C]-101.713479604696[/C][/ROW]
[ROW][C]244.914189203759[/C][/ROW]
[ROW][C]-6.18144604834078[/C][/ROW]
[ROW][C]-150.79518020268[/C][/ROW]
[ROW][C]271.221837097494[/C][/ROW]
[ROW][C]360.770146236821[/C][/ROW]
[ROW][C]68.557377217791[/C][/ROW]
[ROW][C]344.893423553446[/C][/ROW]
[ROW][C]-93.1279856039695[/C][/ROW]
[ROW][C]-114.522740079364[/C][/ROW]
[ROW][C]526.405318328254[/C][/ROW]
[ROW][C]-281.896179799514[/C][/ROW]
[ROW][C]-143.623489131433[/C][/ROW]
[ROW][C]-209.076408238698[/C][/ROW]
[ROW][C]360.12984965874[/C][/ROW]
[ROW][C]-5.55904019529623[/C][/ROW]
[ROW][C]-94.2862156910384[/C][/ROW]
[ROW][C]-55.9151566564977[/C][/ROW]
[ROW][C]247.889552869425[/C][/ROW]
[ROW][C]172.680979597089[/C][/ROW]
[ROW][C]288.153701471317[/C][/ROW]
[ROW][C]347.86915596282[/C][/ROW]
[ROW][C]160.683461279427[/C][/ROW]
[ROW][C]-442.232734467198[/C][/ROW]
[ROW][C]-7.71029050842068[/C][/ROW]
[ROW][C]110.758109197836[/C][/ROW]
[ROW][C]180.242065520795[/C][/ROW]
[ROW][C]64.1542854692916[/C][/ROW]
[ROW][C]299.570739416230[/C][/ROW]
[ROW][C]790.457942284597[/C][/ROW]
[ROW][C]-177.469342112726[/C][/ROW]
[ROW][C]-247.029987338829[/C][/ROW]
[ROW][C]-841.714592630719[/C][/ROW]
[ROW][C]61.7694227302761[/C][/ROW]
[ROW][C]-211.765780056017[/C][/ROW]
[ROW][C]-34.1974973684119[/C][/ROW]
[ROW][C]-150.345216526762[/C][/ROW]
[ROW][C]9.08166053317513[/C][/ROW]
[ROW][C]15.9971597287940[/C][/ROW]
[ROW][C]-171.106373991858[/C][/ROW]
[ROW][C]-106.624160406896[/C][/ROW]
[ROW][C]-92.8295712694205[/C][/ROW]
[ROW][C]-61.8724683735086[/C][/ROW]
[ROW][C]-22.0667484358905[/C][/ROW]
[ROW][C]-89.4226620989526[/C][/ROW]
[ROW][C]-257.431702267460[/C][/ROW]
[ROW][C]276.247743566083[/C][/ROW]
[ROW][C]132.452635774569[/C][/ROW]
[ROW][C]-69.0222207058684[/C][/ROW]
[ROW][C]-439.610216247912[/C][/ROW]
[ROW][C]252.867995809012[/C][/ROW]
[ROW][C]91.5552220569018[/C][/ROW]
[ROW][C]-125.764484952995[/C][/ROW]
[ROW][C]138.017175338469[/C][/ROW]
[ROW][C]174.476794517594[/C][/ROW]
[ROW][C]-347.516521392373[/C][/ROW]
[ROW][C]366.817447450191[/C][/ROW]
[ROW][C]-352.943460500463[/C][/ROW]
[ROW][C]151.668286655436[/C][/ROW]
[ROW][C]-106.259237044249[/C][/ROW]
[ROW][C]42.69202734195[/C][/ROW]
[ROW][C]211.18673129362[/C][/ROW]
[ROW][C]-195.566632309542[/C][/ROW]
[ROW][C]-257.056647129099[/C][/ROW]
[ROW][C]-119.480898017098[/C][/ROW]
[ROW][C]-379.485664553236[/C][/ROW]
[ROW][C]-313.658400931524[/C][/ROW]
[ROW][C]90.8768427301727[/C][/ROW]
[ROW][C]6.80020953256393[/C][/ROW]
[ROW][C]-146.467950667005[/C][/ROW]
[ROW][C]338.425831918994[/C][/ROW]
[/TABLE]
Source: https://freestatistics.org/blog/index.php?pk=64034&T=2

Globally Unique Identifier (entire table): ba.freestatistics.org/blog/index.php?pk=64034&T=2

As an alternative you can also use a QR Code:  

The GUIDs for individual cells are displayed in the table below:

Estimated ARIMA Residuals
Value
2.91599657959305
-314.690195721457
-131.220833480998
-268.917947767282
-159.439515365829
-231.151004658484
267.044392985118
-154.512510517727
25.7409615118727
246.456648918020
-233.366964772720
215.919524381952
-367.41236901486
37.9438847988311
-243.929159186576
-259.633633035267
-48.4019268314602
-36.1098358274196
-384.851656925177
71.1186444594724
77.316757359951
303.168744728339
463.441263845151
-53.5166412814842
-281.970349652152
133.925285065607
-331.439302336317
-270.133357749759
315.438587569891
-172.04195532488
-313.331172965828
-120.780810486138
264.092955270475
8.45238796222739
191.208943755986
-36.5949730756585
272.500151850139
142.121715217948
-95.2364187055334
239.330199870058
-205.818261795618
-292.193225053669
-39.0297341781420
204.981450806571
-36.8738678724042
168.790551503655
237.431216178064
0.330732643278589
130.450867745819
104.110825627541
-101.713479604696
244.914189203759
-6.18144604834078
-150.79518020268
271.221837097494
360.770146236821
68.557377217791
344.893423553446
-93.1279856039695
-114.522740079364
526.405318328254
-281.896179799514
-143.623489131433
-209.076408238698
360.12984965874
-5.55904019529623
-94.2862156910384
-55.9151566564977
247.889552869425
172.680979597089
288.153701471317
347.86915596282
160.683461279427
-442.232734467198
-7.71029050842068
110.758109197836
180.242065520795
64.1542854692916
299.570739416230
790.457942284597
-177.469342112726
-247.029987338829
-841.714592630719
61.7694227302761
-211.765780056017
-34.1974973684119
-150.345216526762
9.08166053317513
15.9971597287940
-171.106373991858
-106.624160406896
-92.8295712694205
-61.8724683735086
-22.0667484358905
-89.4226620989526
-257.431702267460
276.247743566083
132.452635774569
-69.0222207058684
-439.610216247912
252.867995809012
91.5552220569018
-125.764484952995
138.017175338469
174.476794517594
-347.516521392373
366.817447450191
-352.943460500463
151.668286655436
-106.259237044249
42.69202734195
211.18673129362
-195.566632309542
-257.056647129099
-119.480898017098
-379.485664553236
-313.658400931524
90.8768427301727
6.80020953256393
-146.467950667005
338.425831918994


Parameters (Session):
par1 = 12 ;
Parameters (R input):
par1 = FALSE ; par2 = 1.0 ; par3 = 1 ; par4 = 0 ; par5 = 12 ; par6 = 3 ; par7 = 1 ; par8 = 2 ; par9 = 1 ;
R code (references can be found in the software module):
library(lattice)
if (par1 == 'TRUE') par1 <- TRUE
if (par1 == 'FALSE') par1 <- FALSE
par2 <- as.numeric(par2) #Box-Cox lambda transformation parameter
par3 <- as.numeric(par3) #degree of non-seasonal differencing
par4 <- as.numeric(par4) #degree of seasonal differencing
par5 <- as.numeric(par5) #seasonal period
par6 <- as.numeric(par6) #degree (p) of the non-seasonal AR(p) polynomial
par7 <- as.numeric(par7) #degree (q) of the non-seasonal MA(q) polynomial
par8 <- as.numeric(par8) #degree (P) of the seasonal AR(P) polynomial
par9 <- as.numeric(par9) #degree (Q) of the seasonal MA(Q) polynomial
armaGR <- function(arima.out, names, n){
try1 <- arima.out$coef
try2 <- sqrt(diag(arima.out$var.coef))
try.data.frame <- data.frame(matrix(NA,ncol=4,nrow=length(names)))
dimnames(try.data.frame) <- list(names,c('coef','std','tstat','pv'))
try.data.frame[,1] <- try1
for(i in 1:length(try2)) try.data.frame[which(rownames(try.data.frame)==names(try2)[i]),2] <- try2[i]
try.data.frame[,3] <- try.data.frame[,1] / try.data.frame[,2]
try.data.frame[,4] <- round((1-pt(abs(try.data.frame[,3]),df=n-(length(try2)+1)))*2,5)
vector <- rep(NA,length(names))
vector[is.na(try.data.frame[,4])] <- 0
maxi <- which.max(try.data.frame[,4])
continue <- max(try.data.frame[,4],na.rm=TRUE) > .05
vector[maxi] <- 0
list(summary=try.data.frame,next.vector=vector,continue=continue)
}
arimaSelect <- function(series, order=c(13,0,0), seasonal=list(order=c(2,0,0),period=12), include.mean=F){
nrc <- order[1]+order[3]+seasonal$order[1]+seasonal$order[3]
coeff <- matrix(NA, nrow=nrc*2, ncol=nrc)
pval <- matrix(NA, nrow=nrc*2, ncol=nrc)
mylist <- rep(list(NULL), nrc)
names <- NULL
if(order[1] > 0) names <- paste('ar',1:order[1],sep='')
if(order[3] > 0) names <- c( names , paste('ma',1:order[3],sep='') )
if(seasonal$order[1] > 0) names <- c(names, paste('sar',1:seasonal$order[1],sep=''))
if(seasonal$order[3] > 0) names <- c(names, paste('sma',1:seasonal$order[3],sep=''))
arima.out <- arima(series, order=order, seasonal=seasonal, include.mean=include.mean, method='ML')
mylist[[1]] <- arima.out
last.arma <- armaGR(arima.out, names, length(series))
mystop <- FALSE
i <- 1
coeff[i,] <- last.arma[[1]][,1]
pval [i,] <- last.arma[[1]][,4]
i <- 2
aic <- arima.out$aic
while(!mystop){
mylist[[i]] <- arima.out
arima.out <- arima(series, order=order, seasonal=seasonal, include.mean=include.mean, method='ML', fixed=last.arma$next.vector)
aic <- c(aic, arima.out$aic)
last.arma <- armaGR(arima.out, names, length(series))
mystop <- !last.arma$continue
coeff[i,] <- last.arma[[1]][,1]
pval [i,] <- last.arma[[1]][,4]
i <- i+1
}
list(coeff, pval, mylist, aic=aic)
}
arimaSelectplot <- function(arimaSelect.out,noms,choix){
noms <- names(arimaSelect.out[[3]][[1]]$coef)
coeff <- arimaSelect.out[[1]]
k <- min(which(is.na(coeff[,1])))-1
coeff <- coeff[1:k,]
pval <- arimaSelect.out[[2]][1:k,]
aic <- arimaSelect.out$aic[1:k]
coeff[coeff==0] <- NA
n <- ncol(coeff)
if(missing(choix)) choix <- k
layout(matrix(c(1,1,1,2,
3,3,3,2,
3,3,3,4,
5,6,7,7),nr=4),
widths=c(10,35,45,15),
heights=c(30,30,15,15))
couleurs <- rainbow(75)[1:50]#(50)
ticks <- pretty(coeff)
par(mar=c(1,1,3,1))
plot(aic,k:1-.5,type='o',pch=21,bg='blue',cex=2,axes=F,lty=2,xpd=NA)
points(aic[choix],k-choix+.5,pch=21,cex=4,bg=2,xpd=NA)
title('aic',line=2)
par(mar=c(3,0,0,0))
plot(0,axes=F,xlab='',ylab='',xlim=range(ticks),ylim=c(.1,1))
rect(xleft = min(ticks) + (0:49)/50*(max(ticks)-min(ticks)),
xright = min(ticks) + (1:50)/50*(max(ticks)-min(ticks)),
ytop = rep(1,50),
ybottom= rep(0,50),col=couleurs,border=NA)
axis(1,ticks)
rect(xleft=min(ticks),xright=max(ticks),ytop=1,ybottom=0)
text(mean(coeff,na.rm=T),.5,'coefficients',cex=2,font=2)
par(mar=c(1,1,3,1))
image(1:n,1:k,t(coeff[k:1,]),axes=F,col=couleurs,zlim=range(ticks))
for(i in 1:n) for(j in 1:k) if(!is.na(coeff[j,i])) {
if(pval[j,i]<.01) symb = 'green'
else if( (pval[j,i]<.05) & (pval[j,i]>=.01)) symb = 'orange'
else if( (pval[j,i]<.1) & (pval[j,i]>=.05)) symb = 'red'
else symb = 'black'
polygon(c(i+.5 ,i+.2 ,i+.5 ,i+.5),
c(k-j+0.5,k-j+0.5,k-j+0.8,k-j+0.5),
col=symb)
if(j==choix) {
rect(xleft=i-.5,
xright=i+.5,
ybottom=k-j+1.5,
ytop=k-j+.5,
lwd=4)
text(i,
k-j+1,
round(coeff[j,i],2),
cex=1.2,
font=2)
}
else{
rect(xleft=i-.5,xright=i+.5,ybottom=k-j+1.5,ytop=k-j+.5)
text(i,k-j+1,round(coeff[j,i],2),cex=1.2,font=1)
}
}
axis(3,1:n,noms)
par(mar=c(0.5,0,0,0.5))
plot(0,axes=F,xlab='',ylab='',type='n',xlim=c(0,8),ylim=c(-.2,.8))
cols <- c('green','orange','red','black')
niv <- c('0','0.01','0.05','0.1')
for(i in 0:3){
polygon(c(1+2*i ,1+2*i ,1+2*i-.5 ,1+2*i),
c(.4 ,.7 , .4 , .4),
col=cols[i+1])
text(2*i,0.5,niv[i+1],cex=1.5)
}
text(8,.5,1,cex=1.5)
text(4,0,'p-value',cex=2)
box()
residus <- arimaSelect.out[[3]][[choix]]$res
par(mar=c(1,2,4,1))
acf(residus,main='')
title('acf',line=.5)
par(mar=c(1,2,4,1))
pacf(residus,main='')
title('pacf',line=.5)
par(mar=c(2,2,4,1))
qqnorm(residus,main='')
title('qq-norm',line=.5)
qqline(residus)
residus
}
if (par2 == 0) x <- log(x)
if (par2 != 0) x <- x^par2
(selection <- arimaSelect(x, order=c(par6,par3,par7), seasonal=list(order=c(par8,par4,par9), period=par5)))
bitmap(file='test1.png')
resid <- arimaSelectplot(selection)
dev.off()
resid
bitmap(file='test2.png')
acf(resid,length(resid)/2, main='Residual Autocorrelation Function')
dev.off()
bitmap(file='test3.png')
pacf(resid,length(resid)/2, main='Residual Partial Autocorrelation Function')
dev.off()
bitmap(file='test4.png')
cpgram(resid, main='Residual Cumulative Periodogram')
dev.off()
bitmap(file='test5.png')
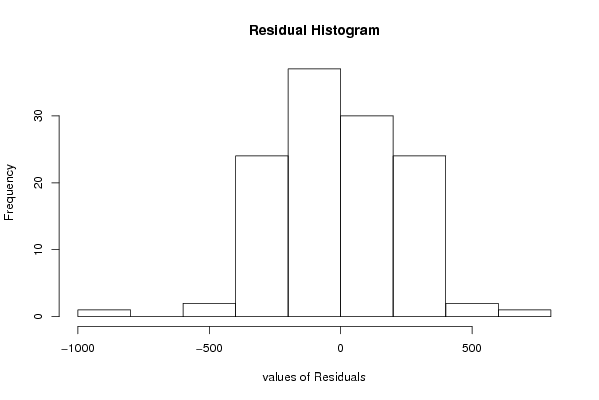
hist(resid, main='Residual Histogram', xlab='values of Residuals')
dev.off()
bitmap(file='test6.png')
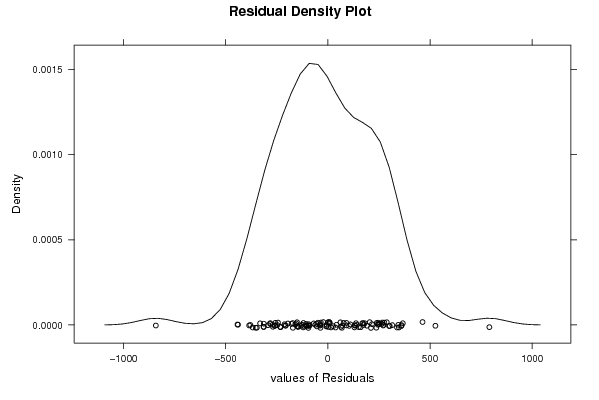
densityplot(~resid,col='black',main='Residual Density Plot', xlab='values of Residuals')
dev.off()
bitmap(file='test7.png')
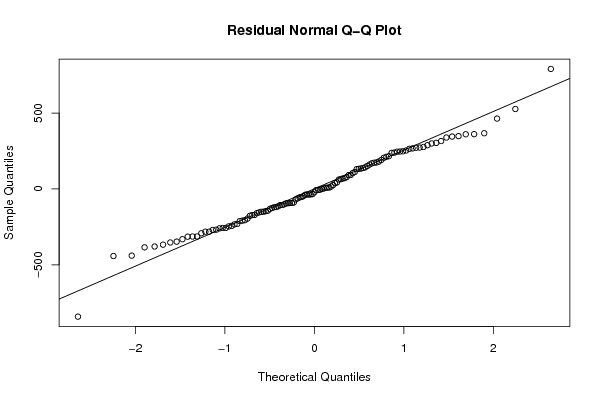
qqnorm(resid, main='Residual Normal Q-Q Plot')
qqline(resid)
dev.off()
ncols <- length(selection[[1]][1,])
nrows <- length(selection[[2]][,1])-1
load(file='createtable')
a<-table.start()
a<-table.row.start(a)
a<-table.element(a,'ARIMA Parameter Estimation and Backward Selection', ncols+1,TRUE)
a<-table.row.end(a)
a<-table.row.start(a)
a<-table.element(a,'Iteration', header=TRUE)
for (i in 1:ncols) {
a<-table.element(a,names(selection[[3]][[1]]$coef)[i],header=TRUE)
}
a<-table.row.end(a)
for (j in 1:nrows) {
a<-table.row.start(a)
mydum <- 'Estimates ('
mydum <- paste(mydum,j)
mydum <- paste(mydum,')')
a<-table.element(a,mydum, header=TRUE)
for (i in 1:ncols) {
a<-table.element(a,round(selection[[1]][j,i],4))
}
a<-table.row.end(a)
a<-table.row.start(a)
a<-table.element(a,'(p-val)', header=TRUE)
for (i in 1:ncols) {
mydum <- '('
mydum <- paste(mydum,round(selection[[2]][j,i],4),sep='')
mydum <- paste(mydum,')')
a<-table.element(a,mydum)
}
a<-table.row.end(a)
}
a<-table.end(a)
table.save(a,file='mytable.tab')
a<-table.start()
a<-table.row.start(a)
a<-table.element(a,'Estimated ARIMA Residuals', 1,TRUE)
a<-table.row.end(a)
a<-table.row.start(a)
a<-table.element(a,'Value', 1,TRUE)
a<-table.row.end(a)
for (i in (par4*par5+par3):length(resid)) {
a<-table.row.start(a)
a<-table.element(a,resid[i])
a<-table.row.end(a)
}
a<-table.end(a)
table.save(a,file='mytable1.tab')