Free Statistics
of Irreproducible Research!
Description of Statistical Computation | |||||||||||||||||||||
|---|---|---|---|---|---|---|---|---|---|---|---|---|---|---|---|---|---|---|---|---|---|
| Author's title | |||||||||||||||||||||
| Author | *The author of this computation has been verified* | ||||||||||||||||||||
| R Software Module | rwasp_meanplot.wasp | ||||||||||||||||||||
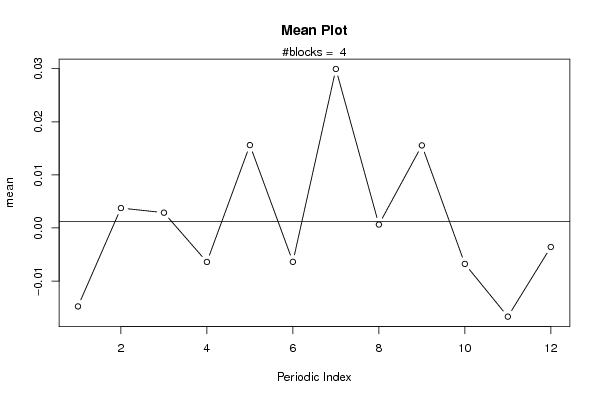
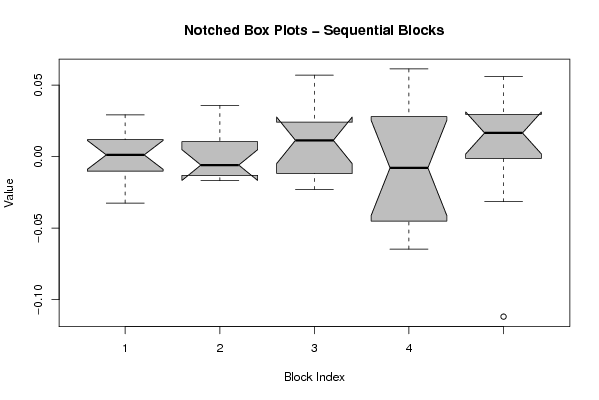
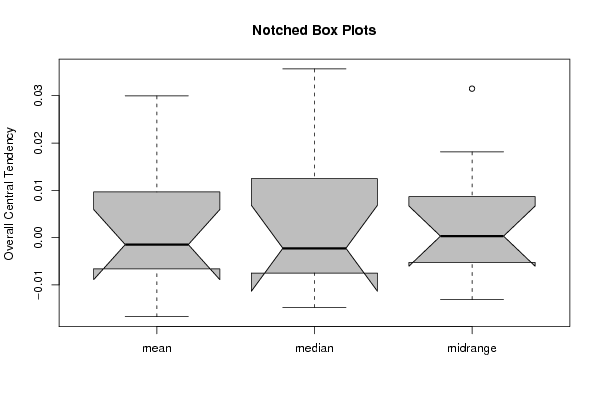
| Title produced by software | Mean Plot | ||||||||||||||||||||
| Date of computation | Fri, 04 Dec 2009 11:57:13 -0700 | ||||||||||||||||||||
| Cite this page as follows | Statistical Computations at FreeStatistics.org, Office for Research Development and Education, URL https://freestatistics.org/blog/index.php?v=date/2009/Dec/04/t12599530735fmult0agsr6ktp.htm/, Retrieved Sat, 27 Apr 2024 22:49:52 +0000 | ||||||||||||||||||||
| Statistical Computations at FreeStatistics.org, Office for Research Development and Education, URL https://freestatistics.org/blog/index.php?pk=64035, Retrieved Sat, 27 Apr 2024 22:49:52 +0000 | |||||||||||||||||||||
| QR Codes: | |||||||||||||||||||||
|
| |||||||||||||||||||||
| Original text written by user: | |||||||||||||||||||||
| IsPrivate? | No (this computation is public) | ||||||||||||||||||||
| User-defined keywords | |||||||||||||||||||||
| Estimated Impact | 99 | ||||||||||||||||||||
Tree of Dependent Computations | |||||||||||||||||||||
| Family? (F = Feedback message, R = changed R code, M = changed R Module, P = changed Parameters, D = changed Data) | |||||||||||||||||||||
| - [Univariate Data Series] [data set] [2008-12-01 19:54:57] [b98453cac15ba1066b407e146608df68] - RMP [ARIMA Backward Selection] [] [2009-11-27 14:53:14] [b98453cac15ba1066b407e146608df68] - R PD [ARIMA Backward Selection] [workshop 9] [2009-12-04 12:59:50] [eaf42bcf5162b5692bb3c7f9d4636222] - P [ARIMA Backward Selection] [Shw9: Backward AR...] [2009-12-04 13:04:23] [3c8b83428ce260cd44df892bb7619588] - RMPD [Harrell-Davis Quantiles] [Shw9: Harrel-Davi...] [2009-12-04 14:34:26] [3c8b83428ce260cd44df892bb7619588] - RMPD [Mean Plot] [Shw9: Mean Plot] [2009-12-04 14:46:46] [3c8b83428ce260cd44df892bb7619588] - [Mean Plot] [Shw9: Mean Plot] [2009-12-04 18:57:13] [a5c6be3c0aa55fdb2a703a08e16947ef] [Current] | |||||||||||||||||||||
| Feedback Forum | |||||||||||||||||||||
Post a new message | |||||||||||||||||||||
Dataset | |||||||||||||||||||||
| Dataseries X: | |||||||||||||||||||||
0.000746099568952258 0.0292111461738571 -0.00280267596084322 -0.00184368563002967 0.0107457257770334 -0.0175566443253344 0.0131165820445929 -0.0324353168918367 0.0224382020922924 -0.0196217959970839 0.00495492412026389 0.00168574453846993 -0.00506586405101019 -0.0116484658020629 -0.00266112877646428 0.0179412217929573 -0.0168120805195169 -0.0147697069296257 0.035665172596409 0.00293868331101443 -0.0145835439671676 0.0184871974956284 -0.00672423964360273 -0.00834464807562108 0.0169769773776811 0.0141585136611232 0.00520840412118636 -0.0225065086691335 0.0221256937859677 0.008638135296458 0.0259853418092942 -0.014962664383958 0.0336773377780083 -0.00849413990510539 -0.0229882773676451 0.0569000711376357 0.025309869239244 -0.029512999542613 -0.00750220761300227 0.00584857420117411 0.061296189365771 -0.0463306298649301 0.0380278085379684 -0.00825029078426785 0.0306190401585776 -0.04367173164859 -0.0556117529677963 -0.0645860417354424 -0.111874591444632 0.0165546744538422 0.0221480269493989 -0.0314854358112557 0.000731004014562505 0.038079969509555 0.0370058066179545 0.0559163673005735 0.00562659064346704 0.0194175429404750 -0.00318505854805297 | |||||||||||||||||||||
Tables (Output of Computation) | |||||||||||||||||||||
| |||||||||||||||||||||
Figures (Output of Computation) | |||||||||||||||||||||
Input Parameters & R Code | |||||||||||||||||||||
| Parameters (Session): | |||||||||||||||||||||
| par1 = 12 ; | |||||||||||||||||||||
| Parameters (R input): | |||||||||||||||||||||
| par1 = 12 ; | |||||||||||||||||||||
| R code (references can be found in the software module): | |||||||||||||||||||||
par1 <- as.numeric(par1) | |||||||||||||||||||||