Free Statistics

of Irreproducible Research!

Author's title

Author*The author of this computation has been verified*
R Software Modulerwasp_exponentialsmoothing.wasp
Title produced by softwareExponential Smoothing
Date of computationFri, 04 Dec 2009 12:21:56 -0700
Cite this page as followsStatistical Computations at FreeStatistics.org, Office for Research Development and Education, URL https://freestatistics.org/blog/index.php?v=date/2009/Dec/04/t1259954579weckudw6loc4awc.htm/, Retrieved Sun, 28 Apr 2024 18:12:42 +0000
Statistical Computations at FreeStatistics.org, Office for Research Development and Education, URL https://freestatistics.org/blog/index.php?pk=64059, Retrieved Sun, 28 Apr 2024 18:12:42 +0000
QR Codes:

Original text written by user:
IsPrivate?No (this computation is public)
User-defined keywords
Estimated Impact104
Family? (F = Feedback message, R = changed R code, M = changed R Module, P = changed Parameters, D = changed Data)
-     [Univariate Data Series] [data set] [2008-12-01 19:54:57] [b98453cac15ba1066b407e146608df68]
- RMP   [Exponential Smoothing] [] [2009-11-27 15:04:36] [b98453cac15ba1066b407e146608df68]
-    D      [Exponential Smoothing] [workshop 9,11] [2009-12-04 19:21:56] [2210215221105fab636491031ce54076] [Current]
Feedback Forum

Post a new message
Dataseries X:
611
594
595
591
589
584
573
567
569
621
629
628
612
595
597
593
590
580
574
573
573
620
626
620
588
566
557
561
549
532
526
511
499
555
565
542
527
510
514
517
508
493
490
469
478
528
534
518
506
502
516
528
533
536
537
524
536
587
597
581
564


Summary of computational transaction
Raw Inputview raw input (R code)
Raw Outputview raw output of R engine
Computing time2 seconds
R Server'Gwilym Jenkins' @ 72.249.127.135

\begin{tabular}{lllllllll}
\hline
Summary of computational transaction \tabularnewline
Raw Input & view raw input (R code)  \tabularnewline
Raw Output & view raw output of R engine  \tabularnewline
Computing time & 2 seconds \tabularnewline
R Server & 'Gwilym Jenkins' @ 72.249.127.135 \tabularnewline
\hline
\end{tabular}
%Source: https://freestatistics.org/blog/index.php?pk=64059&T=0

[TABLE]
[ROW][C]Summary of computational transaction[/C][/ROW]
[ROW][C]Raw Input[/C][C]view raw input (R code) [/C][/ROW]
[ROW][C]Raw Output[/C][C]view raw output of R engine [/C][/ROW]
[ROW][C]Computing time[/C][C]2 seconds[/C][/ROW]
[ROW][C]R Server[/C][C]'Gwilym Jenkins' @ 72.249.127.135[/C][/ROW]
[/TABLE]
Source: https://freestatistics.org/blog/index.php?pk=64059&T=0

Globally Unique Identifier (entire table): ba.freestatistics.org/blog/index.php?pk=64059&T=0

As an alternative you can also use a QR Code:  

The GUIDs for individual cells are displayed in the table below:

Summary of computational transaction
Raw Inputview raw input (R code)
Raw Outputview raw output of R engine
Computing time2 seconds
R Server'Gwilym Jenkins' @ 72.249.127.135


Estimated Parameters of Exponential Smoothing
ParameterValue
alpha0.643302986555876
beta0.415663566229055
gamma1

\begin{tabular}{lllllllll}
\hline
Estimated Parameters of Exponential Smoothing \tabularnewline
Parameter & Value \tabularnewline
alpha & 0.643302986555876 \tabularnewline
beta & 0.415663566229055 \tabularnewline
gamma & 1 \tabularnewline
\hline
\end{tabular}
%Source: https://freestatistics.org/blog/index.php?pk=64059&T=1

[TABLE]
[ROW][C]Estimated Parameters of Exponential Smoothing[/C][/ROW]
[ROW][C]Parameter[/C][C]Value[/C][/ROW]
[ROW][C]alpha[/C][C]0.643302986555876[/C][/ROW]
[ROW][C]beta[/C][C]0.415663566229055[/C][/ROW]
[ROW][C]gamma[/C][C]1[/C][/ROW]
[/TABLE]
Source: https://freestatistics.org/blog/index.php?pk=64059&T=1

Globally Unique Identifier (entire table): ba.freestatistics.org/blog/index.php?pk=64059&T=1

As an alternative you can also use a QR Code:  

The GUIDs for individual cells are displayed in the table below:

Estimated Parameters of Exponential Smoothing
ParameterValue
alpha0.643302986555876
beta0.415663566229055
gamma1


Interpolation Forecasts of Exponential Smoothing
tObservedFittedResiduals
13612612.089400000477-0.0894000004768714
14595594.7921354956240.207864504375607
15597596.6168831418110.383116858188828
16593592.9490746122070.0509253877928586
17590590.368163116416-0.368163116416213
18580580.695969271327-0.69596927132693
19574573.6218102253930.378189774607108
20573567.8130767350975.18692326490293
21573574.472420199937-1.47242019993723
22620626.892432647018-6.89243264701793
23626629.621712472036-3.62171247203639
24620624.7362909614-4.7362909614003
25588603.064475333712-15.0644753337123
26566569.995336591534-3.99533659153417
27557561.189151071784-4.18915107178373
28561545.66415762104215.3358423789576
29549547.9964424386671.00355756133285
30532535.251026579782-3.25102657978164
31526522.2707697641533.72923023584701
32511516.48295696508-5.48295696508012
33499506.884743413432-7.88474341343226
34555537.42717629235717.5728237076427
35565552.95400031534212.0459996846583
36542558.997240190181-16.9972401901808
37527525.8418595704411.15814042955935
38510510.642935046106-0.642935046106231
39514506.8355593100527.16444068994781
40517511.3666716432085.63332835679199
41508506.4381159909681.56188400903238
42493496.851936102395-3.8519361023948
43490489.5366476689230.463352331077033
44469481.284450703199-12.2844507031990
45478467.13143339197110.8685666080286
46528522.248821587375.75117841262943
47534530.8494220209423.15057797905831
48518521.958596800189-3.9585968001893
49506508.079702473317-2.07970247331701
50502493.6450755088188.35492449118198
51516503.77563142725712.2243685727433
52528517.84027565699610.1597243430039
53533522.16355860619610.8364413938036
54536526.278509293349.72149070666035
55537542.865766370818-5.8657663708176
56524536.545143822516-12.5451438225163
57536543.1578871719-7.15788717189992
58587598.710556596277-11.7105565962773
59597598.780930454105-1.78093045410492
60581584.265408047078-3.2654080470777
61564572.149744658917-8.14974465891737

\begin{tabular}{lllllllll}
\hline
Interpolation Forecasts of Exponential Smoothing \tabularnewline
t & Observed & Fitted & Residuals \tabularnewline
13 & 612 & 612.089400000477 & -0.0894000004768714 \tabularnewline
14 & 595 & 594.792135495624 & 0.207864504375607 \tabularnewline
15 & 597 & 596.616883141811 & 0.383116858188828 \tabularnewline
16 & 593 & 592.949074612207 & 0.0509253877928586 \tabularnewline
17 & 590 & 590.368163116416 & -0.368163116416213 \tabularnewline
18 & 580 & 580.695969271327 & -0.69596927132693 \tabularnewline
19 & 574 & 573.621810225393 & 0.378189774607108 \tabularnewline
20 & 573 & 567.813076735097 & 5.18692326490293 \tabularnewline
21 & 573 & 574.472420199937 & -1.47242019993723 \tabularnewline
22 & 620 & 626.892432647018 & -6.89243264701793 \tabularnewline
23 & 626 & 629.621712472036 & -3.62171247203639 \tabularnewline
24 & 620 & 624.7362909614 & -4.7362909614003 \tabularnewline
25 & 588 & 603.064475333712 & -15.0644753337123 \tabularnewline
26 & 566 & 569.995336591534 & -3.99533659153417 \tabularnewline
27 & 557 & 561.189151071784 & -4.18915107178373 \tabularnewline
28 & 561 & 545.664157621042 & 15.3358423789576 \tabularnewline
29 & 549 & 547.996442438667 & 1.00355756133285 \tabularnewline
30 & 532 & 535.251026579782 & -3.25102657978164 \tabularnewline
31 & 526 & 522.270769764153 & 3.72923023584701 \tabularnewline
32 & 511 & 516.48295696508 & -5.48295696508012 \tabularnewline
33 & 499 & 506.884743413432 & -7.88474341343226 \tabularnewline
34 & 555 & 537.427176292357 & 17.5728237076427 \tabularnewline
35 & 565 & 552.954000315342 & 12.0459996846583 \tabularnewline
36 & 542 & 558.997240190181 & -16.9972401901808 \tabularnewline
37 & 527 & 525.841859570441 & 1.15814042955935 \tabularnewline
38 & 510 & 510.642935046106 & -0.642935046106231 \tabularnewline
39 & 514 & 506.835559310052 & 7.16444068994781 \tabularnewline
40 & 517 & 511.366671643208 & 5.63332835679199 \tabularnewline
41 & 508 & 506.438115990968 & 1.56188400903238 \tabularnewline
42 & 493 & 496.851936102395 & -3.8519361023948 \tabularnewline
43 & 490 & 489.536647668923 & 0.463352331077033 \tabularnewline
44 & 469 & 481.284450703199 & -12.2844507031990 \tabularnewline
45 & 478 & 467.131433391971 & 10.8685666080286 \tabularnewline
46 & 528 & 522.24882158737 & 5.75117841262943 \tabularnewline
47 & 534 & 530.849422020942 & 3.15057797905831 \tabularnewline
48 & 518 & 521.958596800189 & -3.9585968001893 \tabularnewline
49 & 506 & 508.079702473317 & -2.07970247331701 \tabularnewline
50 & 502 & 493.645075508818 & 8.35492449118198 \tabularnewline
51 & 516 & 503.775631427257 & 12.2243685727433 \tabularnewline
52 & 528 & 517.840275656996 & 10.1597243430039 \tabularnewline
53 & 533 & 522.163558606196 & 10.8364413938036 \tabularnewline
54 & 536 & 526.27850929334 & 9.72149070666035 \tabularnewline
55 & 537 & 542.865766370818 & -5.8657663708176 \tabularnewline
56 & 524 & 536.545143822516 & -12.5451438225163 \tabularnewline
57 & 536 & 543.1578871719 & -7.15788717189992 \tabularnewline
58 & 587 & 598.710556596277 & -11.7105565962773 \tabularnewline
59 & 597 & 598.780930454105 & -1.78093045410492 \tabularnewline
60 & 581 & 584.265408047078 & -3.2654080470777 \tabularnewline
61 & 564 & 572.149744658917 & -8.14974465891737 \tabularnewline
\hline
\end{tabular}
%Source: https://freestatistics.org/blog/index.php?pk=64059&T=2

[TABLE]
[ROW][C]Interpolation Forecasts of Exponential Smoothing[/C][/ROW]
[ROW][C]t[/C][C]Observed[/C][C]Fitted[/C][C]Residuals[/C][/ROW]
[ROW][C]13[/C][C]612[/C][C]612.089400000477[/C][C]-0.0894000004768714[/C][/ROW]
[ROW][C]14[/C][C]595[/C][C]594.792135495624[/C][C]0.207864504375607[/C][/ROW]
[ROW][C]15[/C][C]597[/C][C]596.616883141811[/C][C]0.383116858188828[/C][/ROW]
[ROW][C]16[/C][C]593[/C][C]592.949074612207[/C][C]0.0509253877928586[/C][/ROW]
[ROW][C]17[/C][C]590[/C][C]590.368163116416[/C][C]-0.368163116416213[/C][/ROW]
[ROW][C]18[/C][C]580[/C][C]580.695969271327[/C][C]-0.69596927132693[/C][/ROW]
[ROW][C]19[/C][C]574[/C][C]573.621810225393[/C][C]0.378189774607108[/C][/ROW]
[ROW][C]20[/C][C]573[/C][C]567.813076735097[/C][C]5.18692326490293[/C][/ROW]
[ROW][C]21[/C][C]573[/C][C]574.472420199937[/C][C]-1.47242019993723[/C][/ROW]
[ROW][C]22[/C][C]620[/C][C]626.892432647018[/C][C]-6.89243264701793[/C][/ROW]
[ROW][C]23[/C][C]626[/C][C]629.621712472036[/C][C]-3.62171247203639[/C][/ROW]
[ROW][C]24[/C][C]620[/C][C]624.7362909614[/C][C]-4.7362909614003[/C][/ROW]
[ROW][C]25[/C][C]588[/C][C]603.064475333712[/C][C]-15.0644753337123[/C][/ROW]
[ROW][C]26[/C][C]566[/C][C]569.995336591534[/C][C]-3.99533659153417[/C][/ROW]
[ROW][C]27[/C][C]557[/C][C]561.189151071784[/C][C]-4.18915107178373[/C][/ROW]
[ROW][C]28[/C][C]561[/C][C]545.664157621042[/C][C]15.3358423789576[/C][/ROW]
[ROW][C]29[/C][C]549[/C][C]547.996442438667[/C][C]1.00355756133285[/C][/ROW]
[ROW][C]30[/C][C]532[/C][C]535.251026579782[/C][C]-3.25102657978164[/C][/ROW]
[ROW][C]31[/C][C]526[/C][C]522.270769764153[/C][C]3.72923023584701[/C][/ROW]
[ROW][C]32[/C][C]511[/C][C]516.48295696508[/C][C]-5.48295696508012[/C][/ROW]
[ROW][C]33[/C][C]499[/C][C]506.884743413432[/C][C]-7.88474341343226[/C][/ROW]
[ROW][C]34[/C][C]555[/C][C]537.427176292357[/C][C]17.5728237076427[/C][/ROW]
[ROW][C]35[/C][C]565[/C][C]552.954000315342[/C][C]12.0459996846583[/C][/ROW]
[ROW][C]36[/C][C]542[/C][C]558.997240190181[/C][C]-16.9972401901808[/C][/ROW]
[ROW][C]37[/C][C]527[/C][C]525.841859570441[/C][C]1.15814042955935[/C][/ROW]
[ROW][C]38[/C][C]510[/C][C]510.642935046106[/C][C]-0.642935046106231[/C][/ROW]
[ROW][C]39[/C][C]514[/C][C]506.835559310052[/C][C]7.16444068994781[/C][/ROW]
[ROW][C]40[/C][C]517[/C][C]511.366671643208[/C][C]5.63332835679199[/C][/ROW]
[ROW][C]41[/C][C]508[/C][C]506.438115990968[/C][C]1.56188400903238[/C][/ROW]
[ROW][C]42[/C][C]493[/C][C]496.851936102395[/C][C]-3.8519361023948[/C][/ROW]
[ROW][C]43[/C][C]490[/C][C]489.536647668923[/C][C]0.463352331077033[/C][/ROW]
[ROW][C]44[/C][C]469[/C][C]481.284450703199[/C][C]-12.2844507031990[/C][/ROW]
[ROW][C]45[/C][C]478[/C][C]467.131433391971[/C][C]10.8685666080286[/C][/ROW]
[ROW][C]46[/C][C]528[/C][C]522.24882158737[/C][C]5.75117841262943[/C][/ROW]
[ROW][C]47[/C][C]534[/C][C]530.849422020942[/C][C]3.15057797905831[/C][/ROW]
[ROW][C]48[/C][C]518[/C][C]521.958596800189[/C][C]-3.9585968001893[/C][/ROW]
[ROW][C]49[/C][C]506[/C][C]508.079702473317[/C][C]-2.07970247331701[/C][/ROW]
[ROW][C]50[/C][C]502[/C][C]493.645075508818[/C][C]8.35492449118198[/C][/ROW]
[ROW][C]51[/C][C]516[/C][C]503.775631427257[/C][C]12.2243685727433[/C][/ROW]
[ROW][C]52[/C][C]528[/C][C]517.840275656996[/C][C]10.1597243430039[/C][/ROW]
[ROW][C]53[/C][C]533[/C][C]522.163558606196[/C][C]10.8364413938036[/C][/ROW]
[ROW][C]54[/C][C]536[/C][C]526.27850929334[/C][C]9.72149070666035[/C][/ROW]
[ROW][C]55[/C][C]537[/C][C]542.865766370818[/C][C]-5.8657663708176[/C][/ROW]
[ROW][C]56[/C][C]524[/C][C]536.545143822516[/C][C]-12.5451438225163[/C][/ROW]
[ROW][C]57[/C][C]536[/C][C]543.1578871719[/C][C]-7.15788717189992[/C][/ROW]
[ROW][C]58[/C][C]587[/C][C]598.710556596277[/C][C]-11.7105565962773[/C][/ROW]
[ROW][C]59[/C][C]597[/C][C]598.780930454105[/C][C]-1.78093045410492[/C][/ROW]
[ROW][C]60[/C][C]581[/C][C]584.265408047078[/C][C]-3.2654080470777[/C][/ROW]
[ROW][C]61[/C][C]564[/C][C]572.149744658917[/C][C]-8.14974465891737[/C][/ROW]
[/TABLE]
Source: https://freestatistics.org/blog/index.php?pk=64059&T=2

Globally Unique Identifier (entire table): ba.freestatistics.org/blog/index.php?pk=64059&T=2

As an alternative you can also use a QR Code:  

The GUIDs for individual cells are displayed in the table below:

Interpolation Forecasts of Exponential Smoothing
tObservedFittedResiduals
13612612.089400000477-0.0894000004768714
14595594.7921354956240.207864504375607
15597596.6168831418110.383116858188828
16593592.9490746122070.0509253877928586
17590590.368163116416-0.368163116416213
18580580.695969271327-0.69596927132693
19574573.6218102253930.378189774607108
20573567.8130767350975.18692326490293
21573574.472420199937-1.47242019993723
22620626.892432647018-6.89243264701793
23626629.621712472036-3.62171247203639
24620624.7362909614-4.7362909614003
25588603.064475333712-15.0644753337123
26566569.995336591534-3.99533659153417
27557561.189151071784-4.18915107178373
28561545.66415762104215.3358423789576
29549547.9964424386671.00355756133285
30532535.251026579782-3.25102657978164
31526522.2707697641533.72923023584701
32511516.48295696508-5.48295696508012
33499506.884743413432-7.88474341343226
34555537.42717629235717.5728237076427
35565552.95400031534212.0459996846583
36542558.997240190181-16.9972401901808
37527525.8418595704411.15814042955935
38510510.642935046106-0.642935046106231
39514506.8355593100527.16444068994781
40517511.3666716432085.63332835679199
41508506.4381159909681.56188400903238
42493496.851936102395-3.8519361023948
43490489.5366476689230.463352331077033
44469481.284450703199-12.2844507031990
45478467.13143339197110.8685666080286
46528522.248821587375.75117841262943
47534530.8494220209423.15057797905831
48518521.958596800189-3.9585968001893
49506508.079702473317-2.07970247331701
50502493.6450755088188.35492449118198
51516503.77563142725712.2243685727433
52528517.84027565699610.1597243430039
53533522.16355860619610.8364413938036
54536526.278509293349.72149070666035
55537542.865766370818-5.8657663708176
56524536.545143822516-12.5451438225163
57536543.1578871719-7.15788717189992
58587598.710556596277-11.7105565962773
59597598.780930454105-1.78093045410492
60581584.265408047078-3.2654080470777
61564572.149744658917-8.14974465891737


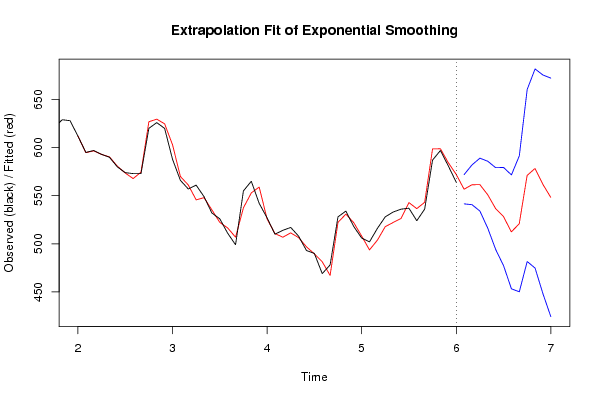
Extrapolation Forecasts of Exponential Smoothing
tForecast95% Lower Bound95% Upper Bound
62556.77094617538541.542071678907571.999820671852
63561.373121937401540.675945928169582.070297946633
64561.55364173175534.061822555433589.045460908066
65551.017756204007516.199051832215585.836460575799
66536.673379485906494.184453316313579.162305655498
67528.359288914592477.313411516818579.405166312366
68512.421115427972453.185509515487571.656721340457
69520.785122602117450.117386146346591.452859057887
70571.055601807969481.591117437412660.520086178525
71578.312509742527474.81469112790681.810328357154
72561.811205283486448.103131955216675.519278611755
73548.27655490659424.281053446774672.272056366406

\begin{tabular}{lllllllll}
\hline
Extrapolation Forecasts of Exponential Smoothing \tabularnewline
t & Forecast & 95% Lower Bound & 95% Upper Bound \tabularnewline
62 & 556.77094617538 & 541.542071678907 & 571.999820671852 \tabularnewline
63 & 561.373121937401 & 540.675945928169 & 582.070297946633 \tabularnewline
64 & 561.55364173175 & 534.061822555433 & 589.045460908066 \tabularnewline
65 & 551.017756204007 & 516.199051832215 & 585.836460575799 \tabularnewline
66 & 536.673379485906 & 494.184453316313 & 579.162305655498 \tabularnewline
67 & 528.359288914592 & 477.313411516818 & 579.405166312366 \tabularnewline
68 & 512.421115427972 & 453.185509515487 & 571.656721340457 \tabularnewline
69 & 520.785122602117 & 450.117386146346 & 591.452859057887 \tabularnewline
70 & 571.055601807969 & 481.591117437412 & 660.520086178525 \tabularnewline
71 & 578.312509742527 & 474.81469112790 & 681.810328357154 \tabularnewline
72 & 561.811205283486 & 448.103131955216 & 675.519278611755 \tabularnewline
73 & 548.27655490659 & 424.281053446774 & 672.272056366406 \tabularnewline
\hline
\end{tabular}
%Source: https://freestatistics.org/blog/index.php?pk=64059&T=3

[TABLE]
[ROW][C]Extrapolation Forecasts of Exponential Smoothing[/C][/ROW]
[ROW][C]t[/C][C]Forecast[/C][C]95% Lower Bound[/C][C]95% Upper Bound[/C][/ROW]
[ROW][C]62[/C][C]556.77094617538[/C][C]541.542071678907[/C][C]571.999820671852[/C][/ROW]
[ROW][C]63[/C][C]561.373121937401[/C][C]540.675945928169[/C][C]582.070297946633[/C][/ROW]
[ROW][C]64[/C][C]561.55364173175[/C][C]534.061822555433[/C][C]589.045460908066[/C][/ROW]
[ROW][C]65[/C][C]551.017756204007[/C][C]516.199051832215[/C][C]585.836460575799[/C][/ROW]
[ROW][C]66[/C][C]536.673379485906[/C][C]494.184453316313[/C][C]579.162305655498[/C][/ROW]
[ROW][C]67[/C][C]528.359288914592[/C][C]477.313411516818[/C][C]579.405166312366[/C][/ROW]
[ROW][C]68[/C][C]512.421115427972[/C][C]453.185509515487[/C][C]571.656721340457[/C][/ROW]
[ROW][C]69[/C][C]520.785122602117[/C][C]450.117386146346[/C][C]591.452859057887[/C][/ROW]
[ROW][C]70[/C][C]571.055601807969[/C][C]481.591117437412[/C][C]660.520086178525[/C][/ROW]
[ROW][C]71[/C][C]578.312509742527[/C][C]474.81469112790[/C][C]681.810328357154[/C][/ROW]
[ROW][C]72[/C][C]561.811205283486[/C][C]448.103131955216[/C][C]675.519278611755[/C][/ROW]
[ROW][C]73[/C][C]548.27655490659[/C][C]424.281053446774[/C][C]672.272056366406[/C][/ROW]
[/TABLE]
Source: https://freestatistics.org/blog/index.php?pk=64059&T=3

Globally Unique Identifier (entire table): ba.freestatistics.org/blog/index.php?pk=64059&T=3

As an alternative you can also use a QR Code:  

The GUIDs for individual cells are displayed in the table below:

Extrapolation Forecasts of Exponential Smoothing
tForecast95% Lower Bound95% Upper Bound
62556.77094617538541.542071678907571.999820671852
63561.373121937401540.675945928169582.070297946633
64561.55364173175534.061822555433589.045460908066
65551.017756204007516.199051832215585.836460575799
66536.673379485906494.184453316313579.162305655498
67528.359288914592477.313411516818579.405166312366
68512.421115427972453.185509515487571.656721340457
69520.785122602117450.117386146346591.452859057887
70571.055601807969481.591117437412660.520086178525
71578.312509742527474.81469112790681.810328357154
72561.811205283486448.103131955216675.519278611755
73548.27655490659424.281053446774672.272056366406


Parameters (Session):
par1 = 12 ; par2 = Triple ; par3 = multiplicative ;
Parameters (R input):
par1 = 12 ; par2 = Triple ; par3 = multiplicative ;
R code (references can be found in the software module):
par1 <- as.numeric(par1)
if (par2 == 'Single') K <- 1
if (par2 == 'Double') K <- 2
if (par2 == 'Triple') K <- par1
nx <- length(x)
nxmK <- nx - K
x <- ts(x, frequency = par1)
if (par2 == 'Single') fit <- HoltWinters(x, gamma=0, beta=0)
if (par2 == 'Double') fit <- HoltWinters(x, gamma=0)
if (par2 == 'Triple') fit <- HoltWinters(x, seasonal=par3)
fit
myresid <- x - fit$fitted[,'xhat']
bitmap(file='test1.png')
op <- par(mfrow=c(2,1))
plot(fit,ylab='Observed (black) / Fitted (red)',main='Interpolation Fit of Exponential Smoothing')
plot(myresid,ylab='Residuals',main='Interpolation Prediction Errors')
par(op)
dev.off()
bitmap(file='test2.png')
p <- predict(fit, par1, prediction.interval=TRUE)
np <- length(p[,1])
plot(fit,p,ylab='Observed (black) / Fitted (red)',main='Extrapolation Fit of Exponential Smoothing')
dev.off()
bitmap(file='test3.png')
op <- par(mfrow = c(2,2))
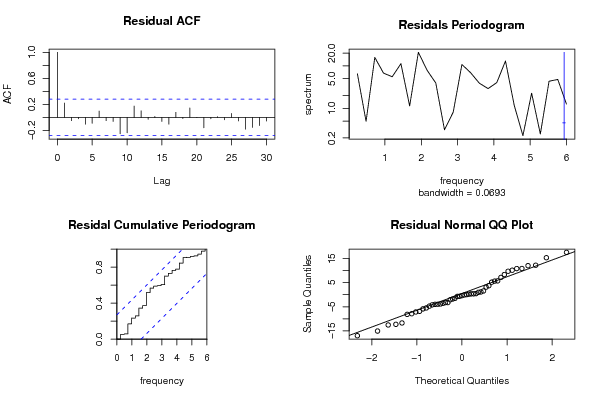
acf(as.numeric(myresid),lag.max = nx/2,main='Residual ACF')
spectrum(myresid,main='Residals Periodogram')
cpgram(myresid,main='Residal Cumulative Periodogram')
qqnorm(myresid,main='Residual Normal QQ Plot')
qqline(myresid)
par(op)
dev.off()
load(file='createtable')
a<-table.start()
a<-table.row.start(a)
a<-table.element(a,'Estimated Parameters of Exponential Smoothing',2,TRUE)
a<-table.row.end(a)
a<-table.row.start(a)
a<-table.element(a,'Parameter',header=TRUE)
a<-table.element(a,'Value',header=TRUE)
a<-table.row.end(a)
a<-table.row.start(a)
a<-table.element(a,'alpha',header=TRUE)
a<-table.element(a,fit$alpha)
a<-table.row.end(a)
a<-table.row.start(a)
a<-table.element(a,'beta',header=TRUE)
a<-table.element(a,fit$beta)
a<-table.row.end(a)
a<-table.row.start(a)
a<-table.element(a,'gamma',header=TRUE)
a<-table.element(a,fit$gamma)
a<-table.row.end(a)
a<-table.end(a)
table.save(a,file='mytable.tab')
a<-table.start()
a<-table.row.start(a)
a<-table.element(a,'Interpolation Forecasts of Exponential Smoothing',4,TRUE)
a<-table.row.end(a)
a<-table.row.start(a)
a<-table.element(a,'t',header=TRUE)
a<-table.element(a,'Observed',header=TRUE)
a<-table.element(a,'Fitted',header=TRUE)
a<-table.element(a,'Residuals',header=TRUE)
a<-table.row.end(a)
for (i in 1:nxmK) {
a<-table.row.start(a)
a<-table.element(a,i+K,header=TRUE)
a<-table.element(a,x[i+K])
a<-table.element(a,fit$fitted[i,'xhat'])
a<-table.element(a,myresid[i])
a<-table.row.end(a)
}
a<-table.end(a)
table.save(a,file='mytable1.tab')
a<-table.start()
a<-table.row.start(a)
a<-table.element(a,'Extrapolation Forecasts of Exponential Smoothing',4,TRUE)
a<-table.row.end(a)
a<-table.row.start(a)
a<-table.element(a,'t',header=TRUE)
a<-table.element(a,'Forecast',header=TRUE)
a<-table.element(a,'95% Lower Bound',header=TRUE)
a<-table.element(a,'95% Upper Bound',header=TRUE)
a<-table.row.end(a)
for (i in 1:np) {
a<-table.row.start(a)
a<-table.element(a,nx+i,header=TRUE)
a<-table.element(a,p[i,'fit'])
a<-table.element(a,p[i,'lwr'])
a<-table.element(a,p[i,'upr'])
a<-table.row.end(a)
}
a<-table.end(a)
table.save(a,file='mytable2.tab')