Free Statistics

of Irreproducible Research!

Author's title

Author*The author of this computation has been verified*
R Software Modulerwasp_autocorrelation.wasp
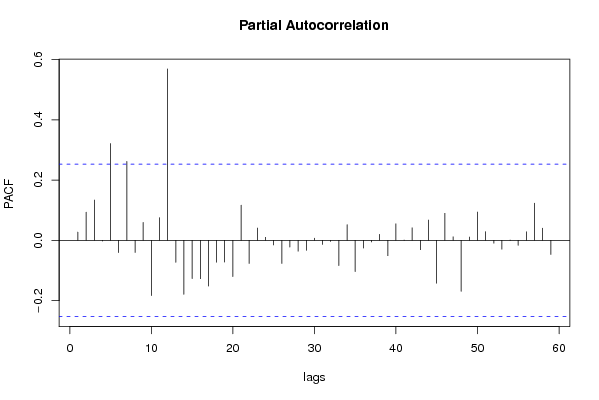
Title produced by software(Partial) Autocorrelation Function
Date of computationFri, 04 Dec 2009 12:20:08 -0700
Cite this page as followsStatistical Computations at FreeStatistics.org, Office for Research Development and Education, URL https://freestatistics.org/blog/index.php?v=date/2009/Dec/04/t1259954647hztqy9hlunm2nu3.htm/, Retrieved Sun, 28 Apr 2024 00:33:20 +0000
Statistical Computations at FreeStatistics.org, Office for Research Development and Education, URL https://freestatistics.org/blog/index.php?pk=64060, Retrieved Sun, 28 Apr 2024 00:33:20 +0000
QR Codes:

Original text written by user:
IsPrivate?No (this computation is public)
User-defined keywords
Estimated Impact77
Family? (F = Feedback message, R = changed R code, M = changed R Module, P = changed Parameters, D = changed Data)
-       [(Partial) Autocorrelation Function] [ACF 1] [2009-12-04 19:20:08] [e458b4e05bf28a297f8af8d9f96e59d6] [Current]
Feedback Forum

Post a new message
Dataseries X:
96,2
96,8
109,9
88
91,1
106,4
68,6
100,1
108
106
108,6
91,5
99,2
98
96,6
102,8
96,9
110
70,5
101,9
109,6
107,8
113
93,8
108
102,8
116,3
89,2
106,7
112,1
74,2
108,8
111,5
118,8
118,9
97,6
116,4
107,9
121,2
97,9
113,4
117,6
79,6
115,9
115,7
129,1
123,3
96,7
121,2
118,2
102,1
125,4
116,7
121,3
85,3
114,2
124,4
131
118,3
99,6


Summary of computational transaction
Raw Inputview raw input (R code)
Raw Outputview raw output of R engine
Computing time1 seconds
R Server'Gwilym Jenkins' @ 72.249.127.135

\begin{tabular}{lllllllll}
\hline
Summary of computational transaction \tabularnewline
Raw Input & view raw input (R code)  \tabularnewline
Raw Output & view raw output of R engine  \tabularnewline
Computing time & 1 seconds \tabularnewline
R Server & 'Gwilym Jenkins' @ 72.249.127.135 \tabularnewline
\hline
\end{tabular}
%Source: https://freestatistics.org/blog/index.php?pk=64060&T=0

[TABLE]
[ROW][C]Summary of computational transaction[/C][/ROW]
[ROW][C]Raw Input[/C][C]view raw input (R code) [/C][/ROW]
[ROW][C]Raw Output[/C][C]view raw output of R engine [/C][/ROW]
[ROW][C]Computing time[/C][C]1 seconds[/C][/ROW]
[ROW][C]R Server[/C][C]'Gwilym Jenkins' @ 72.249.127.135[/C][/ROW]
[/TABLE]
Source: https://freestatistics.org/blog/index.php?pk=64060&T=0

Globally Unique Identifier (entire table): ba.freestatistics.org/blog/index.php?pk=64060&T=0

As an alternative you can also use a QR Code:  

The GUIDs for individual cells are displayed in the table below:

Summary of computational transaction
Raw Inputview raw input (R code)
Raw Outputview raw output of R engine
Computing time1 seconds
R Server'Gwilym Jenkins' @ 72.249.127.135


Autocorrelation Function
Time lag kACF(k)T-STATP-value
10.0273250.21170.416545
20.0942280.72990.23415
30.137231.0630.146025
40.0117530.0910.463882
50.337492.61420.005646
6-0.007813-0.06050.475971
70.2736642.11980.019085
80.0597890.46310.322476
90.0486290.37670.353869
100.0259820.20130.42059
110.0228480.1770.430061
120.6414814.96893e-06
13-0.023065-0.17870.429404
140.0063640.04930.480424
150.0419130.32470.373286
16-0.100979-0.78220.218591
170.1813891.4050.082584
18-0.095907-0.74290.230222
190.1054840.81710.20856
20-0.046565-0.36070.359798
21-0.02673-0.20710.418336
22-0.11609-0.89920.186062
23-0.033376-0.25850.398441
240.3656732.83250.00314
25-0.129442-1.00270.160027
26-0.069749-0.54030.295503
27-0.088813-0.68790.247069
28-0.167562-1.29790.09964
290.0500330.38760.349858
30-0.156988-1.2160.11437
31-0.009217-0.07140.47166
32-0.101127-0.78330.218259
33-0.1279-0.99070.162904
34-0.14441-1.11860.133885
35-0.111039-0.86010.196577
360.1894411.46740.073745
37-0.162092-1.25560.107072
38-0.100237-0.77640.220272
39-0.145388-1.12620.132288
40-0.167434-1.29690.099808
41-0.002029-0.01570.493755
42-0.129254-1.00120.160376
43-0.056789-0.43990.330799
44-0.05926-0.4590.323938
45-0.169314-1.31150.097343
46-0.087759-0.67980.24963
47-0.062345-0.48290.315454
480.0281790.21830.413979
49-0.069937-0.54170.295005
50-0.071955-0.55740.289676
51-0.080794-0.62580.266901
52-0.100458-0.77810.219772
53-0.026687-0.20670.418467
54-0.033416-0.25880.398322
55-0.021591-0.16720.433872
56-0.016068-0.12450.450683
57-0.027794-0.21530.415136
58-0.005501-0.04260.483075
590.0039830.03090.487744
60NANANA

\begin{tabular}{lllllllll}
\hline
Autocorrelation Function \tabularnewline
Time lag k & ACF(k) & T-STAT & P-value \tabularnewline
1 & 0.027325 & 0.2117 & 0.416545 \tabularnewline
2 & 0.094228 & 0.7299 & 0.23415 \tabularnewline
3 & 0.13723 & 1.063 & 0.146025 \tabularnewline
4 & 0.011753 & 0.091 & 0.463882 \tabularnewline
5 & 0.33749 & 2.6142 & 0.005646 \tabularnewline
6 & -0.007813 & -0.0605 & 0.475971 \tabularnewline
7 & 0.273664 & 2.1198 & 0.019085 \tabularnewline
8 & 0.059789 & 0.4631 & 0.322476 \tabularnewline
9 & 0.048629 & 0.3767 & 0.353869 \tabularnewline
10 & 0.025982 & 0.2013 & 0.42059 \tabularnewline
11 & 0.022848 & 0.177 & 0.430061 \tabularnewline
12 & 0.641481 & 4.9689 & 3e-06 \tabularnewline
13 & -0.023065 & -0.1787 & 0.429404 \tabularnewline
14 & 0.006364 & 0.0493 & 0.480424 \tabularnewline
15 & 0.041913 & 0.3247 & 0.373286 \tabularnewline
16 & -0.100979 & -0.7822 & 0.218591 \tabularnewline
17 & 0.181389 & 1.405 & 0.082584 \tabularnewline
18 & -0.095907 & -0.7429 & 0.230222 \tabularnewline
19 & 0.105484 & 0.8171 & 0.20856 \tabularnewline
20 & -0.046565 & -0.3607 & 0.359798 \tabularnewline
21 & -0.02673 & -0.2071 & 0.418336 \tabularnewline
22 & -0.11609 & -0.8992 & 0.186062 \tabularnewline
23 & -0.033376 & -0.2585 & 0.398441 \tabularnewline
24 & 0.365673 & 2.8325 & 0.00314 \tabularnewline
25 & -0.129442 & -1.0027 & 0.160027 \tabularnewline
26 & -0.069749 & -0.5403 & 0.295503 \tabularnewline
27 & -0.088813 & -0.6879 & 0.247069 \tabularnewline
28 & -0.167562 & -1.2979 & 0.09964 \tabularnewline
29 & 0.050033 & 0.3876 & 0.349858 \tabularnewline
30 & -0.156988 & -1.216 & 0.11437 \tabularnewline
31 & -0.009217 & -0.0714 & 0.47166 \tabularnewline
32 & -0.101127 & -0.7833 & 0.218259 \tabularnewline
33 & -0.1279 & -0.9907 & 0.162904 \tabularnewline
34 & -0.14441 & -1.1186 & 0.133885 \tabularnewline
35 & -0.111039 & -0.8601 & 0.196577 \tabularnewline
36 & 0.189441 & 1.4674 & 0.073745 \tabularnewline
37 & -0.162092 & -1.2556 & 0.107072 \tabularnewline
38 & -0.100237 & -0.7764 & 0.220272 \tabularnewline
39 & -0.145388 & -1.1262 & 0.132288 \tabularnewline
40 & -0.167434 & -1.2969 & 0.099808 \tabularnewline
41 & -0.002029 & -0.0157 & 0.493755 \tabularnewline
42 & -0.129254 & -1.0012 & 0.160376 \tabularnewline
43 & -0.056789 & -0.4399 & 0.330799 \tabularnewline
44 & -0.05926 & -0.459 & 0.323938 \tabularnewline
45 & -0.169314 & -1.3115 & 0.097343 \tabularnewline
46 & -0.087759 & -0.6798 & 0.24963 \tabularnewline
47 & -0.062345 & -0.4829 & 0.315454 \tabularnewline
48 & 0.028179 & 0.2183 & 0.413979 \tabularnewline
49 & -0.069937 & -0.5417 & 0.295005 \tabularnewline
50 & -0.071955 & -0.5574 & 0.289676 \tabularnewline
51 & -0.080794 & -0.6258 & 0.266901 \tabularnewline
52 & -0.100458 & -0.7781 & 0.219772 \tabularnewline
53 & -0.026687 & -0.2067 & 0.418467 \tabularnewline
54 & -0.033416 & -0.2588 & 0.398322 \tabularnewline
55 & -0.021591 & -0.1672 & 0.433872 \tabularnewline
56 & -0.016068 & -0.1245 & 0.450683 \tabularnewline
57 & -0.027794 & -0.2153 & 0.415136 \tabularnewline
58 & -0.005501 & -0.0426 & 0.483075 \tabularnewline
59 & 0.003983 & 0.0309 & 0.487744 \tabularnewline
60 & NA & NA & NA \tabularnewline
\hline
\end{tabular}
%Source: https://freestatistics.org/blog/index.php?pk=64060&T=1

[TABLE]
[ROW][C]Autocorrelation Function[/C][/ROW]
[ROW][C]Time lag k[/C][C]ACF(k)[/C][C]T-STAT[/C][C]P-value[/C][/ROW]
[ROW][C]1[/C][C]0.027325[/C][C]0.2117[/C][C]0.416545[/C][/ROW]
[ROW][C]2[/C][C]0.094228[/C][C]0.7299[/C][C]0.23415[/C][/ROW]
[ROW][C]3[/C][C]0.13723[/C][C]1.063[/C][C]0.146025[/C][/ROW]
[ROW][C]4[/C][C]0.011753[/C][C]0.091[/C][C]0.463882[/C][/ROW]
[ROW][C]5[/C][C]0.33749[/C][C]2.6142[/C][C]0.005646[/C][/ROW]
[ROW][C]6[/C][C]-0.007813[/C][C]-0.0605[/C][C]0.475971[/C][/ROW]
[ROW][C]7[/C][C]0.273664[/C][C]2.1198[/C][C]0.019085[/C][/ROW]
[ROW][C]8[/C][C]0.059789[/C][C]0.4631[/C][C]0.322476[/C][/ROW]
[ROW][C]9[/C][C]0.048629[/C][C]0.3767[/C][C]0.353869[/C][/ROW]
[ROW][C]10[/C][C]0.025982[/C][C]0.2013[/C][C]0.42059[/C][/ROW]
[ROW][C]11[/C][C]0.022848[/C][C]0.177[/C][C]0.430061[/C][/ROW]
[ROW][C]12[/C][C]0.641481[/C][C]4.9689[/C][C]3e-06[/C][/ROW]
[ROW][C]13[/C][C]-0.023065[/C][C]-0.1787[/C][C]0.429404[/C][/ROW]
[ROW][C]14[/C][C]0.006364[/C][C]0.0493[/C][C]0.480424[/C][/ROW]
[ROW][C]15[/C][C]0.041913[/C][C]0.3247[/C][C]0.373286[/C][/ROW]
[ROW][C]16[/C][C]-0.100979[/C][C]-0.7822[/C][C]0.218591[/C][/ROW]
[ROW][C]17[/C][C]0.181389[/C][C]1.405[/C][C]0.082584[/C][/ROW]
[ROW][C]18[/C][C]-0.095907[/C][C]-0.7429[/C][C]0.230222[/C][/ROW]
[ROW][C]19[/C][C]0.105484[/C][C]0.8171[/C][C]0.20856[/C][/ROW]
[ROW][C]20[/C][C]-0.046565[/C][C]-0.3607[/C][C]0.359798[/C][/ROW]
[ROW][C]21[/C][C]-0.02673[/C][C]-0.2071[/C][C]0.418336[/C][/ROW]
[ROW][C]22[/C][C]-0.11609[/C][C]-0.8992[/C][C]0.186062[/C][/ROW]
[ROW][C]23[/C][C]-0.033376[/C][C]-0.2585[/C][C]0.398441[/C][/ROW]
[ROW][C]24[/C][C]0.365673[/C][C]2.8325[/C][C]0.00314[/C][/ROW]
[ROW][C]25[/C][C]-0.129442[/C][C]-1.0027[/C][C]0.160027[/C][/ROW]
[ROW][C]26[/C][C]-0.069749[/C][C]-0.5403[/C][C]0.295503[/C][/ROW]
[ROW][C]27[/C][C]-0.088813[/C][C]-0.6879[/C][C]0.247069[/C][/ROW]
[ROW][C]28[/C][C]-0.167562[/C][C]-1.2979[/C][C]0.09964[/C][/ROW]
[ROW][C]29[/C][C]0.050033[/C][C]0.3876[/C][C]0.349858[/C][/ROW]
[ROW][C]30[/C][C]-0.156988[/C][C]-1.216[/C][C]0.11437[/C][/ROW]
[ROW][C]31[/C][C]-0.009217[/C][C]-0.0714[/C][C]0.47166[/C][/ROW]
[ROW][C]32[/C][C]-0.101127[/C][C]-0.7833[/C][C]0.218259[/C][/ROW]
[ROW][C]33[/C][C]-0.1279[/C][C]-0.9907[/C][C]0.162904[/C][/ROW]
[ROW][C]34[/C][C]-0.14441[/C][C]-1.1186[/C][C]0.133885[/C][/ROW]
[ROW][C]35[/C][C]-0.111039[/C][C]-0.8601[/C][C]0.196577[/C][/ROW]
[ROW][C]36[/C][C]0.189441[/C][C]1.4674[/C][C]0.073745[/C][/ROW]
[ROW][C]37[/C][C]-0.162092[/C][C]-1.2556[/C][C]0.107072[/C][/ROW]
[ROW][C]38[/C][C]-0.100237[/C][C]-0.7764[/C][C]0.220272[/C][/ROW]
[ROW][C]39[/C][C]-0.145388[/C][C]-1.1262[/C][C]0.132288[/C][/ROW]
[ROW][C]40[/C][C]-0.167434[/C][C]-1.2969[/C][C]0.099808[/C][/ROW]
[ROW][C]41[/C][C]-0.002029[/C][C]-0.0157[/C][C]0.493755[/C][/ROW]
[ROW][C]42[/C][C]-0.129254[/C][C]-1.0012[/C][C]0.160376[/C][/ROW]
[ROW][C]43[/C][C]-0.056789[/C][C]-0.4399[/C][C]0.330799[/C][/ROW]
[ROW][C]44[/C][C]-0.05926[/C][C]-0.459[/C][C]0.323938[/C][/ROW]
[ROW][C]45[/C][C]-0.169314[/C][C]-1.3115[/C][C]0.097343[/C][/ROW]
[ROW][C]46[/C][C]-0.087759[/C][C]-0.6798[/C][C]0.24963[/C][/ROW]
[ROW][C]47[/C][C]-0.062345[/C][C]-0.4829[/C][C]0.315454[/C][/ROW]
[ROW][C]48[/C][C]0.028179[/C][C]0.2183[/C][C]0.413979[/C][/ROW]
[ROW][C]49[/C][C]-0.069937[/C][C]-0.5417[/C][C]0.295005[/C][/ROW]
[ROW][C]50[/C][C]-0.071955[/C][C]-0.5574[/C][C]0.289676[/C][/ROW]
[ROW][C]51[/C][C]-0.080794[/C][C]-0.6258[/C][C]0.266901[/C][/ROW]
[ROW][C]52[/C][C]-0.100458[/C][C]-0.7781[/C][C]0.219772[/C][/ROW]
[ROW][C]53[/C][C]-0.026687[/C][C]-0.2067[/C][C]0.418467[/C][/ROW]
[ROW][C]54[/C][C]-0.033416[/C][C]-0.2588[/C][C]0.398322[/C][/ROW]
[ROW][C]55[/C][C]-0.021591[/C][C]-0.1672[/C][C]0.433872[/C][/ROW]
[ROW][C]56[/C][C]-0.016068[/C][C]-0.1245[/C][C]0.450683[/C][/ROW]
[ROW][C]57[/C][C]-0.027794[/C][C]-0.2153[/C][C]0.415136[/C][/ROW]
[ROW][C]58[/C][C]-0.005501[/C][C]-0.0426[/C][C]0.483075[/C][/ROW]
[ROW][C]59[/C][C]0.003983[/C][C]0.0309[/C][C]0.487744[/C][/ROW]
[ROW][C]60[/C][C]NA[/C][C]NA[/C][C]NA[/C][/ROW]
[/TABLE]
Source: https://freestatistics.org/blog/index.php?pk=64060&T=1

Globally Unique Identifier (entire table): ba.freestatistics.org/blog/index.php?pk=64060&T=1

As an alternative you can also use a QR Code:  

The GUIDs for individual cells are displayed in the table below:

Autocorrelation Function
Time lag kACF(k)T-STATP-value
10.0273250.21170.416545
20.0942280.72990.23415
30.137231.0630.146025
40.0117530.0910.463882
50.337492.61420.005646
6-0.007813-0.06050.475971
70.2736642.11980.019085
80.0597890.46310.322476
90.0486290.37670.353869
100.0259820.20130.42059
110.0228480.1770.430061
120.6414814.96893e-06
13-0.023065-0.17870.429404
140.0063640.04930.480424
150.0419130.32470.373286
16-0.100979-0.78220.218591
170.1813891.4050.082584
18-0.095907-0.74290.230222
190.1054840.81710.20856
20-0.046565-0.36070.359798
21-0.02673-0.20710.418336
22-0.11609-0.89920.186062
23-0.033376-0.25850.398441
240.3656732.83250.00314
25-0.129442-1.00270.160027
26-0.069749-0.54030.295503
27-0.088813-0.68790.247069
28-0.167562-1.29790.09964
290.0500330.38760.349858
30-0.156988-1.2160.11437
31-0.009217-0.07140.47166
32-0.101127-0.78330.218259
33-0.1279-0.99070.162904
34-0.14441-1.11860.133885
35-0.111039-0.86010.196577
360.1894411.46740.073745
37-0.162092-1.25560.107072
38-0.100237-0.77640.220272
39-0.145388-1.12620.132288
40-0.167434-1.29690.099808
41-0.002029-0.01570.493755
42-0.129254-1.00120.160376
43-0.056789-0.43990.330799
44-0.05926-0.4590.323938
45-0.169314-1.31150.097343
46-0.087759-0.67980.24963
47-0.062345-0.48290.315454
480.0281790.21830.413979
49-0.069937-0.54170.295005
50-0.071955-0.55740.289676
51-0.080794-0.62580.266901
52-0.100458-0.77810.219772
53-0.026687-0.20670.418467
54-0.033416-0.25880.398322
55-0.021591-0.16720.433872
56-0.016068-0.12450.450683
57-0.027794-0.21530.415136
58-0.005501-0.04260.483075
590.0039830.03090.487744
60NANANA


Partial Autocorrelation Function
Time lag kPACF(k)T-STATP-value
10.0273250.21170.416545
20.0935510.72460.235743
30.1336081.03490.152429
4-0.002143-0.01660.493406
50.3211262.48740.007832
6-0.040559-0.31420.377241
70.2617682.02760.023522
8-0.039984-0.30970.378925
90.0594790.46070.323332
10-0.183077-1.41810.080666
110.0752120.58260.281178
120.5685264.40382.2e-05
13-0.072952-0.56510.287061
14-0.178954-1.38620.085412
15-0.126524-0.980.165499
16-0.12707-0.98430.164464
17-0.151614-1.17440.122438
18-0.072413-0.56090.288474
19-0.07205-0.55810.289427
20-0.120049-0.92990.178076
210.1166070.90320.185008
22-0.076604-0.59340.277581
230.0406250.31470.377049
240.0101960.0790.468657
25-0.014991-0.11610.453972
26-0.076463-0.59230.277945
27-0.022314-0.17280.431679
28-0.036092-0.27960.390385
29-0.032988-0.25550.399598
300.0070390.05450.478351
31-0.013542-0.10490.458404
32-0.003509-0.02720.489204
33-0.083786-0.6490.259406
340.0518950.4020.344563
35-0.1035-0.80170.212943
36-0.025448-0.19710.422201
37-0.005355-0.04150.483524
380.0198710.15390.439095
39-0.050913-0.39440.347352
400.0549940.4260.335823
410.0008380.00650.49742
420.0416230.32240.374132
43-0.03076-0.23830.406245
440.0672280.52070.302229
45-0.142038-1.10020.137815
460.0897760.69540.244743
470.0116320.09010.464252
48-0.16881-1.30760.097999
490.0111210.08610.46582
500.0939840.7280.234723
510.0288680.22360.41191
52-0.009175-0.07110.471788
53-0.02915-0.22580.411064
540.0009630.00750.497036
55-0.016448-0.12740.449522
560.028540.22110.412895
570.1234890.95650.171318
580.0403250.31240.377928
59-0.046493-0.36010.360007
60NANANA

\begin{tabular}{lllllllll}
\hline
Partial Autocorrelation Function \tabularnewline
Time lag k & PACF(k) & T-STAT & P-value \tabularnewline
1 & 0.027325 & 0.2117 & 0.416545 \tabularnewline
2 & 0.093551 & 0.7246 & 0.235743 \tabularnewline
3 & 0.133608 & 1.0349 & 0.152429 \tabularnewline
4 & -0.002143 & -0.0166 & 0.493406 \tabularnewline
5 & 0.321126 & 2.4874 & 0.007832 \tabularnewline
6 & -0.040559 & -0.3142 & 0.377241 \tabularnewline
7 & 0.261768 & 2.0276 & 0.023522 \tabularnewline
8 & -0.039984 & -0.3097 & 0.378925 \tabularnewline
9 & 0.059479 & 0.4607 & 0.323332 \tabularnewline
10 & -0.183077 & -1.4181 & 0.080666 \tabularnewline
11 & 0.075212 & 0.5826 & 0.281178 \tabularnewline
12 & 0.568526 & 4.4038 & 2.2e-05 \tabularnewline
13 & -0.072952 & -0.5651 & 0.287061 \tabularnewline
14 & -0.178954 & -1.3862 & 0.085412 \tabularnewline
15 & -0.126524 & -0.98 & 0.165499 \tabularnewline
16 & -0.12707 & -0.9843 & 0.164464 \tabularnewline
17 & -0.151614 & -1.1744 & 0.122438 \tabularnewline
18 & -0.072413 & -0.5609 & 0.288474 \tabularnewline
19 & -0.07205 & -0.5581 & 0.289427 \tabularnewline
20 & -0.120049 & -0.9299 & 0.178076 \tabularnewline
21 & 0.116607 & 0.9032 & 0.185008 \tabularnewline
22 & -0.076604 & -0.5934 & 0.277581 \tabularnewline
23 & 0.040625 & 0.3147 & 0.377049 \tabularnewline
24 & 0.010196 & 0.079 & 0.468657 \tabularnewline
25 & -0.014991 & -0.1161 & 0.453972 \tabularnewline
26 & -0.076463 & -0.5923 & 0.277945 \tabularnewline
27 & -0.022314 & -0.1728 & 0.431679 \tabularnewline
28 & -0.036092 & -0.2796 & 0.390385 \tabularnewline
29 & -0.032988 & -0.2555 & 0.399598 \tabularnewline
30 & 0.007039 & 0.0545 & 0.478351 \tabularnewline
31 & -0.013542 & -0.1049 & 0.458404 \tabularnewline
32 & -0.003509 & -0.0272 & 0.489204 \tabularnewline
33 & -0.083786 & -0.649 & 0.259406 \tabularnewline
34 & 0.051895 & 0.402 & 0.344563 \tabularnewline
35 & -0.1035 & -0.8017 & 0.212943 \tabularnewline
36 & -0.025448 & -0.1971 & 0.422201 \tabularnewline
37 & -0.005355 & -0.0415 & 0.483524 \tabularnewline
38 & 0.019871 & 0.1539 & 0.439095 \tabularnewline
39 & -0.050913 & -0.3944 & 0.347352 \tabularnewline
40 & 0.054994 & 0.426 & 0.335823 \tabularnewline
41 & 0.000838 & 0.0065 & 0.49742 \tabularnewline
42 & 0.041623 & 0.3224 & 0.374132 \tabularnewline
43 & -0.03076 & -0.2383 & 0.406245 \tabularnewline
44 & 0.067228 & 0.5207 & 0.302229 \tabularnewline
45 & -0.142038 & -1.1002 & 0.137815 \tabularnewline
46 & 0.089776 & 0.6954 & 0.244743 \tabularnewline
47 & 0.011632 & 0.0901 & 0.464252 \tabularnewline
48 & -0.16881 & -1.3076 & 0.097999 \tabularnewline
49 & 0.011121 & 0.0861 & 0.46582 \tabularnewline
50 & 0.093984 & 0.728 & 0.234723 \tabularnewline
51 & 0.028868 & 0.2236 & 0.41191 \tabularnewline
52 & -0.009175 & -0.0711 & 0.471788 \tabularnewline
53 & -0.02915 & -0.2258 & 0.411064 \tabularnewline
54 & 0.000963 & 0.0075 & 0.497036 \tabularnewline
55 & -0.016448 & -0.1274 & 0.449522 \tabularnewline
56 & 0.02854 & 0.2211 & 0.412895 \tabularnewline
57 & 0.123489 & 0.9565 & 0.171318 \tabularnewline
58 & 0.040325 & 0.3124 & 0.377928 \tabularnewline
59 & -0.046493 & -0.3601 & 0.360007 \tabularnewline
60 & NA & NA & NA \tabularnewline
\hline
\end{tabular}
%Source: https://freestatistics.org/blog/index.php?pk=64060&T=2

[TABLE]
[ROW][C]Partial Autocorrelation Function[/C][/ROW]
[ROW][C]Time lag k[/C][C]PACF(k)[/C][C]T-STAT[/C][C]P-value[/C][/ROW]
[ROW][C]1[/C][C]0.027325[/C][C]0.2117[/C][C]0.416545[/C][/ROW]
[ROW][C]2[/C][C]0.093551[/C][C]0.7246[/C][C]0.235743[/C][/ROW]
[ROW][C]3[/C][C]0.133608[/C][C]1.0349[/C][C]0.152429[/C][/ROW]
[ROW][C]4[/C][C]-0.002143[/C][C]-0.0166[/C][C]0.493406[/C][/ROW]
[ROW][C]5[/C][C]0.321126[/C][C]2.4874[/C][C]0.007832[/C][/ROW]
[ROW][C]6[/C][C]-0.040559[/C][C]-0.3142[/C][C]0.377241[/C][/ROW]
[ROW][C]7[/C][C]0.261768[/C][C]2.0276[/C][C]0.023522[/C][/ROW]
[ROW][C]8[/C][C]-0.039984[/C][C]-0.3097[/C][C]0.378925[/C][/ROW]
[ROW][C]9[/C][C]0.059479[/C][C]0.4607[/C][C]0.323332[/C][/ROW]
[ROW][C]10[/C][C]-0.183077[/C][C]-1.4181[/C][C]0.080666[/C][/ROW]
[ROW][C]11[/C][C]0.075212[/C][C]0.5826[/C][C]0.281178[/C][/ROW]
[ROW][C]12[/C][C]0.568526[/C][C]4.4038[/C][C]2.2e-05[/C][/ROW]
[ROW][C]13[/C][C]-0.072952[/C][C]-0.5651[/C][C]0.287061[/C][/ROW]
[ROW][C]14[/C][C]-0.178954[/C][C]-1.3862[/C][C]0.085412[/C][/ROW]
[ROW][C]15[/C][C]-0.126524[/C][C]-0.98[/C][C]0.165499[/C][/ROW]
[ROW][C]16[/C][C]-0.12707[/C][C]-0.9843[/C][C]0.164464[/C][/ROW]
[ROW][C]17[/C][C]-0.151614[/C][C]-1.1744[/C][C]0.122438[/C][/ROW]
[ROW][C]18[/C][C]-0.072413[/C][C]-0.5609[/C][C]0.288474[/C][/ROW]
[ROW][C]19[/C][C]-0.07205[/C][C]-0.5581[/C][C]0.289427[/C][/ROW]
[ROW][C]20[/C][C]-0.120049[/C][C]-0.9299[/C][C]0.178076[/C][/ROW]
[ROW][C]21[/C][C]0.116607[/C][C]0.9032[/C][C]0.185008[/C][/ROW]
[ROW][C]22[/C][C]-0.076604[/C][C]-0.5934[/C][C]0.277581[/C][/ROW]
[ROW][C]23[/C][C]0.040625[/C][C]0.3147[/C][C]0.377049[/C][/ROW]
[ROW][C]24[/C][C]0.010196[/C][C]0.079[/C][C]0.468657[/C][/ROW]
[ROW][C]25[/C][C]-0.014991[/C][C]-0.1161[/C][C]0.453972[/C][/ROW]
[ROW][C]26[/C][C]-0.076463[/C][C]-0.5923[/C][C]0.277945[/C][/ROW]
[ROW][C]27[/C][C]-0.022314[/C][C]-0.1728[/C][C]0.431679[/C][/ROW]
[ROW][C]28[/C][C]-0.036092[/C][C]-0.2796[/C][C]0.390385[/C][/ROW]
[ROW][C]29[/C][C]-0.032988[/C][C]-0.2555[/C][C]0.399598[/C][/ROW]
[ROW][C]30[/C][C]0.007039[/C][C]0.0545[/C][C]0.478351[/C][/ROW]
[ROW][C]31[/C][C]-0.013542[/C][C]-0.1049[/C][C]0.458404[/C][/ROW]
[ROW][C]32[/C][C]-0.003509[/C][C]-0.0272[/C][C]0.489204[/C][/ROW]
[ROW][C]33[/C][C]-0.083786[/C][C]-0.649[/C][C]0.259406[/C][/ROW]
[ROW][C]34[/C][C]0.051895[/C][C]0.402[/C][C]0.344563[/C][/ROW]
[ROW][C]35[/C][C]-0.1035[/C][C]-0.8017[/C][C]0.212943[/C][/ROW]
[ROW][C]36[/C][C]-0.025448[/C][C]-0.1971[/C][C]0.422201[/C][/ROW]
[ROW][C]37[/C][C]-0.005355[/C][C]-0.0415[/C][C]0.483524[/C][/ROW]
[ROW][C]38[/C][C]0.019871[/C][C]0.1539[/C][C]0.439095[/C][/ROW]
[ROW][C]39[/C][C]-0.050913[/C][C]-0.3944[/C][C]0.347352[/C][/ROW]
[ROW][C]40[/C][C]0.054994[/C][C]0.426[/C][C]0.335823[/C][/ROW]
[ROW][C]41[/C][C]0.000838[/C][C]0.0065[/C][C]0.49742[/C][/ROW]
[ROW][C]42[/C][C]0.041623[/C][C]0.3224[/C][C]0.374132[/C][/ROW]
[ROW][C]43[/C][C]-0.03076[/C][C]-0.2383[/C][C]0.406245[/C][/ROW]
[ROW][C]44[/C][C]0.067228[/C][C]0.5207[/C][C]0.302229[/C][/ROW]
[ROW][C]45[/C][C]-0.142038[/C][C]-1.1002[/C][C]0.137815[/C][/ROW]
[ROW][C]46[/C][C]0.089776[/C][C]0.6954[/C][C]0.244743[/C][/ROW]
[ROW][C]47[/C][C]0.011632[/C][C]0.0901[/C][C]0.464252[/C][/ROW]
[ROW][C]48[/C][C]-0.16881[/C][C]-1.3076[/C][C]0.097999[/C][/ROW]
[ROW][C]49[/C][C]0.011121[/C][C]0.0861[/C][C]0.46582[/C][/ROW]
[ROW][C]50[/C][C]0.093984[/C][C]0.728[/C][C]0.234723[/C][/ROW]
[ROW][C]51[/C][C]0.028868[/C][C]0.2236[/C][C]0.41191[/C][/ROW]
[ROW][C]52[/C][C]-0.009175[/C][C]-0.0711[/C][C]0.471788[/C][/ROW]
[ROW][C]53[/C][C]-0.02915[/C][C]-0.2258[/C][C]0.411064[/C][/ROW]
[ROW][C]54[/C][C]0.000963[/C][C]0.0075[/C][C]0.497036[/C][/ROW]
[ROW][C]55[/C][C]-0.016448[/C][C]-0.1274[/C][C]0.449522[/C][/ROW]
[ROW][C]56[/C][C]0.02854[/C][C]0.2211[/C][C]0.412895[/C][/ROW]
[ROW][C]57[/C][C]0.123489[/C][C]0.9565[/C][C]0.171318[/C][/ROW]
[ROW][C]58[/C][C]0.040325[/C][C]0.3124[/C][C]0.377928[/C][/ROW]
[ROW][C]59[/C][C]-0.046493[/C][C]-0.3601[/C][C]0.360007[/C][/ROW]
[ROW][C]60[/C][C]NA[/C][C]NA[/C][C]NA[/C][/ROW]
[/TABLE]
Source: https://freestatistics.org/blog/index.php?pk=64060&T=2

Globally Unique Identifier (entire table): ba.freestatistics.org/blog/index.php?pk=64060&T=2

As an alternative you can also use a QR Code:  

The GUIDs for individual cells are displayed in the table below:

Partial Autocorrelation Function
Time lag kPACF(k)T-STATP-value
10.0273250.21170.416545
20.0935510.72460.235743
30.1336081.03490.152429
4-0.002143-0.01660.493406
50.3211262.48740.007832
6-0.040559-0.31420.377241
70.2617682.02760.023522
8-0.039984-0.30970.378925
90.0594790.46070.323332
10-0.183077-1.41810.080666
110.0752120.58260.281178
120.5685264.40382.2e-05
13-0.072952-0.56510.287061
14-0.178954-1.38620.085412
15-0.126524-0.980.165499
16-0.12707-0.98430.164464
17-0.151614-1.17440.122438
18-0.072413-0.56090.288474
19-0.07205-0.55810.289427
20-0.120049-0.92990.178076
210.1166070.90320.185008
22-0.076604-0.59340.277581
230.0406250.31470.377049
240.0101960.0790.468657
25-0.014991-0.11610.453972
26-0.076463-0.59230.277945
27-0.022314-0.17280.431679
28-0.036092-0.27960.390385
29-0.032988-0.25550.399598
300.0070390.05450.478351
31-0.013542-0.10490.458404
32-0.003509-0.02720.489204
33-0.083786-0.6490.259406
340.0518950.4020.344563
35-0.1035-0.80170.212943
36-0.025448-0.19710.422201
37-0.005355-0.04150.483524
380.0198710.15390.439095
39-0.050913-0.39440.347352
400.0549940.4260.335823
410.0008380.00650.49742
420.0416230.32240.374132
43-0.03076-0.23830.406245
440.0672280.52070.302229
45-0.142038-1.10020.137815
460.0897760.69540.244743
470.0116320.09010.464252
48-0.16881-1.30760.097999
490.0111210.08610.46582
500.0939840.7280.234723
510.0288680.22360.41191
52-0.009175-0.07110.471788
53-0.02915-0.22580.411064
540.0009630.00750.497036
55-0.016448-0.12740.449522
560.028540.22110.412895
570.1234890.95650.171318
580.0403250.31240.377928
59-0.046493-0.36010.360007
60NANANA


Parameters (Session):
par1 = 60 ; par2 = 0.1 ; par3 = 0 ; par4 = 0 ; par5 = 12 ; par6 = MA ; par7 = 0.95 ;
Parameters (R input):
par1 = 60 ; par2 = 0.1 ; par3 = 0 ; par4 = 0 ; par5 = 12 ; par6 = MA ; par7 = 0.95 ;
R code (references can be found in the software module):
if (par1 == 'Default') {
par1 = 10*log10(length(x))
} else {
par1 <- as.numeric(par1)
}
par2 <- as.numeric(par2)
par3 <- as.numeric(par3)
par4 <- as.numeric(par4)
par5 <- as.numeric(par5)
if (par6 == 'White Noise') par6 <- 'white' else par6 <- 'ma'
par7 <- as.numeric(par7)
if (par2 == 0) {
x <- log(x)
} else {
x <- (x ^ par2 - 1) / par2
}
if (par3 > 0) x <- diff(x,lag=1,difference=par3)
if (par4 > 0) x <- diff(x,lag=par5,difference=par4)
bitmap(file='pic1.png')
racf <- acf(x, par1, main='Autocorrelation', xlab='time lag', ylab='ACF', ci.type=par6, ci=par7, sub=paste('(lambda=',par2,', d=',par3,', D=',par4,', CI=', par7, ', CI type=',par6,')',sep=''))
dev.off()
bitmap(file='pic2.png')
rpacf <- pacf(x,par1,main='Partial Autocorrelation',xlab='lags',ylab='PACF')
dev.off()
(myacf <- c(racf$acf))
(mypacf <- c(rpacf$acf))
lengthx <- length(x)
sqrtn <- sqrt(lengthx)
load(file='createtable')
a<-table.start()
a<-table.row.start(a)
a<-table.element(a,'Autocorrelation Function',4,TRUE)
a<-table.row.end(a)
a<-table.row.start(a)
a<-table.element(a,'Time lag k',header=TRUE)
a<-table.element(a,hyperlink('basics.htm','ACF(k)','click here for more information about the Autocorrelation Function'),header=TRUE)
a<-table.element(a,'T-STAT',header=TRUE)
a<-table.element(a,'P-value',header=TRUE)
a<-table.row.end(a)
for (i in 2:(par1+1)) {
a<-table.row.start(a)
a<-table.element(a,i-1,header=TRUE)
a<-table.element(a,round(myacf[i],6))
mytstat <- myacf[i]*sqrtn
a<-table.element(a,round(mytstat,4))
a<-table.element(a,round(1-pt(abs(mytstat),lengthx),6))
a<-table.row.end(a)
}
a<-table.end(a)
table.save(a,file='mytable.tab')
a<-table.start()
a<-table.row.start(a)
a<-table.element(a,'Partial Autocorrelation Function',4,TRUE)
a<-table.row.end(a)
a<-table.row.start(a)
a<-table.element(a,'Time lag k',header=TRUE)
a<-table.element(a,hyperlink('basics.htm','PACF(k)','click here for more information about the Partial Autocorrelation Function'),header=TRUE)
a<-table.element(a,'T-STAT',header=TRUE)
a<-table.element(a,'P-value',header=TRUE)
a<-table.row.end(a)
for (i in 1:par1) {
a<-table.row.start(a)
a<-table.element(a,i,header=TRUE)
a<-table.element(a,round(mypacf[i],6))
mytstat <- mypacf[i]*sqrtn
a<-table.element(a,round(mytstat,4))
a<-table.element(a,round(1-pt(abs(mytstat),lengthx),6))
a<-table.row.end(a)
}
a<-table.end(a)
table.save(a,file='mytable1.tab')