Free Statistics

of Irreproducible Research!

Author's title

Author*The author of this computation has been verified*
R Software Modulerwasp_autocorrelation.wasp
Title produced by software(Partial) Autocorrelation Function
Date of computationFri, 04 Dec 2009 12:26:19 -0700
Cite this page as followsStatistical Computations at FreeStatistics.org, Office for Research Development and Education, URL https://freestatistics.org/blog/index.php?v=date/2009/Dec/04/t1259954888c3d4vbxa8uj4d9v.htm/, Retrieved Sun, 28 Apr 2024 00:20:32 +0000
Statistical Computations at FreeStatistics.org, Office for Research Development and Education, URL https://freestatistics.org/blog/index.php?pk=64064, Retrieved Sun, 28 Apr 2024 00:20:32 +0000
QR Codes:

Original text written by user:
IsPrivate?No (this computation is public)
User-defined keywords
Estimated Impact103
Family? (F = Feedback message, R = changed R code, M = changed R Module, P = changed Parameters, D = changed Data)
-       [(Partial) Autocorrelation Function] [ACF 2] [2009-12-04 19:26:19] [e458b4e05bf28a297f8af8d9f96e59d6] [Current]
Feedback Forum

Post a new message
Dataseries X:
96.2
96.8
109.9
88
91.1
106.4
68.6
100.1
108
106
108.6
91.5
99.2
98
96.6
102.8
96.9
110
70.5
101.9
109.6
107.8
113
93.8
108
102.8
116.3
89.2
106.7
112.1
74.2
108.8
111.5
118.8
118.9
97.6
116.4
107.9
121.2
97.9
113.4
117.6
79.6
115.9
115.7
129.1
123.3
96.7
121.2
118.2
102.1
125.4
116.7
121.3
85.3
114.2
124.4
131
118.3
99.6


Summary of computational transaction
Raw Inputview raw input (R code)
Raw Outputview raw output of R engine
Computing time1 seconds
R Server'Gwilym Jenkins' @ 72.249.127.135

\begin{tabular}{lllllllll}
\hline
Summary of computational transaction \tabularnewline
Raw Input & view raw input (R code)  \tabularnewline
Raw Output & view raw output of R engine  \tabularnewline
Computing time & 1 seconds \tabularnewline
R Server & 'Gwilym Jenkins' @ 72.249.127.135 \tabularnewline
\hline
\end{tabular}
%Source: https://freestatistics.org/blog/index.php?pk=64064&T=0

[TABLE]
[ROW][C]Summary of computational transaction[/C][/ROW]
[ROW][C]Raw Input[/C][C]view raw input (R code) [/C][/ROW]
[ROW][C]Raw Output[/C][C]view raw output of R engine [/C][/ROW]
[ROW][C]Computing time[/C][C]1 seconds[/C][/ROW]
[ROW][C]R Server[/C][C]'Gwilym Jenkins' @ 72.249.127.135[/C][/ROW]
[/TABLE]
Source: https://freestatistics.org/blog/index.php?pk=64064&T=0

Globally Unique Identifier (entire table): ba.freestatistics.org/blog/index.php?pk=64064&T=0

As an alternative you can also use a QR Code:  

The GUIDs for individual cells are displayed in the table below:

Summary of computational transaction
Raw Inputview raw input (R code)
Raw Outputview raw output of R engine
Computing time1 seconds
R Server'Gwilym Jenkins' @ 72.249.127.135


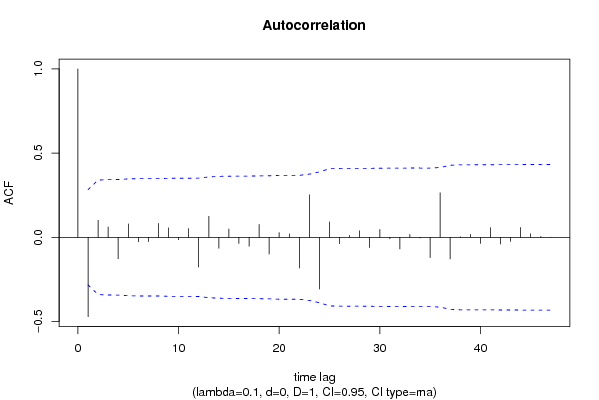
Autocorrelation Function
Time lag kACF(k)T-STATP-value
1-0.471296-3.26520.001011
20.1011360.70070.24344
30.0614770.42590.336034
4-0.126845-0.87880.191941
50.0796610.55190.291786
6-0.026899-0.18640.426474
7-0.025534-0.17690.430163
80.0824790.57140.285187
90.0560480.38830.349752
10-0.014471-0.10030.460278
110.0519050.35960.360358
12-0.176713-1.22430.113406
130.1245940.86320.196157
14-0.064443-0.44650.328631
150.0488880.33870.368155
16-0.036745-0.25460.400069
17-0.052618-0.36450.358525
180.0763430.52890.29965
19-0.099453-0.6890.24706
200.027860.1930.423878
210.0202220.14010.444582
22-0.181911-1.26030.106823
230.252161.7470.043515
24-0.307352-2.12940.019189
250.0909770.63030.26574
26-0.038277-0.26520.395999
270.0110620.07660.469613
280.0389410.26980.394238
29-0.061081-0.42320.337026
300.0464640.32190.374459
31-0.008876-0.06150.47561
32-0.069289-0.48010.316686
330.0168790.11690.453697
34-0.00413-0.02860.488646
35-0.120335-0.83370.204288
360.2640941.82970.036755
37-0.128442-0.88990.188986
380.0032410.02250.491089
390.0180320.12490.450552
40-0.036225-0.2510.401453
410.0570590.39530.34718
42-0.039049-0.27050.393952
43-0.024845-0.17210.43203
440.0588720.40790.342588
450.0205740.14250.443624
460.0053280.03690.485354
470.0005360.00370.498527
48NANANA
49NANANA
50NANANA
51NANANA
52NANANA
53NANANA
54NANANA
55NANANA
56NANANA
57NANANA
58NANANA
59NANANA
60NANANA

\begin{tabular}{lllllllll}
\hline
Autocorrelation Function \tabularnewline
Time lag k & ACF(k) & T-STAT & P-value \tabularnewline
1 & -0.471296 & -3.2652 & 0.001011 \tabularnewline
2 & 0.101136 & 0.7007 & 0.24344 \tabularnewline
3 & 0.061477 & 0.4259 & 0.336034 \tabularnewline
4 & -0.126845 & -0.8788 & 0.191941 \tabularnewline
5 & 0.079661 & 0.5519 & 0.291786 \tabularnewline
6 & -0.026899 & -0.1864 & 0.426474 \tabularnewline
7 & -0.025534 & -0.1769 & 0.430163 \tabularnewline
8 & 0.082479 & 0.5714 & 0.285187 \tabularnewline
9 & 0.056048 & 0.3883 & 0.349752 \tabularnewline
10 & -0.014471 & -0.1003 & 0.460278 \tabularnewline
11 & 0.051905 & 0.3596 & 0.360358 \tabularnewline
12 & -0.176713 & -1.2243 & 0.113406 \tabularnewline
13 & 0.124594 & 0.8632 & 0.196157 \tabularnewline
14 & -0.064443 & -0.4465 & 0.328631 \tabularnewline
15 & 0.048888 & 0.3387 & 0.368155 \tabularnewline
16 & -0.036745 & -0.2546 & 0.400069 \tabularnewline
17 & -0.052618 & -0.3645 & 0.358525 \tabularnewline
18 & 0.076343 & 0.5289 & 0.29965 \tabularnewline
19 & -0.099453 & -0.689 & 0.24706 \tabularnewline
20 & 0.02786 & 0.193 & 0.423878 \tabularnewline
21 & 0.020222 & 0.1401 & 0.444582 \tabularnewline
22 & -0.181911 & -1.2603 & 0.106823 \tabularnewline
23 & 0.25216 & 1.747 & 0.043515 \tabularnewline
24 & -0.307352 & -2.1294 & 0.019189 \tabularnewline
25 & 0.090977 & 0.6303 & 0.26574 \tabularnewline
26 & -0.038277 & -0.2652 & 0.395999 \tabularnewline
27 & 0.011062 & 0.0766 & 0.469613 \tabularnewline
28 & 0.038941 & 0.2698 & 0.394238 \tabularnewline
29 & -0.061081 & -0.4232 & 0.337026 \tabularnewline
30 & 0.046464 & 0.3219 & 0.374459 \tabularnewline
31 & -0.008876 & -0.0615 & 0.47561 \tabularnewline
32 & -0.069289 & -0.4801 & 0.316686 \tabularnewline
33 & 0.016879 & 0.1169 & 0.453697 \tabularnewline
34 & -0.00413 & -0.0286 & 0.488646 \tabularnewline
35 & -0.120335 & -0.8337 & 0.204288 \tabularnewline
36 & 0.264094 & 1.8297 & 0.036755 \tabularnewline
37 & -0.128442 & -0.8899 & 0.188986 \tabularnewline
38 & 0.003241 & 0.0225 & 0.491089 \tabularnewline
39 & 0.018032 & 0.1249 & 0.450552 \tabularnewline
40 & -0.036225 & -0.251 & 0.401453 \tabularnewline
41 & 0.057059 & 0.3953 & 0.34718 \tabularnewline
42 & -0.039049 & -0.2705 & 0.393952 \tabularnewline
43 & -0.024845 & -0.1721 & 0.43203 \tabularnewline
44 & 0.058872 & 0.4079 & 0.342588 \tabularnewline
45 & 0.020574 & 0.1425 & 0.443624 \tabularnewline
46 & 0.005328 & 0.0369 & 0.485354 \tabularnewline
47 & 0.000536 & 0.0037 & 0.498527 \tabularnewline
48 & NA & NA & NA \tabularnewline
49 & NA & NA & NA \tabularnewline
50 & NA & NA & NA \tabularnewline
51 & NA & NA & NA \tabularnewline
52 & NA & NA & NA \tabularnewline
53 & NA & NA & NA \tabularnewline
54 & NA & NA & NA \tabularnewline
55 & NA & NA & NA \tabularnewline
56 & NA & NA & NA \tabularnewline
57 & NA & NA & NA \tabularnewline
58 & NA & NA & NA \tabularnewline
59 & NA & NA & NA \tabularnewline
60 & NA & NA & NA \tabularnewline
\hline
\end{tabular}
%Source: https://freestatistics.org/blog/index.php?pk=64064&T=1

[TABLE]
[ROW][C]Autocorrelation Function[/C][/ROW]
[ROW][C]Time lag k[/C][C]ACF(k)[/C][C]T-STAT[/C][C]P-value[/C][/ROW]
[ROW][C]1[/C][C]-0.471296[/C][C]-3.2652[/C][C]0.001011[/C][/ROW]
[ROW][C]2[/C][C]0.101136[/C][C]0.7007[/C][C]0.24344[/C][/ROW]
[ROW][C]3[/C][C]0.061477[/C][C]0.4259[/C][C]0.336034[/C][/ROW]
[ROW][C]4[/C][C]-0.126845[/C][C]-0.8788[/C][C]0.191941[/C][/ROW]
[ROW][C]5[/C][C]0.079661[/C][C]0.5519[/C][C]0.291786[/C][/ROW]
[ROW][C]6[/C][C]-0.026899[/C][C]-0.1864[/C][C]0.426474[/C][/ROW]
[ROW][C]7[/C][C]-0.025534[/C][C]-0.1769[/C][C]0.430163[/C][/ROW]
[ROW][C]8[/C][C]0.082479[/C][C]0.5714[/C][C]0.285187[/C][/ROW]
[ROW][C]9[/C][C]0.056048[/C][C]0.3883[/C][C]0.349752[/C][/ROW]
[ROW][C]10[/C][C]-0.014471[/C][C]-0.1003[/C][C]0.460278[/C][/ROW]
[ROW][C]11[/C][C]0.051905[/C][C]0.3596[/C][C]0.360358[/C][/ROW]
[ROW][C]12[/C][C]-0.176713[/C][C]-1.2243[/C][C]0.113406[/C][/ROW]
[ROW][C]13[/C][C]0.124594[/C][C]0.8632[/C][C]0.196157[/C][/ROW]
[ROW][C]14[/C][C]-0.064443[/C][C]-0.4465[/C][C]0.328631[/C][/ROW]
[ROW][C]15[/C][C]0.048888[/C][C]0.3387[/C][C]0.368155[/C][/ROW]
[ROW][C]16[/C][C]-0.036745[/C][C]-0.2546[/C][C]0.400069[/C][/ROW]
[ROW][C]17[/C][C]-0.052618[/C][C]-0.3645[/C][C]0.358525[/C][/ROW]
[ROW][C]18[/C][C]0.076343[/C][C]0.5289[/C][C]0.29965[/C][/ROW]
[ROW][C]19[/C][C]-0.099453[/C][C]-0.689[/C][C]0.24706[/C][/ROW]
[ROW][C]20[/C][C]0.02786[/C][C]0.193[/C][C]0.423878[/C][/ROW]
[ROW][C]21[/C][C]0.020222[/C][C]0.1401[/C][C]0.444582[/C][/ROW]
[ROW][C]22[/C][C]-0.181911[/C][C]-1.2603[/C][C]0.106823[/C][/ROW]
[ROW][C]23[/C][C]0.25216[/C][C]1.747[/C][C]0.043515[/C][/ROW]
[ROW][C]24[/C][C]-0.307352[/C][C]-2.1294[/C][C]0.019189[/C][/ROW]
[ROW][C]25[/C][C]0.090977[/C][C]0.6303[/C][C]0.26574[/C][/ROW]
[ROW][C]26[/C][C]-0.038277[/C][C]-0.2652[/C][C]0.395999[/C][/ROW]
[ROW][C]27[/C][C]0.011062[/C][C]0.0766[/C][C]0.469613[/C][/ROW]
[ROW][C]28[/C][C]0.038941[/C][C]0.2698[/C][C]0.394238[/C][/ROW]
[ROW][C]29[/C][C]-0.061081[/C][C]-0.4232[/C][C]0.337026[/C][/ROW]
[ROW][C]30[/C][C]0.046464[/C][C]0.3219[/C][C]0.374459[/C][/ROW]
[ROW][C]31[/C][C]-0.008876[/C][C]-0.0615[/C][C]0.47561[/C][/ROW]
[ROW][C]32[/C][C]-0.069289[/C][C]-0.4801[/C][C]0.316686[/C][/ROW]
[ROW][C]33[/C][C]0.016879[/C][C]0.1169[/C][C]0.453697[/C][/ROW]
[ROW][C]34[/C][C]-0.00413[/C][C]-0.0286[/C][C]0.488646[/C][/ROW]
[ROW][C]35[/C][C]-0.120335[/C][C]-0.8337[/C][C]0.204288[/C][/ROW]
[ROW][C]36[/C][C]0.264094[/C][C]1.8297[/C][C]0.036755[/C][/ROW]
[ROW][C]37[/C][C]-0.128442[/C][C]-0.8899[/C][C]0.188986[/C][/ROW]
[ROW][C]38[/C][C]0.003241[/C][C]0.0225[/C][C]0.491089[/C][/ROW]
[ROW][C]39[/C][C]0.018032[/C][C]0.1249[/C][C]0.450552[/C][/ROW]
[ROW][C]40[/C][C]-0.036225[/C][C]-0.251[/C][C]0.401453[/C][/ROW]
[ROW][C]41[/C][C]0.057059[/C][C]0.3953[/C][C]0.34718[/C][/ROW]
[ROW][C]42[/C][C]-0.039049[/C][C]-0.2705[/C][C]0.393952[/C][/ROW]
[ROW][C]43[/C][C]-0.024845[/C][C]-0.1721[/C][C]0.43203[/C][/ROW]
[ROW][C]44[/C][C]0.058872[/C][C]0.4079[/C][C]0.342588[/C][/ROW]
[ROW][C]45[/C][C]0.020574[/C][C]0.1425[/C][C]0.443624[/C][/ROW]
[ROW][C]46[/C][C]0.005328[/C][C]0.0369[/C][C]0.485354[/C][/ROW]
[ROW][C]47[/C][C]0.000536[/C][C]0.0037[/C][C]0.498527[/C][/ROW]
[ROW][C]48[/C][C]NA[/C][C]NA[/C][C]NA[/C][/ROW]
[ROW][C]49[/C][C]NA[/C][C]NA[/C][C]NA[/C][/ROW]
[ROW][C]50[/C][C]NA[/C][C]NA[/C][C]NA[/C][/ROW]
[ROW][C]51[/C][C]NA[/C][C]NA[/C][C]NA[/C][/ROW]
[ROW][C]52[/C][C]NA[/C][C]NA[/C][C]NA[/C][/ROW]
[ROW][C]53[/C][C]NA[/C][C]NA[/C][C]NA[/C][/ROW]
[ROW][C]54[/C][C]NA[/C][C]NA[/C][C]NA[/C][/ROW]
[ROW][C]55[/C][C]NA[/C][C]NA[/C][C]NA[/C][/ROW]
[ROW][C]56[/C][C]NA[/C][C]NA[/C][C]NA[/C][/ROW]
[ROW][C]57[/C][C]NA[/C][C]NA[/C][C]NA[/C][/ROW]
[ROW][C]58[/C][C]NA[/C][C]NA[/C][C]NA[/C][/ROW]
[ROW][C]59[/C][C]NA[/C][C]NA[/C][C]NA[/C][/ROW]
[ROW][C]60[/C][C]NA[/C][C]NA[/C][C]NA[/C][/ROW]
[/TABLE]
Source: https://freestatistics.org/blog/index.php?pk=64064&T=1

Globally Unique Identifier (entire table): ba.freestatistics.org/blog/index.php?pk=64064&T=1

As an alternative you can also use a QR Code:  

The GUIDs for individual cells are displayed in the table below:

Autocorrelation Function
Time lag kACF(k)T-STATP-value
1-0.471296-3.26520.001011
20.1011360.70070.24344
30.0614770.42590.336034
4-0.126845-0.87880.191941
50.0796610.55190.291786
6-0.026899-0.18640.426474
7-0.025534-0.17690.430163
80.0824790.57140.285187
90.0560480.38830.349752
10-0.014471-0.10030.460278
110.0519050.35960.360358
12-0.176713-1.22430.113406
130.1245940.86320.196157
14-0.064443-0.44650.328631
150.0488880.33870.368155
16-0.036745-0.25460.400069
17-0.052618-0.36450.358525
180.0763430.52890.29965
19-0.099453-0.6890.24706
200.027860.1930.423878
210.0202220.14010.444582
22-0.181911-1.26030.106823
230.252161.7470.043515
24-0.307352-2.12940.019189
250.0909770.63030.26574
26-0.038277-0.26520.395999
270.0110620.07660.469613
280.0389410.26980.394238
29-0.061081-0.42320.337026
300.0464640.32190.374459
31-0.008876-0.06150.47561
32-0.069289-0.48010.316686
330.0168790.11690.453697
34-0.00413-0.02860.488646
35-0.120335-0.83370.204288
360.2640941.82970.036755
37-0.128442-0.88990.188986
380.0032410.02250.491089
390.0180320.12490.450552
40-0.036225-0.2510.401453
410.0570590.39530.34718
42-0.039049-0.27050.393952
43-0.024845-0.17210.43203
440.0588720.40790.342588
450.0205740.14250.443624
460.0053280.03690.485354
470.0005360.00370.498527
48NANANA
49NANANA
50NANANA
51NANANA
52NANANA
53NANANA
54NANANA
55NANANA
56NANANA
57NANANA
58NANANA
59NANANA
60NANANA


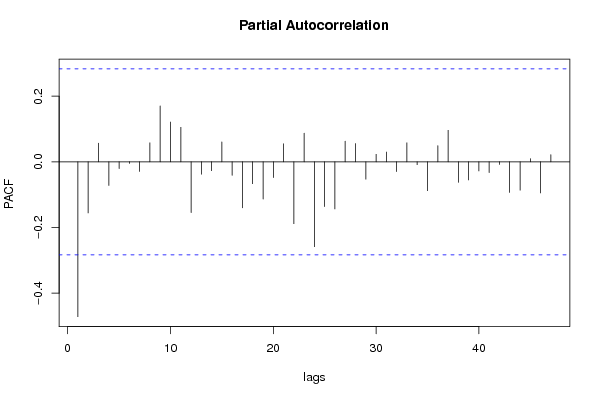
Partial Autocorrelation Function
Time lag kPACF(k)T-STATP-value
1-0.471296-3.26520.001011
2-0.155531-1.07760.14331
30.0569830.39480.347374
4-0.071984-0.49870.310127
5-0.020405-0.14140.444086
6-0.004674-0.03240.48715
7-0.029243-0.20260.420152
80.0579730.40160.344863
90.1702571.17960.121991
100.1213630.84080.202306
110.1052540.72920.234706
12-0.154312-1.06910.145185
13-0.037584-0.26040.397839
14-0.026901-0.18640.426467
150.0606990.42050.337985
16-0.041117-0.28490.388486
17-0.139819-0.96870.168776
18-0.06646-0.46040.323638
19-0.113434-0.78590.217896
20-0.047912-0.33190.370687
210.054990.3810.352448
22-0.188404-1.30530.099006
230.0874730.6060.273675
24-0.258156-1.78860.039999
25-0.136169-0.94340.175098
26-0.143238-0.99240.162994
270.0629630.43620.332316
280.0556430.38550.350784
29-0.052659-0.36480.35842
300.0229930.15930.437051
310.0300010.20790.418111
32-0.029552-0.20470.41932
330.0579330.40140.344964
34-0.008487-0.05880.476677
35-0.087869-0.60880.272772
360.0493620.3420.366925
370.0960010.66510.25458
38-0.062334-0.43190.333886
39-0.054973-0.38090.352493
40-0.027654-0.19160.424436
41-0.032418-0.22460.411624
42-0.007997-0.05540.478024
43-0.093287-0.64630.260578
44-0.086195-0.59720.276599
450.009540.06610.473788
46-0.094704-0.65610.257437
470.0220070.15250.439729
48NANANA
49NANANA
50NANANA
51NANANA
52NANANA
53NANANA
54NANANA
55NANANA
56NANANA
57NANANA
58NANANA
59NANANA
60NANANA

\begin{tabular}{lllllllll}
\hline
Partial Autocorrelation Function \tabularnewline
Time lag k & PACF(k) & T-STAT & P-value \tabularnewline
1 & -0.471296 & -3.2652 & 0.001011 \tabularnewline
2 & -0.155531 & -1.0776 & 0.14331 \tabularnewline
3 & 0.056983 & 0.3948 & 0.347374 \tabularnewline
4 & -0.071984 & -0.4987 & 0.310127 \tabularnewline
5 & -0.020405 & -0.1414 & 0.444086 \tabularnewline
6 & -0.004674 & -0.0324 & 0.48715 \tabularnewline
7 & -0.029243 & -0.2026 & 0.420152 \tabularnewline
8 & 0.057973 & 0.4016 & 0.344863 \tabularnewline
9 & 0.170257 & 1.1796 & 0.121991 \tabularnewline
10 & 0.121363 & 0.8408 & 0.202306 \tabularnewline
11 & 0.105254 & 0.7292 & 0.234706 \tabularnewline
12 & -0.154312 & -1.0691 & 0.145185 \tabularnewline
13 & -0.037584 & -0.2604 & 0.397839 \tabularnewline
14 & -0.026901 & -0.1864 & 0.426467 \tabularnewline
15 & 0.060699 & 0.4205 & 0.337985 \tabularnewline
16 & -0.041117 & -0.2849 & 0.388486 \tabularnewline
17 & -0.139819 & -0.9687 & 0.168776 \tabularnewline
18 & -0.06646 & -0.4604 & 0.323638 \tabularnewline
19 & -0.113434 & -0.7859 & 0.217896 \tabularnewline
20 & -0.047912 & -0.3319 & 0.370687 \tabularnewline
21 & 0.05499 & 0.381 & 0.352448 \tabularnewline
22 & -0.188404 & -1.3053 & 0.099006 \tabularnewline
23 & 0.087473 & 0.606 & 0.273675 \tabularnewline
24 & -0.258156 & -1.7886 & 0.039999 \tabularnewline
25 & -0.136169 & -0.9434 & 0.175098 \tabularnewline
26 & -0.143238 & -0.9924 & 0.162994 \tabularnewline
27 & 0.062963 & 0.4362 & 0.332316 \tabularnewline
28 & 0.055643 & 0.3855 & 0.350784 \tabularnewline
29 & -0.052659 & -0.3648 & 0.35842 \tabularnewline
30 & 0.022993 & 0.1593 & 0.437051 \tabularnewline
31 & 0.030001 & 0.2079 & 0.418111 \tabularnewline
32 & -0.029552 & -0.2047 & 0.41932 \tabularnewline
33 & 0.057933 & 0.4014 & 0.344964 \tabularnewline
34 & -0.008487 & -0.0588 & 0.476677 \tabularnewline
35 & -0.087869 & -0.6088 & 0.272772 \tabularnewline
36 & 0.049362 & 0.342 & 0.366925 \tabularnewline
37 & 0.096001 & 0.6651 & 0.25458 \tabularnewline
38 & -0.062334 & -0.4319 & 0.333886 \tabularnewline
39 & -0.054973 & -0.3809 & 0.352493 \tabularnewline
40 & -0.027654 & -0.1916 & 0.424436 \tabularnewline
41 & -0.032418 & -0.2246 & 0.411624 \tabularnewline
42 & -0.007997 & -0.0554 & 0.478024 \tabularnewline
43 & -0.093287 & -0.6463 & 0.260578 \tabularnewline
44 & -0.086195 & -0.5972 & 0.276599 \tabularnewline
45 & 0.00954 & 0.0661 & 0.473788 \tabularnewline
46 & -0.094704 & -0.6561 & 0.257437 \tabularnewline
47 & 0.022007 & 0.1525 & 0.439729 \tabularnewline
48 & NA & NA & NA \tabularnewline
49 & NA & NA & NA \tabularnewline
50 & NA & NA & NA \tabularnewline
51 & NA & NA & NA \tabularnewline
52 & NA & NA & NA \tabularnewline
53 & NA & NA & NA \tabularnewline
54 & NA & NA & NA \tabularnewline
55 & NA & NA & NA \tabularnewline
56 & NA & NA & NA \tabularnewline
57 & NA & NA & NA \tabularnewline
58 & NA & NA & NA \tabularnewline
59 & NA & NA & NA \tabularnewline
60 & NA & NA & NA \tabularnewline
\hline
\end{tabular}
%Source: https://freestatistics.org/blog/index.php?pk=64064&T=2

[TABLE]
[ROW][C]Partial Autocorrelation Function[/C][/ROW]
[ROW][C]Time lag k[/C][C]PACF(k)[/C][C]T-STAT[/C][C]P-value[/C][/ROW]
[ROW][C]1[/C][C]-0.471296[/C][C]-3.2652[/C][C]0.001011[/C][/ROW]
[ROW][C]2[/C][C]-0.155531[/C][C]-1.0776[/C][C]0.14331[/C][/ROW]
[ROW][C]3[/C][C]0.056983[/C][C]0.3948[/C][C]0.347374[/C][/ROW]
[ROW][C]4[/C][C]-0.071984[/C][C]-0.4987[/C][C]0.310127[/C][/ROW]
[ROW][C]5[/C][C]-0.020405[/C][C]-0.1414[/C][C]0.444086[/C][/ROW]
[ROW][C]6[/C][C]-0.004674[/C][C]-0.0324[/C][C]0.48715[/C][/ROW]
[ROW][C]7[/C][C]-0.029243[/C][C]-0.2026[/C][C]0.420152[/C][/ROW]
[ROW][C]8[/C][C]0.057973[/C][C]0.4016[/C][C]0.344863[/C][/ROW]
[ROW][C]9[/C][C]0.170257[/C][C]1.1796[/C][C]0.121991[/C][/ROW]
[ROW][C]10[/C][C]0.121363[/C][C]0.8408[/C][C]0.202306[/C][/ROW]
[ROW][C]11[/C][C]0.105254[/C][C]0.7292[/C][C]0.234706[/C][/ROW]
[ROW][C]12[/C][C]-0.154312[/C][C]-1.0691[/C][C]0.145185[/C][/ROW]
[ROW][C]13[/C][C]-0.037584[/C][C]-0.2604[/C][C]0.397839[/C][/ROW]
[ROW][C]14[/C][C]-0.026901[/C][C]-0.1864[/C][C]0.426467[/C][/ROW]
[ROW][C]15[/C][C]0.060699[/C][C]0.4205[/C][C]0.337985[/C][/ROW]
[ROW][C]16[/C][C]-0.041117[/C][C]-0.2849[/C][C]0.388486[/C][/ROW]
[ROW][C]17[/C][C]-0.139819[/C][C]-0.9687[/C][C]0.168776[/C][/ROW]
[ROW][C]18[/C][C]-0.06646[/C][C]-0.4604[/C][C]0.323638[/C][/ROW]
[ROW][C]19[/C][C]-0.113434[/C][C]-0.7859[/C][C]0.217896[/C][/ROW]
[ROW][C]20[/C][C]-0.047912[/C][C]-0.3319[/C][C]0.370687[/C][/ROW]
[ROW][C]21[/C][C]0.05499[/C][C]0.381[/C][C]0.352448[/C][/ROW]
[ROW][C]22[/C][C]-0.188404[/C][C]-1.3053[/C][C]0.099006[/C][/ROW]
[ROW][C]23[/C][C]0.087473[/C][C]0.606[/C][C]0.273675[/C][/ROW]
[ROW][C]24[/C][C]-0.258156[/C][C]-1.7886[/C][C]0.039999[/C][/ROW]
[ROW][C]25[/C][C]-0.136169[/C][C]-0.9434[/C][C]0.175098[/C][/ROW]
[ROW][C]26[/C][C]-0.143238[/C][C]-0.9924[/C][C]0.162994[/C][/ROW]
[ROW][C]27[/C][C]0.062963[/C][C]0.4362[/C][C]0.332316[/C][/ROW]
[ROW][C]28[/C][C]0.055643[/C][C]0.3855[/C][C]0.350784[/C][/ROW]
[ROW][C]29[/C][C]-0.052659[/C][C]-0.3648[/C][C]0.35842[/C][/ROW]
[ROW][C]30[/C][C]0.022993[/C][C]0.1593[/C][C]0.437051[/C][/ROW]
[ROW][C]31[/C][C]0.030001[/C][C]0.2079[/C][C]0.418111[/C][/ROW]
[ROW][C]32[/C][C]-0.029552[/C][C]-0.2047[/C][C]0.41932[/C][/ROW]
[ROW][C]33[/C][C]0.057933[/C][C]0.4014[/C][C]0.344964[/C][/ROW]
[ROW][C]34[/C][C]-0.008487[/C][C]-0.0588[/C][C]0.476677[/C][/ROW]
[ROW][C]35[/C][C]-0.087869[/C][C]-0.6088[/C][C]0.272772[/C][/ROW]
[ROW][C]36[/C][C]0.049362[/C][C]0.342[/C][C]0.366925[/C][/ROW]
[ROW][C]37[/C][C]0.096001[/C][C]0.6651[/C][C]0.25458[/C][/ROW]
[ROW][C]38[/C][C]-0.062334[/C][C]-0.4319[/C][C]0.333886[/C][/ROW]
[ROW][C]39[/C][C]-0.054973[/C][C]-0.3809[/C][C]0.352493[/C][/ROW]
[ROW][C]40[/C][C]-0.027654[/C][C]-0.1916[/C][C]0.424436[/C][/ROW]
[ROW][C]41[/C][C]-0.032418[/C][C]-0.2246[/C][C]0.411624[/C][/ROW]
[ROW][C]42[/C][C]-0.007997[/C][C]-0.0554[/C][C]0.478024[/C][/ROW]
[ROW][C]43[/C][C]-0.093287[/C][C]-0.6463[/C][C]0.260578[/C][/ROW]
[ROW][C]44[/C][C]-0.086195[/C][C]-0.5972[/C][C]0.276599[/C][/ROW]
[ROW][C]45[/C][C]0.00954[/C][C]0.0661[/C][C]0.473788[/C][/ROW]
[ROW][C]46[/C][C]-0.094704[/C][C]-0.6561[/C][C]0.257437[/C][/ROW]
[ROW][C]47[/C][C]0.022007[/C][C]0.1525[/C][C]0.439729[/C][/ROW]
[ROW][C]48[/C][C]NA[/C][C]NA[/C][C]NA[/C][/ROW]
[ROW][C]49[/C][C]NA[/C][C]NA[/C][C]NA[/C][/ROW]
[ROW][C]50[/C][C]NA[/C][C]NA[/C][C]NA[/C][/ROW]
[ROW][C]51[/C][C]NA[/C][C]NA[/C][C]NA[/C][/ROW]
[ROW][C]52[/C][C]NA[/C][C]NA[/C][C]NA[/C][/ROW]
[ROW][C]53[/C][C]NA[/C][C]NA[/C][C]NA[/C][/ROW]
[ROW][C]54[/C][C]NA[/C][C]NA[/C][C]NA[/C][/ROW]
[ROW][C]55[/C][C]NA[/C][C]NA[/C][C]NA[/C][/ROW]
[ROW][C]56[/C][C]NA[/C][C]NA[/C][C]NA[/C][/ROW]
[ROW][C]57[/C][C]NA[/C][C]NA[/C][C]NA[/C][/ROW]
[ROW][C]58[/C][C]NA[/C][C]NA[/C][C]NA[/C][/ROW]
[ROW][C]59[/C][C]NA[/C][C]NA[/C][C]NA[/C][/ROW]
[ROW][C]60[/C][C]NA[/C][C]NA[/C][C]NA[/C][/ROW]
[/TABLE]
Source: https://freestatistics.org/blog/index.php?pk=64064&T=2

Globally Unique Identifier (entire table): ba.freestatistics.org/blog/index.php?pk=64064&T=2

As an alternative you can also use a QR Code:  

The GUIDs for individual cells are displayed in the table below:

Partial Autocorrelation Function
Time lag kPACF(k)T-STATP-value
1-0.471296-3.26520.001011
2-0.155531-1.07760.14331
30.0569830.39480.347374
4-0.071984-0.49870.310127
5-0.020405-0.14140.444086
6-0.004674-0.03240.48715
7-0.029243-0.20260.420152
80.0579730.40160.344863
90.1702571.17960.121991
100.1213630.84080.202306
110.1052540.72920.234706
12-0.154312-1.06910.145185
13-0.037584-0.26040.397839
14-0.026901-0.18640.426467
150.0606990.42050.337985
16-0.041117-0.28490.388486
17-0.139819-0.96870.168776
18-0.06646-0.46040.323638
19-0.113434-0.78590.217896
20-0.047912-0.33190.370687
210.054990.3810.352448
22-0.188404-1.30530.099006
230.0874730.6060.273675
24-0.258156-1.78860.039999
25-0.136169-0.94340.175098
26-0.143238-0.99240.162994
270.0629630.43620.332316
280.0556430.38550.350784
29-0.052659-0.36480.35842
300.0229930.15930.437051
310.0300010.20790.418111
32-0.029552-0.20470.41932
330.0579330.40140.344964
34-0.008487-0.05880.476677
35-0.087869-0.60880.272772
360.0493620.3420.366925
370.0960010.66510.25458
38-0.062334-0.43190.333886
39-0.054973-0.38090.352493
40-0.027654-0.19160.424436
41-0.032418-0.22460.411624
42-0.007997-0.05540.478024
43-0.093287-0.64630.260578
44-0.086195-0.59720.276599
450.009540.06610.473788
46-0.094704-0.65610.257437
470.0220070.15250.439729
48NANANA
49NANANA
50NANANA
51NANANA
52NANANA
53NANANA
54NANANA
55NANANA
56NANANA
57NANANA
58NANANA
59NANANA
60NANANA


Parameters (Session):
par1 = 60 ; par2 = 0.1 ; par3 = 0 ; par4 = 1 ; par5 = 12 ; par6 = MA ; par7 = 0.95 ;
Parameters (R input):
par1 = 60 ; par2 = 0.1 ; par3 = 0 ; par4 = 1 ; par5 = 12 ; par6 = MA ; par7 = 0.95 ;
R code (references can be found in the software module):
if (par1 == 'Default') {
par1 = 10*log10(length(x))
} else {
par1 <- as.numeric(par1)
}
par2 <- as.numeric(par2)
par3 <- as.numeric(par3)
par4 <- as.numeric(par4)
par5 <- as.numeric(par5)
if (par6 == 'White Noise') par6 <- 'white' else par6 <- 'ma'
par7 <- as.numeric(par7)
if (par2 == 0) {
x <- log(x)
} else {
x <- (x ^ par2 - 1) / par2
}
if (par3 > 0) x <- diff(x,lag=1,difference=par3)
if (par4 > 0) x <- diff(x,lag=par5,difference=par4)
bitmap(file='pic1.png')
racf <- acf(x, par1, main='Autocorrelation', xlab='time lag', ylab='ACF', ci.type=par6, ci=par7, sub=paste('(lambda=',par2,', d=',par3,', D=',par4,', CI=', par7, ', CI type=',par6,')',sep=''))
dev.off()
bitmap(file='pic2.png')
rpacf <- pacf(x,par1,main='Partial Autocorrelation',xlab='lags',ylab='PACF')
dev.off()
(myacf <- c(racf$acf))
(mypacf <- c(rpacf$acf))
lengthx <- length(x)
sqrtn <- sqrt(lengthx)
load(file='createtable')
a<-table.start()
a<-table.row.start(a)
a<-table.element(a,'Autocorrelation Function',4,TRUE)
a<-table.row.end(a)
a<-table.row.start(a)
a<-table.element(a,'Time lag k',header=TRUE)
a<-table.element(a,hyperlink('basics.htm','ACF(k)','click here for more information about the Autocorrelation Function'),header=TRUE)
a<-table.element(a,'T-STAT',header=TRUE)
a<-table.element(a,'P-value',header=TRUE)
a<-table.row.end(a)
for (i in 2:(par1+1)) {
a<-table.row.start(a)
a<-table.element(a,i-1,header=TRUE)
a<-table.element(a,round(myacf[i],6))
mytstat <- myacf[i]*sqrtn
a<-table.element(a,round(mytstat,4))
a<-table.element(a,round(1-pt(abs(mytstat),lengthx),6))
a<-table.row.end(a)
}
a<-table.end(a)
table.save(a,file='mytable.tab')
a<-table.start()
a<-table.row.start(a)
a<-table.element(a,'Partial Autocorrelation Function',4,TRUE)
a<-table.row.end(a)
a<-table.row.start(a)
a<-table.element(a,'Time lag k',header=TRUE)
a<-table.element(a,hyperlink('basics.htm','PACF(k)','click here for more information about the Partial Autocorrelation Function'),header=TRUE)
a<-table.element(a,'T-STAT',header=TRUE)
a<-table.element(a,'P-value',header=TRUE)
a<-table.row.end(a)
for (i in 1:par1) {
a<-table.row.start(a)
a<-table.element(a,i,header=TRUE)
a<-table.element(a,round(mypacf[i],6))
mytstat <- mypacf[i]*sqrtn
a<-table.element(a,round(mytstat,4))
a<-table.element(a,round(1-pt(abs(mytstat),lengthx),6))
a<-table.row.end(a)
}
a<-table.end(a)
table.save(a,file='mytable1.tab')