Free Statistics

of Irreproducible Research!

Author's title

Author*The author of this computation has been verified*
R Software Modulerwasp_autocorrelation.wasp
Title produced by software(Partial) Autocorrelation Function
Date of computationFri, 04 Dec 2009 12:46:51 -0700
Cite this page as followsStatistical Computations at FreeStatistics.org, Office for Research Development and Education, URL https://freestatistics.org/blog/index.php?v=date/2009/Dec/04/t1259956044051ufa8x53vb9oe.htm/, Retrieved Sun, 28 Apr 2024 05:39:16 +0000
Statistical Computations at FreeStatistics.org, Office for Research Development and Education, URL https://freestatistics.org/blog/index.php?pk=64097, Retrieved Sun, 28 Apr 2024 05:39:16 +0000
QR Codes:

Original text written by user:
IsPrivate?No (this computation is public)
User-defined keywords
Estimated Impact81
Family? (F = Feedback message, R = changed R code, M = changed R Module, P = changed Parameters, D = changed Data)
-     [Univariate Data Series] [data set] [2008-12-01 19:54:57] [b98453cac15ba1066b407e146608df68]
- RMP   [(Partial) Autocorrelation Function] [] [2009-11-27 14:48:46] [b98453cac15ba1066b407e146608df68]
-    D    [(Partial) Autocorrelation Function] [] [2009-12-04 13:55:22] [4d62210f0915d3a20cbf115865da7cd4]
-             [(Partial) Autocorrelation Function] [] [2009-12-04 19:46:51] [3e9f70e60513fc8919624add68d96eca] [Current]
Feedback Forum

Post a new message
Dataseries X:
5560
3922
3759
4138
4634
3996
4308
4143
4429
5219
4929
5755
5592
4163
4962
5208
4755
4491
5732
5731
5040
6102
4904
5369
5578
4619
4731
5011
5299
4146
4625
4736
4219
5116
4205
4121
5103
4300
4578
3809
5526
4247
3830
4394
4826
4409
4569
4106
4794
3914
3793
4405
4022
4100
4788
3163
3585
3903
4178
3863
4187


Summary of computational transaction
Raw Inputview raw input (R code)
Raw Outputview raw output of R engine
Computing time3 seconds
R Server'Gwilym Jenkins' @ 72.249.127.135

\begin{tabular}{lllllllll}
\hline
Summary of computational transaction \tabularnewline
Raw Input & view raw input (R code)  \tabularnewline
Raw Output & view raw output of R engine  \tabularnewline
Computing time & 3 seconds \tabularnewline
R Server & 'Gwilym Jenkins' @ 72.249.127.135 \tabularnewline
\hline
\end{tabular}
%Source: https://freestatistics.org/blog/index.php?pk=64097&T=0

[TABLE]
[ROW][C]Summary of computational transaction[/C][/ROW]
[ROW][C]Raw Input[/C][C]view raw input (R code) [/C][/ROW]
[ROW][C]Raw Output[/C][C]view raw output of R engine [/C][/ROW]
[ROW][C]Computing time[/C][C]3 seconds[/C][/ROW]
[ROW][C]R Server[/C][C]'Gwilym Jenkins' @ 72.249.127.135[/C][/ROW]
[/TABLE]
Source: https://freestatistics.org/blog/index.php?pk=64097&T=0

Globally Unique Identifier (entire table): ba.freestatistics.org/blog/index.php?pk=64097&T=0

As an alternative you can also use a QR Code:  

The GUIDs for individual cells are displayed in the table below:

Summary of computational transaction
Raw Inputview raw input (R code)
Raw Outputview raw output of R engine
Computing time3 seconds
R Server'Gwilym Jenkins' @ 72.249.127.135


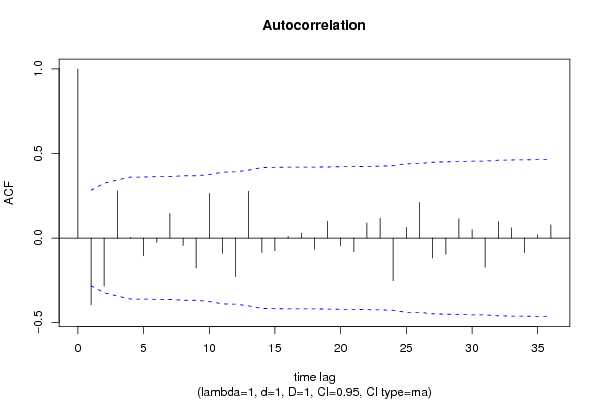
Autocorrelation Function
Time lag kACF(k)T-STATP-value
1-0.394723-2.73470.00436
2-0.283888-1.96680.027499
30.2774621.92230.030256
40.0044790.0310.487687
5-0.105304-0.72960.2346
6-0.026056-0.18050.428753
70.1454781.00790.159279
8-0.044251-0.30660.380245
9-0.176731-1.22440.113383
100.2634021.82490.037121
11-0.090302-0.62560.26726
12-0.227507-1.57620.060773
130.277161.92020.030391
14-0.085588-0.5930.277991
15-0.074746-0.51790.303469
160.0098220.0680.473015
170.0289090.20030.421051
18-0.066455-0.46040.32365
190.0990910.68650.247843
20-0.046057-0.31910.375522
21-0.080706-0.55910.28933
220.0884430.61270.271467
230.117390.81330.21003
24-0.252818-1.75160.043117
250.0628850.43570.33251
260.2104591.45810.075663
27-0.117748-0.81580.209328
28-0.096012-0.66520.254555
290.1137940.78840.217173
300.0486970.33740.368649
31-0.173303-1.20070.117885
320.0973420.67440.251645
330.060730.42070.337909
34-0.086594-0.59990.275683
350.0179750.12450.450706
360.0781640.54150.295321

\begin{tabular}{lllllllll}
\hline
Autocorrelation Function \tabularnewline
Time lag k & ACF(k) & T-STAT & P-value \tabularnewline
1 & -0.394723 & -2.7347 & 0.00436 \tabularnewline
2 & -0.283888 & -1.9668 & 0.027499 \tabularnewline
3 & 0.277462 & 1.9223 & 0.030256 \tabularnewline
4 & 0.004479 & 0.031 & 0.487687 \tabularnewline
5 & -0.105304 & -0.7296 & 0.2346 \tabularnewline
6 & -0.026056 & -0.1805 & 0.428753 \tabularnewline
7 & 0.145478 & 1.0079 & 0.159279 \tabularnewline
8 & -0.044251 & -0.3066 & 0.380245 \tabularnewline
9 & -0.176731 & -1.2244 & 0.113383 \tabularnewline
10 & 0.263402 & 1.8249 & 0.037121 \tabularnewline
11 & -0.090302 & -0.6256 & 0.26726 \tabularnewline
12 & -0.227507 & -1.5762 & 0.060773 \tabularnewline
13 & 0.27716 & 1.9202 & 0.030391 \tabularnewline
14 & -0.085588 & -0.593 & 0.277991 \tabularnewline
15 & -0.074746 & -0.5179 & 0.303469 \tabularnewline
16 & 0.009822 & 0.068 & 0.473015 \tabularnewline
17 & 0.028909 & 0.2003 & 0.421051 \tabularnewline
18 & -0.066455 & -0.4604 & 0.32365 \tabularnewline
19 & 0.099091 & 0.6865 & 0.247843 \tabularnewline
20 & -0.046057 & -0.3191 & 0.375522 \tabularnewline
21 & -0.080706 & -0.5591 & 0.28933 \tabularnewline
22 & 0.088443 & 0.6127 & 0.271467 \tabularnewline
23 & 0.11739 & 0.8133 & 0.21003 \tabularnewline
24 & -0.252818 & -1.7516 & 0.043117 \tabularnewline
25 & 0.062885 & 0.4357 & 0.33251 \tabularnewline
26 & 0.210459 & 1.4581 & 0.075663 \tabularnewline
27 & -0.117748 & -0.8158 & 0.209328 \tabularnewline
28 & -0.096012 & -0.6652 & 0.254555 \tabularnewline
29 & 0.113794 & 0.7884 & 0.217173 \tabularnewline
30 & 0.048697 & 0.3374 & 0.368649 \tabularnewline
31 & -0.173303 & -1.2007 & 0.117885 \tabularnewline
32 & 0.097342 & 0.6744 & 0.251645 \tabularnewline
33 & 0.06073 & 0.4207 & 0.337909 \tabularnewline
34 & -0.086594 & -0.5999 & 0.275683 \tabularnewline
35 & 0.017975 & 0.1245 & 0.450706 \tabularnewline
36 & 0.078164 & 0.5415 & 0.295321 \tabularnewline
\hline
\end{tabular}
%Source: https://freestatistics.org/blog/index.php?pk=64097&T=1

[TABLE]
[ROW][C]Autocorrelation Function[/C][/ROW]
[ROW][C]Time lag k[/C][C]ACF(k)[/C][C]T-STAT[/C][C]P-value[/C][/ROW]
[ROW][C]1[/C][C]-0.394723[/C][C]-2.7347[/C][C]0.00436[/C][/ROW]
[ROW][C]2[/C][C]-0.283888[/C][C]-1.9668[/C][C]0.027499[/C][/ROW]
[ROW][C]3[/C][C]0.277462[/C][C]1.9223[/C][C]0.030256[/C][/ROW]
[ROW][C]4[/C][C]0.004479[/C][C]0.031[/C][C]0.487687[/C][/ROW]
[ROW][C]5[/C][C]-0.105304[/C][C]-0.7296[/C][C]0.2346[/C][/ROW]
[ROW][C]6[/C][C]-0.026056[/C][C]-0.1805[/C][C]0.428753[/C][/ROW]
[ROW][C]7[/C][C]0.145478[/C][C]1.0079[/C][C]0.159279[/C][/ROW]
[ROW][C]8[/C][C]-0.044251[/C][C]-0.3066[/C][C]0.380245[/C][/ROW]
[ROW][C]9[/C][C]-0.176731[/C][C]-1.2244[/C][C]0.113383[/C][/ROW]
[ROW][C]10[/C][C]0.263402[/C][C]1.8249[/C][C]0.037121[/C][/ROW]
[ROW][C]11[/C][C]-0.090302[/C][C]-0.6256[/C][C]0.26726[/C][/ROW]
[ROW][C]12[/C][C]-0.227507[/C][C]-1.5762[/C][C]0.060773[/C][/ROW]
[ROW][C]13[/C][C]0.27716[/C][C]1.9202[/C][C]0.030391[/C][/ROW]
[ROW][C]14[/C][C]-0.085588[/C][C]-0.593[/C][C]0.277991[/C][/ROW]
[ROW][C]15[/C][C]-0.074746[/C][C]-0.5179[/C][C]0.303469[/C][/ROW]
[ROW][C]16[/C][C]0.009822[/C][C]0.068[/C][C]0.473015[/C][/ROW]
[ROW][C]17[/C][C]0.028909[/C][C]0.2003[/C][C]0.421051[/C][/ROW]
[ROW][C]18[/C][C]-0.066455[/C][C]-0.4604[/C][C]0.32365[/C][/ROW]
[ROW][C]19[/C][C]0.099091[/C][C]0.6865[/C][C]0.247843[/C][/ROW]
[ROW][C]20[/C][C]-0.046057[/C][C]-0.3191[/C][C]0.375522[/C][/ROW]
[ROW][C]21[/C][C]-0.080706[/C][C]-0.5591[/C][C]0.28933[/C][/ROW]
[ROW][C]22[/C][C]0.088443[/C][C]0.6127[/C][C]0.271467[/C][/ROW]
[ROW][C]23[/C][C]0.11739[/C][C]0.8133[/C][C]0.21003[/C][/ROW]
[ROW][C]24[/C][C]-0.252818[/C][C]-1.7516[/C][C]0.043117[/C][/ROW]
[ROW][C]25[/C][C]0.062885[/C][C]0.4357[/C][C]0.33251[/C][/ROW]
[ROW][C]26[/C][C]0.210459[/C][C]1.4581[/C][C]0.075663[/C][/ROW]
[ROW][C]27[/C][C]-0.117748[/C][C]-0.8158[/C][C]0.209328[/C][/ROW]
[ROW][C]28[/C][C]-0.096012[/C][C]-0.6652[/C][C]0.254555[/C][/ROW]
[ROW][C]29[/C][C]0.113794[/C][C]0.7884[/C][C]0.217173[/C][/ROW]
[ROW][C]30[/C][C]0.048697[/C][C]0.3374[/C][C]0.368649[/C][/ROW]
[ROW][C]31[/C][C]-0.173303[/C][C]-1.2007[/C][C]0.117885[/C][/ROW]
[ROW][C]32[/C][C]0.097342[/C][C]0.6744[/C][C]0.251645[/C][/ROW]
[ROW][C]33[/C][C]0.06073[/C][C]0.4207[/C][C]0.337909[/C][/ROW]
[ROW][C]34[/C][C]-0.086594[/C][C]-0.5999[/C][C]0.275683[/C][/ROW]
[ROW][C]35[/C][C]0.017975[/C][C]0.1245[/C][C]0.450706[/C][/ROW]
[ROW][C]36[/C][C]0.078164[/C][C]0.5415[/C][C]0.295321[/C][/ROW]
[/TABLE]
Source: https://freestatistics.org/blog/index.php?pk=64097&T=1

Globally Unique Identifier (entire table): ba.freestatistics.org/blog/index.php?pk=64097&T=1

As an alternative you can also use a QR Code:  

The GUIDs for individual cells are displayed in the table below:

Autocorrelation Function
Time lag kACF(k)T-STATP-value
1-0.394723-2.73470.00436
2-0.283888-1.96680.027499
30.2774621.92230.030256
40.0044790.0310.487687
5-0.105304-0.72960.2346
6-0.026056-0.18050.428753
70.1454781.00790.159279
8-0.044251-0.30660.380245
9-0.176731-1.22440.113383
100.2634021.82490.037121
11-0.090302-0.62560.26726
12-0.227507-1.57620.060773
130.277161.92020.030391
14-0.085588-0.5930.277991
15-0.074746-0.51790.303469
160.0098220.0680.473015
170.0289090.20030.421051
18-0.066455-0.46040.32365
190.0990910.68650.247843
20-0.046057-0.31910.375522
21-0.080706-0.55910.28933
220.0884430.61270.271467
230.117390.81330.21003
24-0.252818-1.75160.043117
250.0628850.43570.33251
260.2104591.45810.075663
27-0.117748-0.81580.209328
28-0.096012-0.66520.254555
290.1137940.78840.217173
300.0486970.33740.368649
31-0.173303-1.20070.117885
320.0973420.67440.251645
330.060730.42070.337909
34-0.086594-0.59990.275683
350.0179750.12450.450706
360.0781640.54150.295321


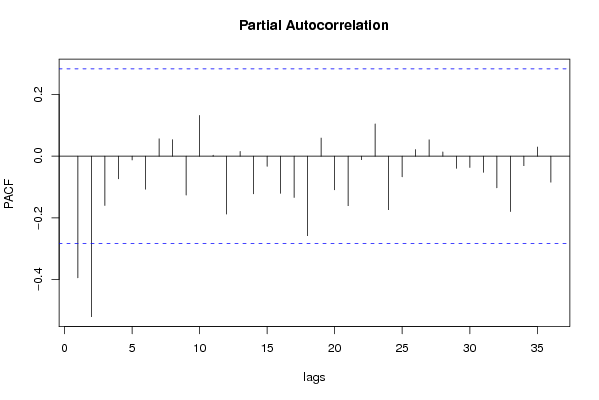
Partial Autocorrelation Function
Time lag kPACF(k)T-STATP-value
1-0.394723-2.73470.00436
2-0.520845-3.60850.000366
3-0.160196-1.10990.136293
4-0.073744-0.51090.305876
5-0.012191-0.08450.466522
6-0.107193-0.74270.230656
70.0560870.38860.349653
80.0534870.37060.356294
9-0.126323-0.87520.192914
100.1319830.91440.182538
110.0031060.02150.491461
12-0.188092-1.30310.099372
130.0153150.10610.45797
14-0.122391-0.8480.200337
15-0.033156-0.22970.409647
16-0.12083-0.83710.203333
17-0.134016-0.92850.178899
18-0.258233-1.78910.039956
190.0585470.40560.343411
20-0.109209-0.75660.226488
21-0.160831-1.11430.135356
22-0.011549-0.080.46828
230.1046670.72520.23594
24-0.173924-1.2050.117059
25-0.067117-0.4650.322018
260.0215180.14910.441056
270.0528340.3660.35797
280.0134370.09310.463108
29-0.039655-0.27470.392347
30-0.036597-0.25360.400462
31-0.052559-0.36410.358676
32-0.102725-0.71170.240048
33-0.179768-1.24550.109502
34-0.031203-0.21620.414882
350.0294690.20420.419542
36-0.084363-0.58450.280816

\begin{tabular}{lllllllll}
\hline
Partial Autocorrelation Function \tabularnewline
Time lag k & PACF(k) & T-STAT & P-value \tabularnewline
1 & -0.394723 & -2.7347 & 0.00436 \tabularnewline
2 & -0.520845 & -3.6085 & 0.000366 \tabularnewline
3 & -0.160196 & -1.1099 & 0.136293 \tabularnewline
4 & -0.073744 & -0.5109 & 0.305876 \tabularnewline
5 & -0.012191 & -0.0845 & 0.466522 \tabularnewline
6 & -0.107193 & -0.7427 & 0.230656 \tabularnewline
7 & 0.056087 & 0.3886 & 0.349653 \tabularnewline
8 & 0.053487 & 0.3706 & 0.356294 \tabularnewline
9 & -0.126323 & -0.8752 & 0.192914 \tabularnewline
10 & 0.131983 & 0.9144 & 0.182538 \tabularnewline
11 & 0.003106 & 0.0215 & 0.491461 \tabularnewline
12 & -0.188092 & -1.3031 & 0.099372 \tabularnewline
13 & 0.015315 & 0.1061 & 0.45797 \tabularnewline
14 & -0.122391 & -0.848 & 0.200337 \tabularnewline
15 & -0.033156 & -0.2297 & 0.409647 \tabularnewline
16 & -0.12083 & -0.8371 & 0.203333 \tabularnewline
17 & -0.134016 & -0.9285 & 0.178899 \tabularnewline
18 & -0.258233 & -1.7891 & 0.039956 \tabularnewline
19 & 0.058547 & 0.4056 & 0.343411 \tabularnewline
20 & -0.109209 & -0.7566 & 0.226488 \tabularnewline
21 & -0.160831 & -1.1143 & 0.135356 \tabularnewline
22 & -0.011549 & -0.08 & 0.46828 \tabularnewline
23 & 0.104667 & 0.7252 & 0.23594 \tabularnewline
24 & -0.173924 & -1.205 & 0.117059 \tabularnewline
25 & -0.067117 & -0.465 & 0.322018 \tabularnewline
26 & 0.021518 & 0.1491 & 0.441056 \tabularnewline
27 & 0.052834 & 0.366 & 0.35797 \tabularnewline
28 & 0.013437 & 0.0931 & 0.463108 \tabularnewline
29 & -0.039655 & -0.2747 & 0.392347 \tabularnewline
30 & -0.036597 & -0.2536 & 0.400462 \tabularnewline
31 & -0.052559 & -0.3641 & 0.358676 \tabularnewline
32 & -0.102725 & -0.7117 & 0.240048 \tabularnewline
33 & -0.179768 & -1.2455 & 0.109502 \tabularnewline
34 & -0.031203 & -0.2162 & 0.414882 \tabularnewline
35 & 0.029469 & 0.2042 & 0.419542 \tabularnewline
36 & -0.084363 & -0.5845 & 0.280816 \tabularnewline
\hline
\end{tabular}
%Source: https://freestatistics.org/blog/index.php?pk=64097&T=2

[TABLE]
[ROW][C]Partial Autocorrelation Function[/C][/ROW]
[ROW][C]Time lag k[/C][C]PACF(k)[/C][C]T-STAT[/C][C]P-value[/C][/ROW]
[ROW][C]1[/C][C]-0.394723[/C][C]-2.7347[/C][C]0.00436[/C][/ROW]
[ROW][C]2[/C][C]-0.520845[/C][C]-3.6085[/C][C]0.000366[/C][/ROW]
[ROW][C]3[/C][C]-0.160196[/C][C]-1.1099[/C][C]0.136293[/C][/ROW]
[ROW][C]4[/C][C]-0.073744[/C][C]-0.5109[/C][C]0.305876[/C][/ROW]
[ROW][C]5[/C][C]-0.012191[/C][C]-0.0845[/C][C]0.466522[/C][/ROW]
[ROW][C]6[/C][C]-0.107193[/C][C]-0.7427[/C][C]0.230656[/C][/ROW]
[ROW][C]7[/C][C]0.056087[/C][C]0.3886[/C][C]0.349653[/C][/ROW]
[ROW][C]8[/C][C]0.053487[/C][C]0.3706[/C][C]0.356294[/C][/ROW]
[ROW][C]9[/C][C]-0.126323[/C][C]-0.8752[/C][C]0.192914[/C][/ROW]
[ROW][C]10[/C][C]0.131983[/C][C]0.9144[/C][C]0.182538[/C][/ROW]
[ROW][C]11[/C][C]0.003106[/C][C]0.0215[/C][C]0.491461[/C][/ROW]
[ROW][C]12[/C][C]-0.188092[/C][C]-1.3031[/C][C]0.099372[/C][/ROW]
[ROW][C]13[/C][C]0.015315[/C][C]0.1061[/C][C]0.45797[/C][/ROW]
[ROW][C]14[/C][C]-0.122391[/C][C]-0.848[/C][C]0.200337[/C][/ROW]
[ROW][C]15[/C][C]-0.033156[/C][C]-0.2297[/C][C]0.409647[/C][/ROW]
[ROW][C]16[/C][C]-0.12083[/C][C]-0.8371[/C][C]0.203333[/C][/ROW]
[ROW][C]17[/C][C]-0.134016[/C][C]-0.9285[/C][C]0.178899[/C][/ROW]
[ROW][C]18[/C][C]-0.258233[/C][C]-1.7891[/C][C]0.039956[/C][/ROW]
[ROW][C]19[/C][C]0.058547[/C][C]0.4056[/C][C]0.343411[/C][/ROW]
[ROW][C]20[/C][C]-0.109209[/C][C]-0.7566[/C][C]0.226488[/C][/ROW]
[ROW][C]21[/C][C]-0.160831[/C][C]-1.1143[/C][C]0.135356[/C][/ROW]
[ROW][C]22[/C][C]-0.011549[/C][C]-0.08[/C][C]0.46828[/C][/ROW]
[ROW][C]23[/C][C]0.104667[/C][C]0.7252[/C][C]0.23594[/C][/ROW]
[ROW][C]24[/C][C]-0.173924[/C][C]-1.205[/C][C]0.117059[/C][/ROW]
[ROW][C]25[/C][C]-0.067117[/C][C]-0.465[/C][C]0.322018[/C][/ROW]
[ROW][C]26[/C][C]0.021518[/C][C]0.1491[/C][C]0.441056[/C][/ROW]
[ROW][C]27[/C][C]0.052834[/C][C]0.366[/C][C]0.35797[/C][/ROW]
[ROW][C]28[/C][C]0.013437[/C][C]0.0931[/C][C]0.463108[/C][/ROW]
[ROW][C]29[/C][C]-0.039655[/C][C]-0.2747[/C][C]0.392347[/C][/ROW]
[ROW][C]30[/C][C]-0.036597[/C][C]-0.2536[/C][C]0.400462[/C][/ROW]
[ROW][C]31[/C][C]-0.052559[/C][C]-0.3641[/C][C]0.358676[/C][/ROW]
[ROW][C]32[/C][C]-0.102725[/C][C]-0.7117[/C][C]0.240048[/C][/ROW]
[ROW][C]33[/C][C]-0.179768[/C][C]-1.2455[/C][C]0.109502[/C][/ROW]
[ROW][C]34[/C][C]-0.031203[/C][C]-0.2162[/C][C]0.414882[/C][/ROW]
[ROW][C]35[/C][C]0.029469[/C][C]0.2042[/C][C]0.419542[/C][/ROW]
[ROW][C]36[/C][C]-0.084363[/C][C]-0.5845[/C][C]0.280816[/C][/ROW]
[/TABLE]
Source: https://freestatistics.org/blog/index.php?pk=64097&T=2

Globally Unique Identifier (entire table): ba.freestatistics.org/blog/index.php?pk=64097&T=2

As an alternative you can also use a QR Code:  

The GUIDs for individual cells are displayed in the table below:

Partial Autocorrelation Function
Time lag kPACF(k)T-STATP-value
1-0.394723-2.73470.00436
2-0.520845-3.60850.000366
3-0.160196-1.10990.136293
4-0.073744-0.51090.305876
5-0.012191-0.08450.466522
6-0.107193-0.74270.230656
70.0560870.38860.349653
80.0534870.37060.356294
9-0.126323-0.87520.192914
100.1319830.91440.182538
110.0031060.02150.491461
12-0.188092-1.30310.099372
130.0153150.10610.45797
14-0.122391-0.8480.200337
15-0.033156-0.22970.409647
16-0.12083-0.83710.203333
17-0.134016-0.92850.178899
18-0.258233-1.78910.039956
190.0585470.40560.343411
20-0.109209-0.75660.226488
21-0.160831-1.11430.135356
22-0.011549-0.080.46828
230.1046670.72520.23594
24-0.173924-1.2050.117059
25-0.067117-0.4650.322018
260.0215180.14910.441056
270.0528340.3660.35797
280.0134370.09310.463108
29-0.039655-0.27470.392347
30-0.036597-0.25360.400462
31-0.052559-0.36410.358676
32-0.102725-0.71170.240048
33-0.179768-1.24550.109502
34-0.031203-0.21620.414882
350.0294690.20420.419542
36-0.084363-0.58450.280816


Parameters (Session):
par1 = 36 ; par2 = 1 ; par3 = 1 ; par4 = 1 ; par5 = 12 ; par6 = MA ; par7 = 0.95 ;
Parameters (R input):
par1 = 36 ; par2 = 1 ; par3 = 1 ; par4 = 1 ; par5 = 12 ; par6 = MA ; par7 = 0.95 ;
R code (references can be found in the software module):
if (par1 == 'Default') {
par1 = 10*log10(length(x))
} else {
par1 <- as.numeric(par1)
}
par2 <- as.numeric(par2)
par3 <- as.numeric(par3)
par4 <- as.numeric(par4)
par5 <- as.numeric(par5)
if (par6 == 'White Noise') par6 <- 'white' else par6 <- 'ma'
par7 <- as.numeric(par7)
if (par2 == 0) {
x <- log(x)
} else {
x <- (x ^ par2 - 1) / par2
}
if (par3 > 0) x <- diff(x,lag=1,difference=par3)
if (par4 > 0) x <- diff(x,lag=par5,difference=par4)
bitmap(file='pic1.png')
racf <- acf(x, par1, main='Autocorrelation', xlab='time lag', ylab='ACF', ci.type=par6, ci=par7, sub=paste('(lambda=',par2,', d=',par3,', D=',par4,', CI=', par7, ', CI type=',par6,')',sep=''))
dev.off()
bitmap(file='pic2.png')
rpacf <- pacf(x,par1,main='Partial Autocorrelation',xlab='lags',ylab='PACF')
dev.off()
(myacf <- c(racf$acf))
(mypacf <- c(rpacf$acf))
lengthx <- length(x)
sqrtn <- sqrt(lengthx)
load(file='createtable')
a<-table.start()
a<-table.row.start(a)
a<-table.element(a,'Autocorrelation Function',4,TRUE)
a<-table.row.end(a)
a<-table.row.start(a)
a<-table.element(a,'Time lag k',header=TRUE)
a<-table.element(a,hyperlink('basics.htm','ACF(k)','click here for more information about the Autocorrelation Function'),header=TRUE)
a<-table.element(a,'T-STAT',header=TRUE)
a<-table.element(a,'P-value',header=TRUE)
a<-table.row.end(a)
for (i in 2:(par1+1)) {
a<-table.row.start(a)
a<-table.element(a,i-1,header=TRUE)
a<-table.element(a,round(myacf[i],6))
mytstat <- myacf[i]*sqrtn
a<-table.element(a,round(mytstat,4))
a<-table.element(a,round(1-pt(abs(mytstat),lengthx),6))
a<-table.row.end(a)
}
a<-table.end(a)
table.save(a,file='mytable.tab')
a<-table.start()
a<-table.row.start(a)
a<-table.element(a,'Partial Autocorrelation Function',4,TRUE)
a<-table.row.end(a)
a<-table.row.start(a)
a<-table.element(a,'Time lag k',header=TRUE)
a<-table.element(a,hyperlink('basics.htm','PACF(k)','click here for more information about the Partial Autocorrelation Function'),header=TRUE)
a<-table.element(a,'T-STAT',header=TRUE)
a<-table.element(a,'P-value',header=TRUE)
a<-table.row.end(a)
for (i in 1:par1) {
a<-table.row.start(a)
a<-table.element(a,i,header=TRUE)
a<-table.element(a,round(mypacf[i],6))
mytstat <- mypacf[i]*sqrtn
a<-table.element(a,round(mytstat,4))
a<-table.element(a,round(1-pt(abs(mytstat),lengthx),6))
a<-table.row.end(a)
}
a<-table.end(a)
table.save(a,file='mytable1.tab')