Free Statistics

of Irreproducible Research!

Author's title

Author*The author of this computation has been verified*
R Software Modulerwasp_exponentialsmoothing.wasp
Title produced by softwareExponential Smoothing
Date of computationFri, 04 Dec 2009 12:53:20 -0700
Cite this page as followsStatistical Computations at FreeStatistics.org, Office for Research Development and Education, URL https://freestatistics.org/blog/index.php?v=date/2009/Dec/04/t1259956441at10fxedn6gf5un.htm/, Retrieved Sat, 27 Apr 2024 21:29:37 +0000
Statistical Computations at FreeStatistics.org, Office for Research Development and Education, URL https://freestatistics.org/blog/index.php?pk=64109, Retrieved Sat, 27 Apr 2024 21:29:37 +0000
QR Codes:

Original text written by user:
IsPrivate?No (this computation is public)
User-defined keywords
Estimated Impact105
Family? (F = Feedback message, R = changed R code, M = changed R Module, P = changed Parameters, D = changed Data)
-     [Univariate Data Series] [data set] [2008-12-01 19:54:57] [b98453cac15ba1066b407e146608df68]
- RMP   [Exponential Smoothing] [] [2009-11-27 15:04:36] [b98453cac15ba1066b407e146608df68]
-    D    [Exponential Smoothing] [] [2009-12-04 14:40:55] [4d62210f0915d3a20cbf115865da7cd4]
-   P         [Exponential Smoothing] [] [2009-12-04 19:53:20] [3e9f70e60513fc8919624add68d96eca] [Current]
Feedback Forum

Post a new message
Dataseries X:
5560
3922
3759
4138
4634
3996
4308
4143
4429
5219
4929
5755
5592
4163
4962
5208
4755
4491
5732
5731
5040
6102
4904
5369
5578
4619
4731
5011
5299
4146
4625
4736
4219
5116
4205
4121
5103
4300
4578
3809
5526
4247
3830
4394
4826
4409
4569
4106
4794
3914
3793
4405
4022
4100
4788
3163
3585
3903
4178
3863
4187


Summary of computational transaction
Raw Inputview raw input (R code)
Raw Outputview raw output of R engine
Computing time1 seconds
R Server'Gwilym Jenkins' @ 72.249.127.135

\begin{tabular}{lllllllll}
\hline
Summary of computational transaction \tabularnewline
Raw Input & view raw input (R code)  \tabularnewline
Raw Output & view raw output of R engine  \tabularnewline
Computing time & 1 seconds \tabularnewline
R Server & 'Gwilym Jenkins' @ 72.249.127.135 \tabularnewline
\hline
\end{tabular}
%Source: https://freestatistics.org/blog/index.php?pk=64109&T=0

[TABLE]
[ROW][C]Summary of computational transaction[/C][/ROW]
[ROW][C]Raw Input[/C][C]view raw input (R code) [/C][/ROW]
[ROW][C]Raw Output[/C][C]view raw output of R engine [/C][/ROW]
[ROW][C]Computing time[/C][C]1 seconds[/C][/ROW]
[ROW][C]R Server[/C][C]'Gwilym Jenkins' @ 72.249.127.135[/C][/ROW]
[/TABLE]
Source: https://freestatistics.org/blog/index.php?pk=64109&T=0

Globally Unique Identifier (entire table): ba.freestatistics.org/blog/index.php?pk=64109&T=0

As an alternative you can also use a QR Code:  

The GUIDs for individual cells are displayed in the table below:

Summary of computational transaction
Raw Inputview raw input (R code)
Raw Outputview raw output of R engine
Computing time1 seconds
R Server'Gwilym Jenkins' @ 72.249.127.135


Estimated Parameters of Exponential Smoothing
ParameterValue
alpha0.277254341489538
beta0.097258390234304
gamma0.452433755682275

\begin{tabular}{lllllllll}
\hline
Estimated Parameters of Exponential Smoothing \tabularnewline
Parameter & Value \tabularnewline
alpha & 0.277254341489538 \tabularnewline
beta & 0.097258390234304 \tabularnewline
gamma & 0.452433755682275 \tabularnewline
\hline
\end{tabular}
%Source: https://freestatistics.org/blog/index.php?pk=64109&T=1

[TABLE]
[ROW][C]Estimated Parameters of Exponential Smoothing[/C][/ROW]
[ROW][C]Parameter[/C][C]Value[/C][/ROW]
[ROW][C]alpha[/C][C]0.277254341489538[/C][/ROW]
[ROW][C]beta[/C][C]0.097258390234304[/C][/ROW]
[ROW][C]gamma[/C][C]0.452433755682275[/C][/ROW]
[/TABLE]
Source: https://freestatistics.org/blog/index.php?pk=64109&T=1

Globally Unique Identifier (entire table): ba.freestatistics.org/blog/index.php?pk=64109&T=1

As an alternative you can also use a QR Code:  

The GUIDs for individual cells are displayed in the table below:

Estimated Parameters of Exponential Smoothing
ParameterValue
alpha0.277254341489538
beta0.097258390234304
gamma0.452433755682275


Interpolation Forecasts of Exponential Smoothing
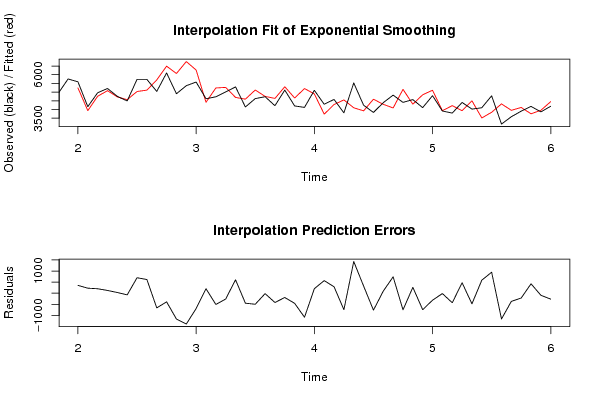
tObservedFittedResiduals
1355925238.68248791591353.31751208409
1441633935.51659519542227.483404804584
1549624760.32445506898201.675544931019
1652085082.53187493351125.468125066493
1747554723.3376953332531.6623046667464
1844914563.81926664071-72.8192666407149
1957325034.31493456657697.685065433434
2057315114.2942342393616.705765760701
2150405699.13295441262-659.132954412617
2261026490.97195685918-388.97195685918
2349046068.89264576003-1164.89264576003
2453696756.14632973248-1387.14632973248
2555786266.3255281321-688.3255281321
2646194415.46618587403203.533814125966
2747315237.68846193254-506.688461932541
2850115271.06423036057-260.064230360566
2952994694.2415269454604.758473054599
3041464595.25595490521-449.255954905211
3146255121.12484018266-496.124840182661
3247364753.97026089655-17.9702608965536
3342194636.08973084054-417.089730840545
3451165308.43775572016-192.437755720164
3542054660.57688175995-455.576881759947
3641215202.5094190291-1081.50941902910
3751034897.60912864472205.390871355279
3843003732.88160090191567.118399098094
3945784286.02217213461291.977827865392
4038094550.7109470601-741.710947060098
4155264099.027908271871426.97209172813
4242473922.99543678625324.004563213745
4338304590.97799967912-760.977999679119
4443944298.0175733199195.9824266800888
4548264087.762805934738.237194066002
4644095158.0265806207-749.0265806207
4745694303.69111136198265.308888638021
4841064847.15931538226-741.159315382262
4947945106.19081958986-312.190819589859
5039143929.44190868129-15.4419086812909
5137934220.95165934588-427.951659345876
5244053932.87097618722472.129023812784
5340224499.90741280991-477.907412809911
5441003513.95765222796586.042347772044
5547883841.21203685334946.787963146664
5631634322.05319388231-1159.05319388231
5735853952.21458139702-367.214581397021
5839034118.40463904438-215.404639044376
5941783753.28354416713424.716455832868
6038633955.73717859487-92.7371785948667
6141874453.2216652102-266.221665210201

\begin{tabular}{lllllllll}
\hline
Interpolation Forecasts of Exponential Smoothing \tabularnewline
t & Observed & Fitted & Residuals \tabularnewline
13 & 5592 & 5238.68248791591 & 353.31751208409 \tabularnewline
14 & 4163 & 3935.51659519542 & 227.483404804584 \tabularnewline
15 & 4962 & 4760.32445506898 & 201.675544931019 \tabularnewline
16 & 5208 & 5082.53187493351 & 125.468125066493 \tabularnewline
17 & 4755 & 4723.33769533325 & 31.6623046667464 \tabularnewline
18 & 4491 & 4563.81926664071 & -72.8192666407149 \tabularnewline
19 & 5732 & 5034.31493456657 & 697.685065433434 \tabularnewline
20 & 5731 & 5114.2942342393 & 616.705765760701 \tabularnewline
21 & 5040 & 5699.13295441262 & -659.132954412617 \tabularnewline
22 & 6102 & 6490.97195685918 & -388.97195685918 \tabularnewline
23 & 4904 & 6068.89264576003 & -1164.89264576003 \tabularnewline
24 & 5369 & 6756.14632973248 & -1387.14632973248 \tabularnewline
25 & 5578 & 6266.3255281321 & -688.3255281321 \tabularnewline
26 & 4619 & 4415.46618587403 & 203.533814125966 \tabularnewline
27 & 4731 & 5237.68846193254 & -506.688461932541 \tabularnewline
28 & 5011 & 5271.06423036057 & -260.064230360566 \tabularnewline
29 & 5299 & 4694.2415269454 & 604.758473054599 \tabularnewline
30 & 4146 & 4595.25595490521 & -449.255954905211 \tabularnewline
31 & 4625 & 5121.12484018266 & -496.124840182661 \tabularnewline
32 & 4736 & 4753.97026089655 & -17.9702608965536 \tabularnewline
33 & 4219 & 4636.08973084054 & -417.089730840545 \tabularnewline
34 & 5116 & 5308.43775572016 & -192.437755720164 \tabularnewline
35 & 4205 & 4660.57688175995 & -455.576881759947 \tabularnewline
36 & 4121 & 5202.5094190291 & -1081.50941902910 \tabularnewline
37 & 5103 & 4897.60912864472 & 205.390871355279 \tabularnewline
38 & 4300 & 3732.88160090191 & 567.118399098094 \tabularnewline
39 & 4578 & 4286.02217213461 & 291.977827865392 \tabularnewline
40 & 3809 & 4550.7109470601 & -741.710947060098 \tabularnewline
41 & 5526 & 4099.02790827187 & 1426.97209172813 \tabularnewline
42 & 4247 & 3922.99543678625 & 324.004563213745 \tabularnewline
43 & 3830 & 4590.97799967912 & -760.977999679119 \tabularnewline
44 & 4394 & 4298.01757331991 & 95.9824266800888 \tabularnewline
45 & 4826 & 4087.762805934 & 738.237194066002 \tabularnewline
46 & 4409 & 5158.0265806207 & -749.0265806207 \tabularnewline
47 & 4569 & 4303.69111136198 & 265.308888638021 \tabularnewline
48 & 4106 & 4847.15931538226 & -741.159315382262 \tabularnewline
49 & 4794 & 5106.19081958986 & -312.190819589859 \tabularnewline
50 & 3914 & 3929.44190868129 & -15.4419086812909 \tabularnewline
51 & 3793 & 4220.95165934588 & -427.951659345876 \tabularnewline
52 & 4405 & 3932.87097618722 & 472.129023812784 \tabularnewline
53 & 4022 & 4499.90741280991 & -477.907412809911 \tabularnewline
54 & 4100 & 3513.95765222796 & 586.042347772044 \tabularnewline
55 & 4788 & 3841.21203685334 & 946.787963146664 \tabularnewline
56 & 3163 & 4322.05319388231 & -1159.05319388231 \tabularnewline
57 & 3585 & 3952.21458139702 & -367.214581397021 \tabularnewline
58 & 3903 & 4118.40463904438 & -215.404639044376 \tabularnewline
59 & 4178 & 3753.28354416713 & 424.716455832868 \tabularnewline
60 & 3863 & 3955.73717859487 & -92.7371785948667 \tabularnewline
61 & 4187 & 4453.2216652102 & -266.221665210201 \tabularnewline
\hline
\end{tabular}
%Source: https://freestatistics.org/blog/index.php?pk=64109&T=2

[TABLE]
[ROW][C]Interpolation Forecasts of Exponential Smoothing[/C][/ROW]
[ROW][C]t[/C][C]Observed[/C][C]Fitted[/C][C]Residuals[/C][/ROW]
[ROW][C]13[/C][C]5592[/C][C]5238.68248791591[/C][C]353.31751208409[/C][/ROW]
[ROW][C]14[/C][C]4163[/C][C]3935.51659519542[/C][C]227.483404804584[/C][/ROW]
[ROW][C]15[/C][C]4962[/C][C]4760.32445506898[/C][C]201.675544931019[/C][/ROW]
[ROW][C]16[/C][C]5208[/C][C]5082.53187493351[/C][C]125.468125066493[/C][/ROW]
[ROW][C]17[/C][C]4755[/C][C]4723.33769533325[/C][C]31.6623046667464[/C][/ROW]
[ROW][C]18[/C][C]4491[/C][C]4563.81926664071[/C][C]-72.8192666407149[/C][/ROW]
[ROW][C]19[/C][C]5732[/C][C]5034.31493456657[/C][C]697.685065433434[/C][/ROW]
[ROW][C]20[/C][C]5731[/C][C]5114.2942342393[/C][C]616.705765760701[/C][/ROW]
[ROW][C]21[/C][C]5040[/C][C]5699.13295441262[/C][C]-659.132954412617[/C][/ROW]
[ROW][C]22[/C][C]6102[/C][C]6490.97195685918[/C][C]-388.97195685918[/C][/ROW]
[ROW][C]23[/C][C]4904[/C][C]6068.89264576003[/C][C]-1164.89264576003[/C][/ROW]
[ROW][C]24[/C][C]5369[/C][C]6756.14632973248[/C][C]-1387.14632973248[/C][/ROW]
[ROW][C]25[/C][C]5578[/C][C]6266.3255281321[/C][C]-688.3255281321[/C][/ROW]
[ROW][C]26[/C][C]4619[/C][C]4415.46618587403[/C][C]203.533814125966[/C][/ROW]
[ROW][C]27[/C][C]4731[/C][C]5237.68846193254[/C][C]-506.688461932541[/C][/ROW]
[ROW][C]28[/C][C]5011[/C][C]5271.06423036057[/C][C]-260.064230360566[/C][/ROW]
[ROW][C]29[/C][C]5299[/C][C]4694.2415269454[/C][C]604.758473054599[/C][/ROW]
[ROW][C]30[/C][C]4146[/C][C]4595.25595490521[/C][C]-449.255954905211[/C][/ROW]
[ROW][C]31[/C][C]4625[/C][C]5121.12484018266[/C][C]-496.124840182661[/C][/ROW]
[ROW][C]32[/C][C]4736[/C][C]4753.97026089655[/C][C]-17.9702608965536[/C][/ROW]
[ROW][C]33[/C][C]4219[/C][C]4636.08973084054[/C][C]-417.089730840545[/C][/ROW]
[ROW][C]34[/C][C]5116[/C][C]5308.43775572016[/C][C]-192.437755720164[/C][/ROW]
[ROW][C]35[/C][C]4205[/C][C]4660.57688175995[/C][C]-455.576881759947[/C][/ROW]
[ROW][C]36[/C][C]4121[/C][C]5202.5094190291[/C][C]-1081.50941902910[/C][/ROW]
[ROW][C]37[/C][C]5103[/C][C]4897.60912864472[/C][C]205.390871355279[/C][/ROW]
[ROW][C]38[/C][C]4300[/C][C]3732.88160090191[/C][C]567.118399098094[/C][/ROW]
[ROW][C]39[/C][C]4578[/C][C]4286.02217213461[/C][C]291.977827865392[/C][/ROW]
[ROW][C]40[/C][C]3809[/C][C]4550.7109470601[/C][C]-741.710947060098[/C][/ROW]
[ROW][C]41[/C][C]5526[/C][C]4099.02790827187[/C][C]1426.97209172813[/C][/ROW]
[ROW][C]42[/C][C]4247[/C][C]3922.99543678625[/C][C]324.004563213745[/C][/ROW]
[ROW][C]43[/C][C]3830[/C][C]4590.97799967912[/C][C]-760.977999679119[/C][/ROW]
[ROW][C]44[/C][C]4394[/C][C]4298.01757331991[/C][C]95.9824266800888[/C][/ROW]
[ROW][C]45[/C][C]4826[/C][C]4087.762805934[/C][C]738.237194066002[/C][/ROW]
[ROW][C]46[/C][C]4409[/C][C]5158.0265806207[/C][C]-749.0265806207[/C][/ROW]
[ROW][C]47[/C][C]4569[/C][C]4303.69111136198[/C][C]265.308888638021[/C][/ROW]
[ROW][C]48[/C][C]4106[/C][C]4847.15931538226[/C][C]-741.159315382262[/C][/ROW]
[ROW][C]49[/C][C]4794[/C][C]5106.19081958986[/C][C]-312.190819589859[/C][/ROW]
[ROW][C]50[/C][C]3914[/C][C]3929.44190868129[/C][C]-15.4419086812909[/C][/ROW]
[ROW][C]51[/C][C]3793[/C][C]4220.95165934588[/C][C]-427.951659345876[/C][/ROW]
[ROW][C]52[/C][C]4405[/C][C]3932.87097618722[/C][C]472.129023812784[/C][/ROW]
[ROW][C]53[/C][C]4022[/C][C]4499.90741280991[/C][C]-477.907412809911[/C][/ROW]
[ROW][C]54[/C][C]4100[/C][C]3513.95765222796[/C][C]586.042347772044[/C][/ROW]
[ROW][C]55[/C][C]4788[/C][C]3841.21203685334[/C][C]946.787963146664[/C][/ROW]
[ROW][C]56[/C][C]3163[/C][C]4322.05319388231[/C][C]-1159.05319388231[/C][/ROW]
[ROW][C]57[/C][C]3585[/C][C]3952.21458139702[/C][C]-367.214581397021[/C][/ROW]
[ROW][C]58[/C][C]3903[/C][C]4118.40463904438[/C][C]-215.404639044376[/C][/ROW]
[ROW][C]59[/C][C]4178[/C][C]3753.28354416713[/C][C]424.716455832868[/C][/ROW]
[ROW][C]60[/C][C]3863[/C][C]3955.73717859487[/C][C]-92.7371785948667[/C][/ROW]
[ROW][C]61[/C][C]4187[/C][C]4453.2216652102[/C][C]-266.221665210201[/C][/ROW]
[/TABLE]
Source: https://freestatistics.org/blog/index.php?pk=64109&T=2

Globally Unique Identifier (entire table): ba.freestatistics.org/blog/index.php?pk=64109&T=2

As an alternative you can also use a QR Code:  

The GUIDs for individual cells are displayed in the table below:

Interpolation Forecasts of Exponential Smoothing
tObservedFittedResiduals
1355925238.68248791591353.31751208409
1441633935.51659519542227.483404804584
1549624760.32445506898201.675544931019
1652085082.53187493351125.468125066493
1747554723.3376953332531.6623046667464
1844914563.81926664071-72.8192666407149
1957325034.31493456657697.685065433434
2057315114.2942342393616.705765760701
2150405699.13295441262-659.132954412617
2261026490.97195685918-388.97195685918
2349046068.89264576003-1164.89264576003
2453696756.14632973248-1387.14632973248
2555786266.3255281321-688.3255281321
2646194415.46618587403203.533814125966
2747315237.68846193254-506.688461932541
2850115271.06423036057-260.064230360566
2952994694.2415269454604.758473054599
3041464595.25595490521-449.255954905211
3146255121.12484018266-496.124840182661
3247364753.97026089655-17.9702608965536
3342194636.08973084054-417.089730840545
3451165308.43775572016-192.437755720164
3542054660.57688175995-455.576881759947
3641215202.5094190291-1081.50941902910
3751034897.60912864472205.390871355279
3843003732.88160090191567.118399098094
3945784286.02217213461291.977827865392
4038094550.7109470601-741.710947060098
4155264099.027908271871426.97209172813
4242473922.99543678625324.004563213745
4338304590.97799967912-760.977999679119
4443944298.0175733199195.9824266800888
4548264087.762805934738.237194066002
4644095158.0265806207-749.0265806207
4745694303.69111136198265.308888638021
4841064847.15931538226-741.159315382262
4947945106.19081958986-312.190819589859
5039143929.44190868129-15.4419086812909
5137934220.95165934588-427.951659345876
5244053932.87097618722472.129023812784
5340224499.90741280991-477.907412809911
5441003513.95765222796586.042347772044
5547883841.21203685334946.787963146664
5631634322.05319388231-1159.05319388231
5735853952.21458139702-367.214581397021
5839034118.40463904438-215.404639044376
5941783753.28354416713424.716455832868
6038633955.73717859487-92.7371785948667
6141874453.2216652102-266.221665210201


Extrapolation Forecasts of Exponential Smoothing
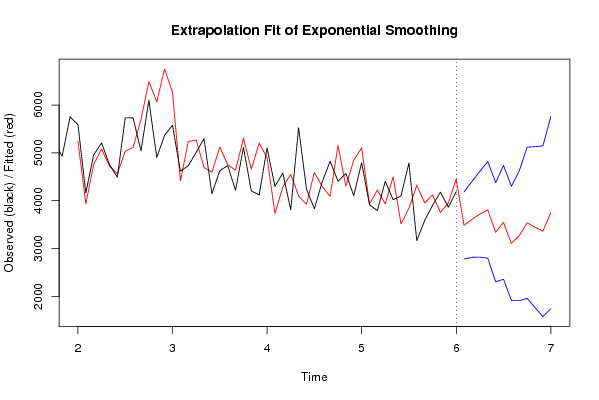
tForecast95% Lower Bound95% Upper Bound
623482.543535826332780.167490695764184.9195809569
633609.236297182112815.160587971614403.31200639261
643716.556643926342819.307735680774613.80555217191
653807.590793188252797.209215791164817.97237058534
663339.806687184322302.335469939314377.27790442934
673546.505815831742355.940785858774737.0708458047
683105.404202112951910.493794677554300.31460954835
693267.470600999931907.431750878064627.5094511218
703537.372082477471955.540695170855119.2034697841
713446.498950453901762.842195464655130.15570544316
723360.572340255231573.340921555645147.80375895481
733748.963593911271739.602993375685758.32419444687

\begin{tabular}{lllllllll}
\hline
Extrapolation Forecasts of Exponential Smoothing \tabularnewline
t & Forecast & 95% Lower Bound & 95% Upper Bound \tabularnewline
62 & 3482.54353582633 & 2780.16749069576 & 4184.9195809569 \tabularnewline
63 & 3609.23629718211 & 2815.16058797161 & 4403.31200639261 \tabularnewline
64 & 3716.55664392634 & 2819.30773568077 & 4613.80555217191 \tabularnewline
65 & 3807.59079318825 & 2797.20921579116 & 4817.97237058534 \tabularnewline
66 & 3339.80668718432 & 2302.33546993931 & 4377.27790442934 \tabularnewline
67 & 3546.50581583174 & 2355.94078585877 & 4737.0708458047 \tabularnewline
68 & 3105.40420211295 & 1910.49379467755 & 4300.31460954835 \tabularnewline
69 & 3267.47060099993 & 1907.43175087806 & 4627.5094511218 \tabularnewline
70 & 3537.37208247747 & 1955.54069517085 & 5119.2034697841 \tabularnewline
71 & 3446.49895045390 & 1762.84219546465 & 5130.15570544316 \tabularnewline
72 & 3360.57234025523 & 1573.34092155564 & 5147.80375895481 \tabularnewline
73 & 3748.96359391127 & 1739.60299337568 & 5758.32419444687 \tabularnewline
\hline
\end{tabular}
%Source: https://freestatistics.org/blog/index.php?pk=64109&T=3

[TABLE]
[ROW][C]Extrapolation Forecasts of Exponential Smoothing[/C][/ROW]
[ROW][C]t[/C][C]Forecast[/C][C]95% Lower Bound[/C][C]95% Upper Bound[/C][/ROW]
[ROW][C]62[/C][C]3482.54353582633[/C][C]2780.16749069576[/C][C]4184.9195809569[/C][/ROW]
[ROW][C]63[/C][C]3609.23629718211[/C][C]2815.16058797161[/C][C]4403.31200639261[/C][/ROW]
[ROW][C]64[/C][C]3716.55664392634[/C][C]2819.30773568077[/C][C]4613.80555217191[/C][/ROW]
[ROW][C]65[/C][C]3807.59079318825[/C][C]2797.20921579116[/C][C]4817.97237058534[/C][/ROW]
[ROW][C]66[/C][C]3339.80668718432[/C][C]2302.33546993931[/C][C]4377.27790442934[/C][/ROW]
[ROW][C]67[/C][C]3546.50581583174[/C][C]2355.94078585877[/C][C]4737.0708458047[/C][/ROW]
[ROW][C]68[/C][C]3105.40420211295[/C][C]1910.49379467755[/C][C]4300.31460954835[/C][/ROW]
[ROW][C]69[/C][C]3267.47060099993[/C][C]1907.43175087806[/C][C]4627.5094511218[/C][/ROW]
[ROW][C]70[/C][C]3537.37208247747[/C][C]1955.54069517085[/C][C]5119.2034697841[/C][/ROW]
[ROW][C]71[/C][C]3446.49895045390[/C][C]1762.84219546465[/C][C]5130.15570544316[/C][/ROW]
[ROW][C]72[/C][C]3360.57234025523[/C][C]1573.34092155564[/C][C]5147.80375895481[/C][/ROW]
[ROW][C]73[/C][C]3748.96359391127[/C][C]1739.60299337568[/C][C]5758.32419444687[/C][/ROW]
[/TABLE]
Source: https://freestatistics.org/blog/index.php?pk=64109&T=3

Globally Unique Identifier (entire table): ba.freestatistics.org/blog/index.php?pk=64109&T=3

As an alternative you can also use a QR Code:  

The GUIDs for individual cells are displayed in the table below:

Extrapolation Forecasts of Exponential Smoothing
tForecast95% Lower Bound95% Upper Bound
623482.543535826332780.167490695764184.9195809569
633609.236297182112815.160587971614403.31200639261
643716.556643926342819.307735680774613.80555217191
653807.590793188252797.209215791164817.97237058534
663339.806687184322302.335469939314377.27790442934
673546.505815831742355.940785858774737.0708458047
683105.404202112951910.493794677554300.31460954835
693267.470600999931907.431750878064627.5094511218
703537.372082477471955.540695170855119.2034697841
713446.498950453901762.842195464655130.15570544316
723360.572340255231573.340921555645147.80375895481
733748.963593911271739.602993375685758.32419444687


Parameters (Session):
par1 = 12 ;
Parameters (R input):
par1 = 12 ; par2 = Triple ; par3 = multiplicative ;
R code (references can be found in the software module):
par1 <- as.numeric(par1)
if (par2 == 'Single') K <- 1
if (par2 == 'Double') K <- 2
if (par2 == 'Triple') K <- par1
nx <- length(x)
nxmK <- nx - K
x <- ts(x, frequency = par1)
if (par2 == 'Single') fit <- HoltWinters(x, gamma=0, beta=0)
if (par2 == 'Double') fit <- HoltWinters(x, gamma=0)
if (par2 == 'Triple') fit <- HoltWinters(x, seasonal=par3)
fit
myresid <- x - fit$fitted[,'xhat']
bitmap(file='test1.png')
op <- par(mfrow=c(2,1))
plot(fit,ylab='Observed (black) / Fitted (red)',main='Interpolation Fit of Exponential Smoothing')
plot(myresid,ylab='Residuals',main='Interpolation Prediction Errors')
par(op)
dev.off()
bitmap(file='test2.png')
p <- predict(fit, par1, prediction.interval=TRUE)
np <- length(p[,1])
plot(fit,p,ylab='Observed (black) / Fitted (red)',main='Extrapolation Fit of Exponential Smoothing')
dev.off()
bitmap(file='test3.png')
op <- par(mfrow = c(2,2))
acf(as.numeric(myresid),lag.max = nx/2,main='Residual ACF')
spectrum(myresid,main='Residals Periodogram')
cpgram(myresid,main='Residal Cumulative Periodogram')
qqnorm(myresid,main='Residual Normal QQ Plot')
qqline(myresid)
par(op)
dev.off()
load(file='createtable')
a<-table.start()
a<-table.row.start(a)
a<-table.element(a,'Estimated Parameters of Exponential Smoothing',2,TRUE)
a<-table.row.end(a)
a<-table.row.start(a)
a<-table.element(a,'Parameter',header=TRUE)
a<-table.element(a,'Value',header=TRUE)
a<-table.row.end(a)
a<-table.row.start(a)
a<-table.element(a,'alpha',header=TRUE)
a<-table.element(a,fit$alpha)
a<-table.row.end(a)
a<-table.row.start(a)
a<-table.element(a,'beta',header=TRUE)
a<-table.element(a,fit$beta)
a<-table.row.end(a)
a<-table.row.start(a)
a<-table.element(a,'gamma',header=TRUE)
a<-table.element(a,fit$gamma)
a<-table.row.end(a)
a<-table.end(a)
table.save(a,file='mytable.tab')
a<-table.start()
a<-table.row.start(a)
a<-table.element(a,'Interpolation Forecasts of Exponential Smoothing',4,TRUE)
a<-table.row.end(a)
a<-table.row.start(a)
a<-table.element(a,'t',header=TRUE)
a<-table.element(a,'Observed',header=TRUE)
a<-table.element(a,'Fitted',header=TRUE)
a<-table.element(a,'Residuals',header=TRUE)
a<-table.row.end(a)
for (i in 1:nxmK) {
a<-table.row.start(a)
a<-table.element(a,i+K,header=TRUE)
a<-table.element(a,x[i+K])
a<-table.element(a,fit$fitted[i,'xhat'])
a<-table.element(a,myresid[i])
a<-table.row.end(a)
}
a<-table.end(a)
table.save(a,file='mytable1.tab')
a<-table.start()
a<-table.row.start(a)
a<-table.element(a,'Extrapolation Forecasts of Exponential Smoothing',4,TRUE)
a<-table.row.end(a)
a<-table.row.start(a)
a<-table.element(a,'t',header=TRUE)
a<-table.element(a,'Forecast',header=TRUE)
a<-table.element(a,'95% Lower Bound',header=TRUE)
a<-table.element(a,'95% Upper Bound',header=TRUE)
a<-table.row.end(a)
for (i in 1:np) {
a<-table.row.start(a)
a<-table.element(a,nx+i,header=TRUE)
a<-table.element(a,p[i,'fit'])
a<-table.element(a,p[i,'lwr'])
a<-table.element(a,p[i,'upr'])
a<-table.row.end(a)
}
a<-table.end(a)
table.save(a,file='mytable2.tab')