Free Statistics

of Irreproducible Research!

Author's title

Author*The author of this computation has been verified*
R Software Modulerwasp_arimabackwardselection.wasp
Title produced by softwareARIMA Backward Selection
Date of computationFri, 04 Dec 2009 14:16:32 -0700
Cite this page as followsStatistical Computations at FreeStatistics.org, Office for Research Development and Education, URL https://freestatistics.org/blog/index.php?v=date/2009/Dec/04/t1259961439rv4gutphrp32tmp.htm/, Retrieved Sun, 28 Apr 2024 08:09:03 +0000
Statistical Computations at FreeStatistics.org, Office for Research Development and Education, URL https://freestatistics.org/blog/index.php?pk=64157, Retrieved Sun, 28 Apr 2024 08:09:03 +0000
QR Codes:

Original text written by user:
IsPrivate?No (this computation is public)
User-defined keywords
Estimated Impact141
Family? (F = Feedback message, R = changed R code, M = changed R Module, P = changed Parameters, D = changed Data)
-     [Univariate Data Series] [data set] [2008-12-01 19:54:57] [b98453cac15ba1066b407e146608df68]
- RMP   [ARIMA Backward Selection] [] [2009-11-27 14:53:14] [b98453cac15ba1066b407e146608df68]
-   PD    [ARIMA Backward Selection] [WS9] [2009-12-03 23:50:09] [37a8d600db9abe09a2528d150ccff095]
-   PD        [ARIMA Backward Selection] [] [2009-12-04 21:16:32] [d41d8cd98f00b204e9800998ecf8427e] [Current]
-               [ARIMA Backward Selection] [] [2009-12-07 17:23:36] [3af9fa3d2c04a43d660a9a466bdfbaa0]
Feedback Forum

Post a new message
Dataseries X:
267413
267366
264777
258863
254844
254868
277267
285351
286602
283042
276687
277915
277128
277103
275037
270150
267140
264993
287259
291186
292300
288186
281477
282656
280190
280408
276836
275216
274352
271311
289802
290726
292300
278506
269826
265861
269034
264176
255198
253353
246057
235372
258556
260993
254663
250643
243422
247105
248541
245039
237080
237085
225554
226839
247934
248333
246969
245098
246263
255765
264319
268347
273046
273963
267430
271993
292710


Summary of computational transaction
Raw Inputview raw input (R code)
Raw Outputview raw output of R engine
Computing time10 seconds
R Server'Gwilym Jenkins' @ 72.249.127.135

\begin{tabular}{lllllllll}
\hline
Summary of computational transaction \tabularnewline
Raw Input & view raw input (R code)  \tabularnewline
Raw Output & view raw output of R engine  \tabularnewline
Computing time & 10 seconds \tabularnewline
R Server & 'Gwilym Jenkins' @ 72.249.127.135 \tabularnewline
\hline
\end{tabular}
%Source: https://freestatistics.org/blog/index.php?pk=64157&T=0

[TABLE]
[ROW][C]Summary of computational transaction[/C][/ROW]
[ROW][C]Raw Input[/C][C]view raw input (R code) [/C][/ROW]
[ROW][C]Raw Output[/C][C]view raw output of R engine [/C][/ROW]
[ROW][C]Computing time[/C][C]10 seconds[/C][/ROW]
[ROW][C]R Server[/C][C]'Gwilym Jenkins' @ 72.249.127.135[/C][/ROW]
[/TABLE]
Source: https://freestatistics.org/blog/index.php?pk=64157&T=0

Globally Unique Identifier (entire table): ba.freestatistics.org/blog/index.php?pk=64157&T=0

As an alternative you can also use a QR Code:  

The GUIDs for individual cells are displayed in the table below:

Summary of computational transaction
Raw Inputview raw input (R code)
Raw Outputview raw output of R engine
Computing time10 seconds
R Server'Gwilym Jenkins' @ 72.249.127.135


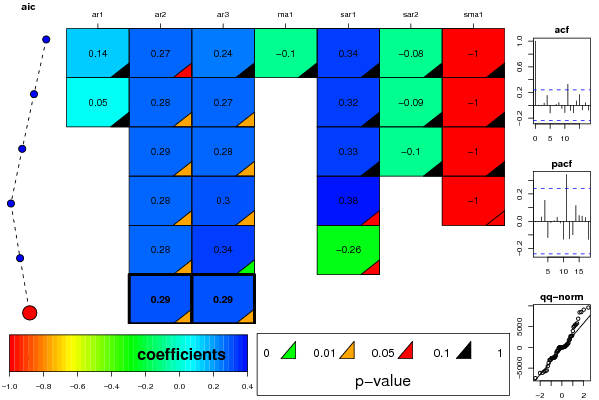
ARIMA Parameter Estimation and Backward Selection
Iterationar1ar2ar3ma1sar1sar2sma1
Estimates ( 1 )0.14430.26520.2438-0.10180.3378-0.0824-0.9984
(p-val)(0.697 )(0.0562 )(0.1713 )(0.785 )(0.1322 )(0.7074 )(0.3194 )
Estimates ( 2 )0.05090.27730.270700.3247-0.093-0.9999
(p-val)(0.7005 )(0.0323 )(0.0479 )(NA )(0.1343 )(0.6643 )(0.2826 )
Estimates ( 3 )00.28590.284700.3332-0.1016-0.9998
(p-val)(NA )(0.025 )(0.0308 )(NA )(0.1259 )(0.6331 )(0.3263 )
Estimates ( 4 )00.28360.300300.38150-1
(p-val)(NA )(0.0257 )(0.0185 )(NA )(0.0563 )(NA )(0.0572 )
Estimates ( 5 )00.27870.33690-0.260600
(p-val)(NA )(0.0252 )(0.0083 )(NA )(0.0564 )(NA )(NA )
Estimates ( 6 )00.28940.28940000
(p-val)(NA )(0.0186 )(0.0188 )(NA )(NA )(NA )(NA )
Estimates ( 7 )NANANANANANANA
(p-val)(NA )(NA )(NA )(NA )(NA )(NA )(NA )
Estimates ( 8 )NANANANANANANA
(p-val)(NA )(NA )(NA )(NA )(NA )(NA )(NA )
Estimates ( 9 )NANANANANANANA
(p-val)(NA )(NA )(NA )(NA )(NA )(NA )(NA )
Estimates ( 10 )NANANANANANANA
(p-val)(NA )(NA )(NA )(NA )(NA )(NA )(NA )
Estimates ( 11 )NANANANANANANA
(p-val)(NA )(NA )(NA )(NA )(NA )(NA )(NA )
Estimates ( 12 )NANANANANANANA
(p-val)(NA )(NA )(NA )(NA )(NA )(NA )(NA )
Estimates ( 13 )NANANANANANANA
(p-val)(NA )(NA )(NA )(NA )(NA )(NA )(NA )

\begin{tabular}{lllllllll}
\hline
ARIMA Parameter Estimation and Backward Selection \tabularnewline
Iteration & ar1 & ar2 & ar3 & ma1 & sar1 & sar2 & sma1 \tabularnewline
Estimates ( 1 ) & 0.1443 & 0.2652 & 0.2438 & -0.1018 & 0.3378 & -0.0824 & -0.9984 \tabularnewline
(p-val) & (0.697 ) & (0.0562 ) & (0.1713 ) & (0.785 ) & (0.1322 ) & (0.7074 ) & (0.3194 ) \tabularnewline
Estimates ( 2 ) & 0.0509 & 0.2773 & 0.2707 & 0 & 0.3247 & -0.093 & -0.9999 \tabularnewline
(p-val) & (0.7005 ) & (0.0323 ) & (0.0479 ) & (NA ) & (0.1343 ) & (0.6643 ) & (0.2826 ) \tabularnewline
Estimates ( 3 ) & 0 & 0.2859 & 0.2847 & 0 & 0.3332 & -0.1016 & -0.9998 \tabularnewline
(p-val) & (NA ) & (0.025 ) & (0.0308 ) & (NA ) & (0.1259 ) & (0.6331 ) & (0.3263 ) \tabularnewline
Estimates ( 4 ) & 0 & 0.2836 & 0.3003 & 0 & 0.3815 & 0 & -1 \tabularnewline
(p-val) & (NA ) & (0.0257 ) & (0.0185 ) & (NA ) & (0.0563 ) & (NA ) & (0.0572 ) \tabularnewline
Estimates ( 5 ) & 0 & 0.2787 & 0.3369 & 0 & -0.2606 & 0 & 0 \tabularnewline
(p-val) & (NA ) & (0.0252 ) & (0.0083 ) & (NA ) & (0.0564 ) & (NA ) & (NA ) \tabularnewline
Estimates ( 6 ) & 0 & 0.2894 & 0.2894 & 0 & 0 & 0 & 0 \tabularnewline
(p-val) & (NA ) & (0.0186 ) & (0.0188 ) & (NA ) & (NA ) & (NA ) & (NA ) \tabularnewline
Estimates ( 7 ) & NA & NA & NA & NA & NA & NA & NA \tabularnewline
(p-val) & (NA ) & (NA ) & (NA ) & (NA ) & (NA ) & (NA ) & (NA ) \tabularnewline
Estimates ( 8 ) & NA & NA & NA & NA & NA & NA & NA \tabularnewline
(p-val) & (NA ) & (NA ) & (NA ) & (NA ) & (NA ) & (NA ) & (NA ) \tabularnewline
Estimates ( 9 ) & NA & NA & NA & NA & NA & NA & NA \tabularnewline
(p-val) & (NA ) & (NA ) & (NA ) & (NA ) & (NA ) & (NA ) & (NA ) \tabularnewline
Estimates ( 10 ) & NA & NA & NA & NA & NA & NA & NA \tabularnewline
(p-val) & (NA ) & (NA ) & (NA ) & (NA ) & (NA ) & (NA ) & (NA ) \tabularnewline
Estimates ( 11 ) & NA & NA & NA & NA & NA & NA & NA \tabularnewline
(p-val) & (NA ) & (NA ) & (NA ) & (NA ) & (NA ) & (NA ) & (NA ) \tabularnewline
Estimates ( 12 ) & NA & NA & NA & NA & NA & NA & NA \tabularnewline
(p-val) & (NA ) & (NA ) & (NA ) & (NA ) & (NA ) & (NA ) & (NA ) \tabularnewline
Estimates ( 13 ) & NA & NA & NA & NA & NA & NA & NA \tabularnewline
(p-val) & (NA ) & (NA ) & (NA ) & (NA ) & (NA ) & (NA ) & (NA ) \tabularnewline
\hline
\end{tabular}
%Source: https://freestatistics.org/blog/index.php?pk=64157&T=1

[TABLE]
[ROW][C]ARIMA Parameter Estimation and Backward Selection[/C][/ROW]
[ROW][C]Iteration[/C][C]ar1[/C][C]ar2[/C][C]ar3[/C][C]ma1[/C][C]sar1[/C][C]sar2[/C][C]sma1[/C][/ROW]
[ROW][C]Estimates ( 1 )[/C][C]0.1443[/C][C]0.2652[/C][C]0.2438[/C][C]-0.1018[/C][C]0.3378[/C][C]-0.0824[/C][C]-0.9984[/C][/ROW]
[ROW][C](p-val)[/C][C](0.697 )[/C][C](0.0562 )[/C][C](0.1713 )[/C][C](0.785 )[/C][C](0.1322 )[/C][C](0.7074 )[/C][C](0.3194 )[/C][/ROW]
[ROW][C]Estimates ( 2 )[/C][C]0.0509[/C][C]0.2773[/C][C]0.2707[/C][C]0[/C][C]0.3247[/C][C]-0.093[/C][C]-0.9999[/C][/ROW]
[ROW][C](p-val)[/C][C](0.7005 )[/C][C](0.0323 )[/C][C](0.0479 )[/C][C](NA )[/C][C](0.1343 )[/C][C](0.6643 )[/C][C](0.2826 )[/C][/ROW]
[ROW][C]Estimates ( 3 )[/C][C]0[/C][C]0.2859[/C][C]0.2847[/C][C]0[/C][C]0.3332[/C][C]-0.1016[/C][C]-0.9998[/C][/ROW]
[ROW][C](p-val)[/C][C](NA )[/C][C](0.025 )[/C][C](0.0308 )[/C][C](NA )[/C][C](0.1259 )[/C][C](0.6331 )[/C][C](0.3263 )[/C][/ROW]
[ROW][C]Estimates ( 4 )[/C][C]0[/C][C]0.2836[/C][C]0.3003[/C][C]0[/C][C]0.3815[/C][C]0[/C][C]-1[/C][/ROW]
[ROW][C](p-val)[/C][C](NA )[/C][C](0.0257 )[/C][C](0.0185 )[/C][C](NA )[/C][C](0.0563 )[/C][C](NA )[/C][C](0.0572 )[/C][/ROW]
[ROW][C]Estimates ( 5 )[/C][C]0[/C][C]0.2787[/C][C]0.3369[/C][C]0[/C][C]-0.2606[/C][C]0[/C][C]0[/C][/ROW]
[ROW][C](p-val)[/C][C](NA )[/C][C](0.0252 )[/C][C](0.0083 )[/C][C](NA )[/C][C](0.0564 )[/C][C](NA )[/C][C](NA )[/C][/ROW]
[ROW][C]Estimates ( 6 )[/C][C]0[/C][C]0.2894[/C][C]0.2894[/C][C]0[/C][C]0[/C][C]0[/C][C]0[/C][/ROW]
[ROW][C](p-val)[/C][C](NA )[/C][C](0.0186 )[/C][C](0.0188 )[/C][C](NA )[/C][C](NA )[/C][C](NA )[/C][C](NA )[/C][/ROW]
[ROW][C]Estimates ( 7 )[/C][C]NA[/C][C]NA[/C][C]NA[/C][C]NA[/C][C]NA[/C][C]NA[/C][C]NA[/C][/ROW]
[ROW][C](p-val)[/C][C](NA )[/C][C](NA )[/C][C](NA )[/C][C](NA )[/C][C](NA )[/C][C](NA )[/C][C](NA )[/C][/ROW]
[ROW][C]Estimates ( 8 )[/C][C]NA[/C][C]NA[/C][C]NA[/C][C]NA[/C][C]NA[/C][C]NA[/C][C]NA[/C][/ROW]
[ROW][C](p-val)[/C][C](NA )[/C][C](NA )[/C][C](NA )[/C][C](NA )[/C][C](NA )[/C][C](NA )[/C][C](NA )[/C][/ROW]
[ROW][C]Estimates ( 9 )[/C][C]NA[/C][C]NA[/C][C]NA[/C][C]NA[/C][C]NA[/C][C]NA[/C][C]NA[/C][/ROW]
[ROW][C](p-val)[/C][C](NA )[/C][C](NA )[/C][C](NA )[/C][C](NA )[/C][C](NA )[/C][C](NA )[/C][C](NA )[/C][/ROW]
[ROW][C]Estimates ( 10 )[/C][C]NA[/C][C]NA[/C][C]NA[/C][C]NA[/C][C]NA[/C][C]NA[/C][C]NA[/C][/ROW]
[ROW][C](p-val)[/C][C](NA )[/C][C](NA )[/C][C](NA )[/C][C](NA )[/C][C](NA )[/C][C](NA )[/C][C](NA )[/C][/ROW]
[ROW][C]Estimates ( 11 )[/C][C]NA[/C][C]NA[/C][C]NA[/C][C]NA[/C][C]NA[/C][C]NA[/C][C]NA[/C][/ROW]
[ROW][C](p-val)[/C][C](NA )[/C][C](NA )[/C][C](NA )[/C][C](NA )[/C][C](NA )[/C][C](NA )[/C][C](NA )[/C][/ROW]
[ROW][C]Estimates ( 12 )[/C][C]NA[/C][C]NA[/C][C]NA[/C][C]NA[/C][C]NA[/C][C]NA[/C][C]NA[/C][/ROW]
[ROW][C](p-val)[/C][C](NA )[/C][C](NA )[/C][C](NA )[/C][C](NA )[/C][C](NA )[/C][C](NA )[/C][C](NA )[/C][/ROW]
[ROW][C]Estimates ( 13 )[/C][C]NA[/C][C]NA[/C][C]NA[/C][C]NA[/C][C]NA[/C][C]NA[/C][C]NA[/C][/ROW]
[ROW][C](p-val)[/C][C](NA )[/C][C](NA )[/C][C](NA )[/C][C](NA )[/C][C](NA )[/C][C](NA )[/C][C](NA )[/C][/ROW]
[/TABLE]
Source: https://freestatistics.org/blog/index.php?pk=64157&T=1

Globally Unique Identifier (entire table): ba.freestatistics.org/blog/index.php?pk=64157&T=1

As an alternative you can also use a QR Code:  

The GUIDs for individual cells are displayed in the table below:

ARIMA Parameter Estimation and Backward Selection
Iterationar1ar2ar3ma1sar1sar2sma1
Estimates ( 1 )0.14430.26520.2438-0.10180.3378-0.0824-0.9984
(p-val)(0.697 )(0.0562 )(0.1713 )(0.785 )(0.1322 )(0.7074 )(0.3194 )
Estimates ( 2 )0.05090.27730.270700.3247-0.093-0.9999
(p-val)(0.7005 )(0.0323 )(0.0479 )(NA )(0.1343 )(0.6643 )(0.2826 )
Estimates ( 3 )00.28590.284700.3332-0.1016-0.9998
(p-val)(NA )(0.025 )(0.0308 )(NA )(0.1259 )(0.6331 )(0.3263 )
Estimates ( 4 )00.28360.300300.38150-1
(p-val)(NA )(0.0257 )(0.0185 )(NA )(0.0563 )(NA )(0.0572 )
Estimates ( 5 )00.27870.33690-0.260600
(p-val)(NA )(0.0252 )(0.0083 )(NA )(0.0564 )(NA )(NA )
Estimates ( 6 )00.28940.28940000
(p-val)(NA )(0.0186 )(0.0188 )(NA )(NA )(NA )(NA )
Estimates ( 7 )NANANANANANANA
(p-val)(NA )(NA )(NA )(NA )(NA )(NA )(NA )
Estimates ( 8 )NANANANANANANA
(p-val)(NA )(NA )(NA )(NA )(NA )(NA )(NA )
Estimates ( 9 )NANANANANANANA
(p-val)(NA )(NA )(NA )(NA )(NA )(NA )(NA )
Estimates ( 10 )NANANANANANANA
(p-val)(NA )(NA )(NA )(NA )(NA )(NA )(NA )
Estimates ( 11 )NANANANANANANA
(p-val)(NA )(NA )(NA )(NA )(NA )(NA )(NA )
Estimates ( 12 )NANANANANANANA
(p-val)(NA )(NA )(NA )(NA )(NA )(NA )(NA )
Estimates ( 13 )NANANANANANANA
(p-val)(NA )(NA )(NA )(NA )(NA )(NA )(NA )


Estimated ARIMA Residuals
Value
-913.737775198605
23.1096757663404
456.385648731541
889.128571736973
836.385206042615
-2533.95352697662
-719.35167446997
-3745.06373199603
613.859653253457
659.119496405595
1059.93335663275
165.153227385284
-1259.25875793442
352.916648547945
-952.712549002952
3949.62792687456
2706.88419408659
-1983.44023600318
-5671.75150480296
-4491.18740262067
1977.74056046666
-7402.19548345163
-804.84956566237
-2561.90617124258
9086.02687097775
-2880.53187045752
-5510.78885909259
271.144630465973
-2568.10406759938
-6098.18357994379
5134.60266836802
4903.82157738512
-6164.11643961637
5797.99522829894
2868.48534028214
6908.93382436188
-2973.44012233353
-2043.11546028487
-2440.32738835400
1872.19672137889
-5813.85059764123
9609.8752579018
178.04755499601
-2432.7338999834
-214.086753766809
5446.18743629832
8510.17950026123
5524.61176329784
2640.19381267409
2753.13135132188
8434.31458855555
-3048.13516086747
-2363.04153284340
1655.57706698231
-2477.35519994173

\begin{tabular}{lllllllll}
\hline
Estimated ARIMA Residuals \tabularnewline
Value \tabularnewline
-913.737775198605 \tabularnewline
23.1096757663404 \tabularnewline
456.385648731541 \tabularnewline
889.128571736973 \tabularnewline
836.385206042615 \tabularnewline
-2533.95352697662 \tabularnewline
-719.35167446997 \tabularnewline
-3745.06373199603 \tabularnewline
613.859653253457 \tabularnewline
659.119496405595 \tabularnewline
1059.93335663275 \tabularnewline
165.153227385284 \tabularnewline
-1259.25875793442 \tabularnewline
352.916648547945 \tabularnewline
-952.712549002952 \tabularnewline
3949.62792687456 \tabularnewline
2706.88419408659 \tabularnewline
-1983.44023600318 \tabularnewline
-5671.75150480296 \tabularnewline
-4491.18740262067 \tabularnewline
1977.74056046666 \tabularnewline
-7402.19548345163 \tabularnewline
-804.84956566237 \tabularnewline
-2561.90617124258 \tabularnewline
9086.02687097775 \tabularnewline
-2880.53187045752 \tabularnewline
-5510.78885909259 \tabularnewline
271.144630465973 \tabularnewline
-2568.10406759938 \tabularnewline
-6098.18357994379 \tabularnewline
5134.60266836802 \tabularnewline
4903.82157738512 \tabularnewline
-6164.11643961637 \tabularnewline
5797.99522829894 \tabularnewline
2868.48534028214 \tabularnewline
6908.93382436188 \tabularnewline
-2973.44012233353 \tabularnewline
-2043.11546028487 \tabularnewline
-2440.32738835400 \tabularnewline
1872.19672137889 \tabularnewline
-5813.85059764123 \tabularnewline
9609.8752579018 \tabularnewline
178.04755499601 \tabularnewline
-2432.7338999834 \tabularnewline
-214.086753766809 \tabularnewline
5446.18743629832 \tabularnewline
8510.17950026123 \tabularnewline
5524.61176329784 \tabularnewline
2640.19381267409 \tabularnewline
2753.13135132188 \tabularnewline
8434.31458855555 \tabularnewline
-3048.13516086747 \tabularnewline
-2363.04153284340 \tabularnewline
1655.57706698231 \tabularnewline
-2477.35519994173 \tabularnewline
\hline
\end{tabular}
%Source: https://freestatistics.org/blog/index.php?pk=64157&T=2

[TABLE]
[ROW][C]Estimated ARIMA Residuals[/C][/ROW]
[ROW][C]Value[/C][/ROW]
[ROW][C]-913.737775198605[/C][/ROW]
[ROW][C]23.1096757663404[/C][/ROW]
[ROW][C]456.385648731541[/C][/ROW]
[ROW][C]889.128571736973[/C][/ROW]
[ROW][C]836.385206042615[/C][/ROW]
[ROW][C]-2533.95352697662[/C][/ROW]
[ROW][C]-719.35167446997[/C][/ROW]
[ROW][C]-3745.06373199603[/C][/ROW]
[ROW][C]613.859653253457[/C][/ROW]
[ROW][C]659.119496405595[/C][/ROW]
[ROW][C]1059.93335663275[/C][/ROW]
[ROW][C]165.153227385284[/C][/ROW]
[ROW][C]-1259.25875793442[/C][/ROW]
[ROW][C]352.916648547945[/C][/ROW]
[ROW][C]-952.712549002952[/C][/ROW]
[ROW][C]3949.62792687456[/C][/ROW]
[ROW][C]2706.88419408659[/C][/ROW]
[ROW][C]-1983.44023600318[/C][/ROW]
[ROW][C]-5671.75150480296[/C][/ROW]
[ROW][C]-4491.18740262067[/C][/ROW]
[ROW][C]1977.74056046666[/C][/ROW]
[ROW][C]-7402.19548345163[/C][/ROW]
[ROW][C]-804.84956566237[/C][/ROW]
[ROW][C]-2561.90617124258[/C][/ROW]
[ROW][C]9086.02687097775[/C][/ROW]
[ROW][C]-2880.53187045752[/C][/ROW]
[ROW][C]-5510.78885909259[/C][/ROW]
[ROW][C]271.144630465973[/C][/ROW]
[ROW][C]-2568.10406759938[/C][/ROW]
[ROW][C]-6098.18357994379[/C][/ROW]
[ROW][C]5134.60266836802[/C][/ROW]
[ROW][C]4903.82157738512[/C][/ROW]
[ROW][C]-6164.11643961637[/C][/ROW]
[ROW][C]5797.99522829894[/C][/ROW]
[ROW][C]2868.48534028214[/C][/ROW]
[ROW][C]6908.93382436188[/C][/ROW]
[ROW][C]-2973.44012233353[/C][/ROW]
[ROW][C]-2043.11546028487[/C][/ROW]
[ROW][C]-2440.32738835400[/C][/ROW]
[ROW][C]1872.19672137889[/C][/ROW]
[ROW][C]-5813.85059764123[/C][/ROW]
[ROW][C]9609.8752579018[/C][/ROW]
[ROW][C]178.04755499601[/C][/ROW]
[ROW][C]-2432.7338999834[/C][/ROW]
[ROW][C]-214.086753766809[/C][/ROW]
[ROW][C]5446.18743629832[/C][/ROW]
[ROW][C]8510.17950026123[/C][/ROW]
[ROW][C]5524.61176329784[/C][/ROW]
[ROW][C]2640.19381267409[/C][/ROW]
[ROW][C]2753.13135132188[/C][/ROW]
[ROW][C]8434.31458855555[/C][/ROW]
[ROW][C]-3048.13516086747[/C][/ROW]
[ROW][C]-2363.04153284340[/C][/ROW]
[ROW][C]1655.57706698231[/C][/ROW]
[ROW][C]-2477.35519994173[/C][/ROW]
[/TABLE]
Source: https://freestatistics.org/blog/index.php?pk=64157&T=2

Globally Unique Identifier (entire table): ba.freestatistics.org/blog/index.php?pk=64157&T=2

As an alternative you can also use a QR Code:  

The GUIDs for individual cells are displayed in the table below:

Estimated ARIMA Residuals
Value
-913.737775198605
23.1096757663404
456.385648731541
889.128571736973
836.385206042615
-2533.95352697662
-719.35167446997
-3745.06373199603
613.859653253457
659.119496405595
1059.93335663275
165.153227385284
-1259.25875793442
352.916648547945
-952.712549002952
3949.62792687456
2706.88419408659
-1983.44023600318
-5671.75150480296
-4491.18740262067
1977.74056046666
-7402.19548345163
-804.84956566237
-2561.90617124258
9086.02687097775
-2880.53187045752
-5510.78885909259
271.144630465973
-2568.10406759938
-6098.18357994379
5134.60266836802
4903.82157738512
-6164.11643961637
5797.99522829894
2868.48534028214
6908.93382436188
-2973.44012233353
-2043.11546028487
-2440.32738835400
1872.19672137889
-5813.85059764123
9609.8752579018
178.04755499601
-2432.7338999834
-214.086753766809
5446.18743629832
8510.17950026123
5524.61176329784
2640.19381267409
2753.13135132188
8434.31458855555
-3048.13516086747
-2363.04153284340
1655.57706698231
-2477.35519994173


Parameters (Session):
par1 = FALSE ; par2 = 1.0 ; par3 = 1 ; par4 = 1 ; par5 = 12 ; par6 = 3 ; par7 = 1 ; par8 = 2 ; par9 = 1 ;
Parameters (R input):
par1 = FALSE ; par2 = 1.0 ; par3 = 1 ; par4 = 1 ; par5 = 12 ; par6 = 3 ; par7 = 1 ; par8 = 2 ; par9 = 1 ;
R code (references can be found in the software module):
library(lattice)
if (par1 == 'TRUE') par1 <- TRUE
if (par1 == 'FALSE') par1 <- FALSE
par2 <- as.numeric(par2) #Box-Cox lambda transformation parameter
par3 <- as.numeric(par3) #degree of non-seasonal differencing
par4 <- as.numeric(par4) #degree of seasonal differencing
par5 <- as.numeric(par5) #seasonal period
par6 <- as.numeric(par6) #degree (p) of the non-seasonal AR(p) polynomial
par7 <- as.numeric(par7) #degree (q) of the non-seasonal MA(q) polynomial
par8 <- as.numeric(par8) #degree (P) of the seasonal AR(P) polynomial
par9 <- as.numeric(par9) #degree (Q) of the seasonal MA(Q) polynomial
armaGR <- function(arima.out, names, n){
try1 <- arima.out$coef
try2 <- sqrt(diag(arima.out$var.coef))
try.data.frame <- data.frame(matrix(NA,ncol=4,nrow=length(names)))
dimnames(try.data.frame) <- list(names,c('coef','std','tstat','pv'))
try.data.frame[,1] <- try1
for(i in 1:length(try2)) try.data.frame[which(rownames(try.data.frame)==names(try2)[i]),2] <- try2[i]
try.data.frame[,3] <- try.data.frame[,1] / try.data.frame[,2]
try.data.frame[,4] <- round((1-pt(abs(try.data.frame[,3]),df=n-(length(try2)+1)))*2,5)
vector <- rep(NA,length(names))
vector[is.na(try.data.frame[,4])] <- 0
maxi <- which.max(try.data.frame[,4])
continue <- max(try.data.frame[,4],na.rm=TRUE) > .05
vector[maxi] <- 0
list(summary=try.data.frame,next.vector=vector,continue=continue)
}
arimaSelect <- function(series, order=c(13,0,0), seasonal=list(order=c(2,0,0),period=12), include.mean=F){
nrc <- order[1]+order[3]+seasonal$order[1]+seasonal$order[3]
coeff <- matrix(NA, nrow=nrc*2, ncol=nrc)
pval <- matrix(NA, nrow=nrc*2, ncol=nrc)
mylist <- rep(list(NULL), nrc)
names <- NULL
if(order[1] > 0) names <- paste('ar',1:order[1],sep='')
if(order[3] > 0) names <- c( names , paste('ma',1:order[3],sep='') )
if(seasonal$order[1] > 0) names <- c(names, paste('sar',1:seasonal$order[1],sep=''))
if(seasonal$order[3] > 0) names <- c(names, paste('sma',1:seasonal$order[3],sep=''))
arima.out <- arima(series, order=order, seasonal=seasonal, include.mean=include.mean, method='ML')
mylist[[1]] <- arima.out
last.arma <- armaGR(arima.out, names, length(series))
mystop <- FALSE
i <- 1
coeff[i,] <- last.arma[[1]][,1]
pval [i,] <- last.arma[[1]][,4]
i <- 2
aic <- arima.out$aic
while(!mystop){
mylist[[i]] <- arima.out
arima.out <- arima(series, order=order, seasonal=seasonal, include.mean=include.mean, method='ML', fixed=last.arma$next.vector)
aic <- c(aic, arima.out$aic)
last.arma <- armaGR(arima.out, names, length(series))
mystop <- !last.arma$continue
coeff[i,] <- last.arma[[1]][,1]
pval [i,] <- last.arma[[1]][,4]
i <- i+1
}
list(coeff, pval, mylist, aic=aic)
}
arimaSelectplot <- function(arimaSelect.out,noms,choix){
noms <- names(arimaSelect.out[[3]][[1]]$coef)
coeff <- arimaSelect.out[[1]]
k <- min(which(is.na(coeff[,1])))-1
coeff <- coeff[1:k,]
pval <- arimaSelect.out[[2]][1:k,]
aic <- arimaSelect.out$aic[1:k]
coeff[coeff==0] <- NA
n <- ncol(coeff)
if(missing(choix)) choix <- k
layout(matrix(c(1,1,1,2,
3,3,3,2,
3,3,3,4,
5,6,7,7),nr=4),
widths=c(10,35,45,15),
heights=c(30,30,15,15))
couleurs <- rainbow(75)[1:50]#(50)
ticks <- pretty(coeff)
par(mar=c(1,1,3,1))
plot(aic,k:1-.5,type='o',pch=21,bg='blue',cex=2,axes=F,lty=2,xpd=NA)
points(aic[choix],k-choix+.5,pch=21,cex=4,bg=2,xpd=NA)
title('aic',line=2)
par(mar=c(3,0,0,0))
plot(0,axes=F,xlab='',ylab='',xlim=range(ticks),ylim=c(.1,1))
rect(xleft = min(ticks) + (0:49)/50*(max(ticks)-min(ticks)),
xright = min(ticks) + (1:50)/50*(max(ticks)-min(ticks)),
ytop = rep(1,50),
ybottom= rep(0,50),col=couleurs,border=NA)
axis(1,ticks)
rect(xleft=min(ticks),xright=max(ticks),ytop=1,ybottom=0)
text(mean(coeff,na.rm=T),.5,'coefficients',cex=2,font=2)
par(mar=c(1,1,3,1))
image(1:n,1:k,t(coeff[k:1,]),axes=F,col=couleurs,zlim=range(ticks))
for(i in 1:n) for(j in 1:k) if(!is.na(coeff[j,i])) {
if(pval[j,i]<.01) symb = 'green'
else if( (pval[j,i]<.05) & (pval[j,i]>=.01)) symb = 'orange'
else if( (pval[j,i]<.1) & (pval[j,i]>=.05)) symb = 'red'
else symb = 'black'
polygon(c(i+.5 ,i+.2 ,i+.5 ,i+.5),
c(k-j+0.5,k-j+0.5,k-j+0.8,k-j+0.5),
col=symb)
if(j==choix) {
rect(xleft=i-.5,
xright=i+.5,
ybottom=k-j+1.5,
ytop=k-j+.5,
lwd=4)
text(i,
k-j+1,
round(coeff[j,i],2),
cex=1.2,
font=2)
}
else{
rect(xleft=i-.5,xright=i+.5,ybottom=k-j+1.5,ytop=k-j+.5)
text(i,k-j+1,round(coeff[j,i],2),cex=1.2,font=1)
}
}
axis(3,1:n,noms)
par(mar=c(0.5,0,0,0.5))
plot(0,axes=F,xlab='',ylab='',type='n',xlim=c(0,8),ylim=c(-.2,.8))
cols <- c('green','orange','red','black')
niv <- c('0','0.01','0.05','0.1')
for(i in 0:3){
polygon(c(1+2*i ,1+2*i ,1+2*i-.5 ,1+2*i),
c(.4 ,.7 , .4 , .4),
col=cols[i+1])
text(2*i,0.5,niv[i+1],cex=1.5)
}
text(8,.5,1,cex=1.5)
text(4,0,'p-value',cex=2)
box()
residus <- arimaSelect.out[[3]][[choix]]$res
par(mar=c(1,2,4,1))
acf(residus,main='')
title('acf',line=.5)
par(mar=c(1,2,4,1))
pacf(residus,main='')
title('pacf',line=.5)
par(mar=c(2,2,4,1))
qqnorm(residus,main='')
title('qq-norm',line=.5)
qqline(residus)
residus
}
if (par2 == 0) x <- log(x)
if (par2 != 0) x <- x^par2
(selection <- arimaSelect(x, order=c(par6,par3,par7), seasonal=list(order=c(par8,par4,par9), period=par5)))
bitmap(file='test1.png')
resid <- arimaSelectplot(selection)
dev.off()
resid
bitmap(file='test2.png')
acf(resid,length(resid)/2, main='Residual Autocorrelation Function')
dev.off()
bitmap(file='test3.png')
pacf(resid,length(resid)/2, main='Residual Partial Autocorrelation Function')
dev.off()
bitmap(file='test4.png')
cpgram(resid, main='Residual Cumulative Periodogram')
dev.off()
bitmap(file='test5.png')
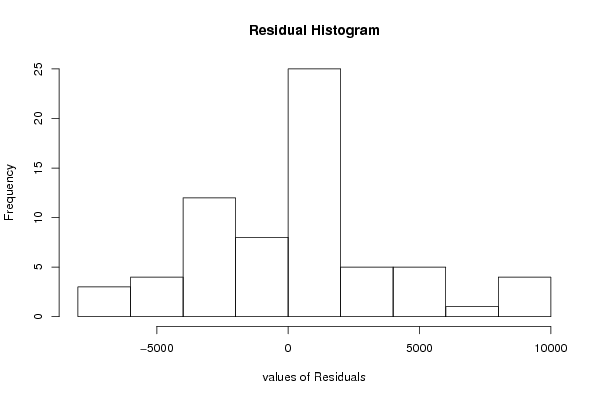
hist(resid, main='Residual Histogram', xlab='values of Residuals')
dev.off()
bitmap(file='test6.png')
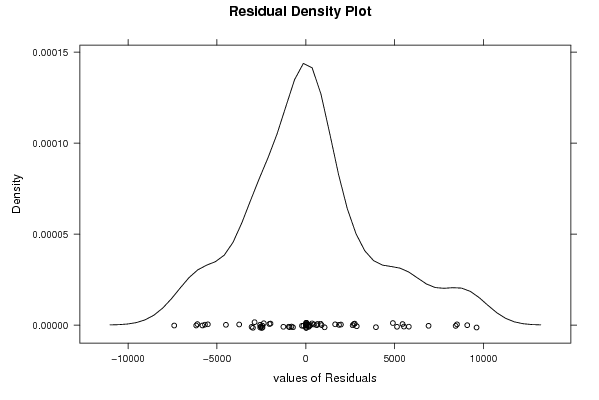
densityplot(~resid,col='black',main='Residual Density Plot', xlab='values of Residuals')
dev.off()
bitmap(file='test7.png')
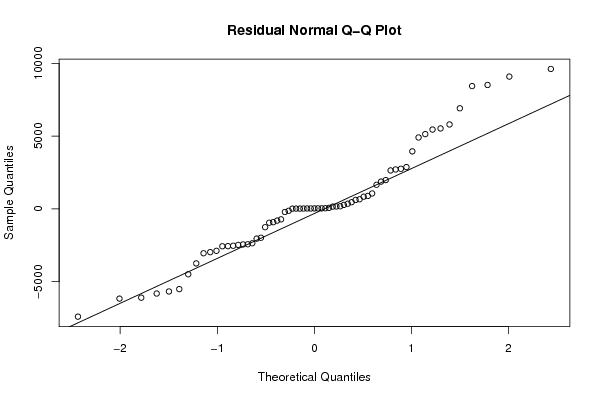
qqnorm(resid, main='Residual Normal Q-Q Plot')
qqline(resid)
dev.off()
ncols <- length(selection[[1]][1,])
nrows <- length(selection[[2]][,1])-1
load(file='createtable')
a<-table.start()
a<-table.row.start(a)
a<-table.element(a,'ARIMA Parameter Estimation and Backward Selection', ncols+1,TRUE)
a<-table.row.end(a)
a<-table.row.start(a)
a<-table.element(a,'Iteration', header=TRUE)
for (i in 1:ncols) {
a<-table.element(a,names(selection[[3]][[1]]$coef)[i],header=TRUE)
}
a<-table.row.end(a)
for (j in 1:nrows) {
a<-table.row.start(a)
mydum <- 'Estimates ('
mydum <- paste(mydum,j)
mydum <- paste(mydum,')')
a<-table.element(a,mydum, header=TRUE)
for (i in 1:ncols) {
a<-table.element(a,round(selection[[1]][j,i],4))
}
a<-table.row.end(a)
a<-table.row.start(a)
a<-table.element(a,'(p-val)', header=TRUE)
for (i in 1:ncols) {
mydum <- '('
mydum <- paste(mydum,round(selection[[2]][j,i],4),sep='')
mydum <- paste(mydum,')')
a<-table.element(a,mydum)
}
a<-table.row.end(a)
}
a<-table.end(a)
table.save(a,file='mytable.tab')
a<-table.start()
a<-table.row.start(a)
a<-table.element(a,'Estimated ARIMA Residuals', 1,TRUE)
a<-table.row.end(a)
a<-table.row.start(a)
a<-table.element(a,'Value', 1,TRUE)
a<-table.row.end(a)
for (i in (par4*par5+par3):length(resid)) {
a<-table.row.start(a)
a<-table.element(a,resid[i])
a<-table.row.end(a)
}
a<-table.end(a)
table.save(a,file='mytable1.tab')