Free Statistics

of Irreproducible Research!

Author's title

Author*The author of this computation has been verified*
R Software Modulerwasp_exponentialsmoothing.wasp
Title produced by softwareExponential Smoothing
Date of computationFri, 04 Dec 2009 15:02:01 -0700
Cite this page as followsStatistical Computations at FreeStatistics.org, Office for Research Development and Education, URL https://freestatistics.org/blog/index.php?v=date/2009/Dec/04/t1259964169fhojr0gzp9htonp.htm/, Retrieved Sun, 28 Apr 2024 18:00:50 +0000
Statistical Computations at FreeStatistics.org, Office for Research Development and Education, URL https://freestatistics.org/blog/index.php?pk=64181, Retrieved Sun, 28 Apr 2024 18:00:50 +0000
QR Codes:

Original text written by user:
IsPrivate?No (this computation is public)
User-defined keywords
Estimated Impact74
Family? (F = Feedback message, R = changed R code, M = changed R Module, P = changed Parameters, D = changed Data)
-     [Univariate Data Series] [data set] [2008-12-01 19:54:57] [b98453cac15ba1066b407e146608df68]
- RMP   [Exponential Smoothing] [] [2009-11-27 15:04:36] [b98453cac15ba1066b407e146608df68]
-   PD      [Exponential Smoothing] [] [2009-12-04 22:02:01] [d41d8cd98f00b204e9800998ecf8427e] [Current]
Feedback Forum

Post a new message
Dataseries X:
267413
267366
264777
258863
254844
254868
277267
285351
286602
283042
276687
277915
277128
277103
275037
270150
267140
264993
287259
291186
292300
288186
281477
282656
280190
280408
276836
275216
274352
271311
289802
290726
292300
278506
269826
265861
269034
264176
255198
253353
246057
235372
258556
260993
254663
250643
243422
247105
248541
245039
237080
237085
225554
226839
247934
248333
246969
245098
246263
255765
264319
268347
273046
273963
267430
271993
292710


Summary of computational transaction
Raw Inputview raw input (R code)
Raw Outputview raw output of R engine
Computing time1 seconds
R Server'Gwilym Jenkins' @ 72.249.127.135

\begin{tabular}{lllllllll}
\hline
Summary of computational transaction \tabularnewline
Raw Input & view raw input (R code)  \tabularnewline
Raw Output & view raw output of R engine  \tabularnewline
Computing time & 1 seconds \tabularnewline
R Server & 'Gwilym Jenkins' @ 72.249.127.135 \tabularnewline
\hline
\end{tabular}
%Source: https://freestatistics.org/blog/index.php?pk=64181&T=0

[TABLE]
[ROW][C]Summary of computational transaction[/C][/ROW]
[ROW][C]Raw Input[/C][C]view raw input (R code) [/C][/ROW]
[ROW][C]Raw Output[/C][C]view raw output of R engine [/C][/ROW]
[ROW][C]Computing time[/C][C]1 seconds[/C][/ROW]
[ROW][C]R Server[/C][C]'Gwilym Jenkins' @ 72.249.127.135[/C][/ROW]
[/TABLE]
Source: https://freestatistics.org/blog/index.php?pk=64181&T=0

Globally Unique Identifier (entire table): ba.freestatistics.org/blog/index.php?pk=64181&T=0

As an alternative you can also use a QR Code:  

The GUIDs for individual cells are displayed in the table below:

Summary of computational transaction
Raw Inputview raw input (R code)
Raw Outputview raw output of R engine
Computing time1 seconds
R Server'Gwilym Jenkins' @ 72.249.127.135


Estimated Parameters of Exponential Smoothing
ParameterValue
alpha0.817997700945157
beta0.2933998653243
gamma1

\begin{tabular}{lllllllll}
\hline
Estimated Parameters of Exponential Smoothing \tabularnewline
Parameter & Value \tabularnewline
alpha & 0.817997700945157 \tabularnewline
beta & 0.2933998653243 \tabularnewline
gamma & 1 \tabularnewline
\hline
\end{tabular}
%Source: https://freestatistics.org/blog/index.php?pk=64181&T=1

[TABLE]
[ROW][C]Estimated Parameters of Exponential Smoothing[/C][/ROW]
[ROW][C]Parameter[/C][C]Value[/C][/ROW]
[ROW][C]alpha[/C][C]0.817997700945157[/C][/ROW]
[ROW][C]beta[/C][C]0.2933998653243[/C][/ROW]
[ROW][C]gamma[/C][C]1[/C][/ROW]
[/TABLE]
Source: https://freestatistics.org/blog/index.php?pk=64181&T=1

Globally Unique Identifier (entire table): ba.freestatistics.org/blog/index.php?pk=64181&T=1

As an alternative you can also use a QR Code:  

The GUIDs for individual cells are displayed in the table below:

Estimated Parameters of Exponential Smoothing
ParameterValue
alpha0.817997700945157
beta0.2933998653243
gamma1


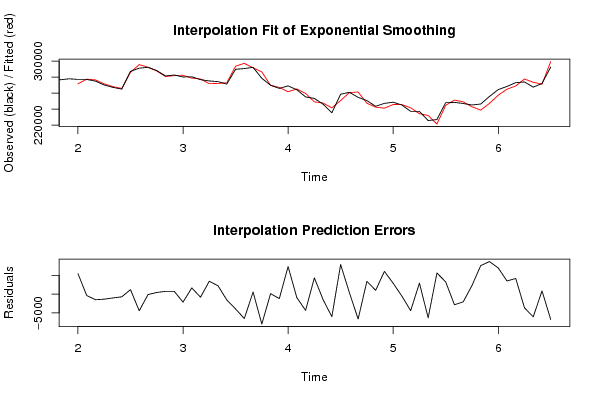
Interpolation Forecasts of Exponential Smoothing
tObservedFittedResiduals
13277128271656.5667843645471.43321563635
14277103277483.788053612-380.788053612225
15275037276553.613661103-1516.61366110318
16270150271511.576976334-1361.57697633351
17267140268175.396332338-1035.39633233793
18264993265732.685660588-739.685660588148
19287259286079.6151269111179.38487308915
20291186295655.565841303-4469.5658413028
21292300292433.771377636-133.771377635538
22288186287763.92774633422.072253669729
23281477280748.888588171728.111411829479
24282656281926.243210006729.756789993553
25280190282346.697498893-2156.69749889342
26280408278761.3289735491646.67102645116
27276836277668.427284065-832.427284064761
28275216271783.4402575123432.55974248797
29274352272133.6340297342218.36597026634
30271311272879.819984581-1568.81998458074
31289802293771.524433044-3969.52443304373
32290726297279.034802464-6553.03480246372
33292300291744.672675449555.327324550657
34278506286525.052894788-8019.05289478751
35269826269713.726168638112.273831362312
36265861267065.386140095-1204.38614009455
37269034261685.8103451507348.18965484964
38264176265141.794784438-965.79478443833
39255198259569.594797295-4371.59479729534
40253353249026.6296386814326.37036131855
41246057247553.975029949-1496.97502994936
42235372241419.486961528-6047.48696152825
43258556250662.0588808397893.94111916143
44260993260602.285217713390.714782287367
45254663261345.786985552-6682.78698555156
46250643247233.4127755763409.58722442359
47243422242422.728102639999.271897361235
48247105241055.1893029886049.81069701244
49248541245647.2751026112893.72489738924
50245039245597.160985660-558.160985659604
51237080241521.353677640-4441.35367764029
52237085234165.8457037552919.15429624481
53225554231904.378028072-6350.37802807221
54226839221211.2471155665627.75288443358
55247934244678.0633786763255.93662132375
56248333251193.551635975-2860.55163597505
57246969249053.926249261-2084.92624926139
58245098242829.3704557772268.62954422287
59246263238657.0072078827605.99279211755
60255765247073.5615268918691.43847310918
61264319257344.1304799846974.86952001599
62268347264849.489066553497.51093345019
63273046268880.7926605294165.2073394715
64273963277647.422362721-3684.42236272106
65267430273522.624539900-6092.62453989964
66271993271145.436523605847.563476394978
67292710299532.470696924-6822.47069692361

\begin{tabular}{lllllllll}
\hline
Interpolation Forecasts of Exponential Smoothing \tabularnewline
t & Observed & Fitted & Residuals \tabularnewline
13 & 277128 & 271656.566784364 & 5471.43321563635 \tabularnewline
14 & 277103 & 277483.788053612 & -380.788053612225 \tabularnewline
15 & 275037 & 276553.613661103 & -1516.61366110318 \tabularnewline
16 & 270150 & 271511.576976334 & -1361.57697633351 \tabularnewline
17 & 267140 & 268175.396332338 & -1035.39633233793 \tabularnewline
18 & 264993 & 265732.685660588 & -739.685660588148 \tabularnewline
19 & 287259 & 286079.615126911 & 1179.38487308915 \tabularnewline
20 & 291186 & 295655.565841303 & -4469.5658413028 \tabularnewline
21 & 292300 & 292433.771377636 & -133.771377635538 \tabularnewline
22 & 288186 & 287763.92774633 & 422.072253669729 \tabularnewline
23 & 281477 & 280748.888588171 & 728.111411829479 \tabularnewline
24 & 282656 & 281926.243210006 & 729.756789993553 \tabularnewline
25 & 280190 & 282346.697498893 & -2156.69749889342 \tabularnewline
26 & 280408 & 278761.328973549 & 1646.67102645116 \tabularnewline
27 & 276836 & 277668.427284065 & -832.427284064761 \tabularnewline
28 & 275216 & 271783.440257512 & 3432.55974248797 \tabularnewline
29 & 274352 & 272133.634029734 & 2218.36597026634 \tabularnewline
30 & 271311 & 272879.819984581 & -1568.81998458074 \tabularnewline
31 & 289802 & 293771.524433044 & -3969.52443304373 \tabularnewline
32 & 290726 & 297279.034802464 & -6553.03480246372 \tabularnewline
33 & 292300 & 291744.672675449 & 555.327324550657 \tabularnewline
34 & 278506 & 286525.052894788 & -8019.05289478751 \tabularnewline
35 & 269826 & 269713.726168638 & 112.273831362312 \tabularnewline
36 & 265861 & 267065.386140095 & -1204.38614009455 \tabularnewline
37 & 269034 & 261685.810345150 & 7348.18965484964 \tabularnewline
38 & 264176 & 265141.794784438 & -965.79478443833 \tabularnewline
39 & 255198 & 259569.594797295 & -4371.59479729534 \tabularnewline
40 & 253353 & 249026.629638681 & 4326.37036131855 \tabularnewline
41 & 246057 & 247553.975029949 & -1496.97502994936 \tabularnewline
42 & 235372 & 241419.486961528 & -6047.48696152825 \tabularnewline
43 & 258556 & 250662.058880839 & 7893.94111916143 \tabularnewline
44 & 260993 & 260602.285217713 & 390.714782287367 \tabularnewline
45 & 254663 & 261345.786985552 & -6682.78698555156 \tabularnewline
46 & 250643 & 247233.412775576 & 3409.58722442359 \tabularnewline
47 & 243422 & 242422.728102639 & 999.271897361235 \tabularnewline
48 & 247105 & 241055.189302988 & 6049.81069701244 \tabularnewline
49 & 248541 & 245647.275102611 & 2893.72489738924 \tabularnewline
50 & 245039 & 245597.160985660 & -558.160985659604 \tabularnewline
51 & 237080 & 241521.353677640 & -4441.35367764029 \tabularnewline
52 & 237085 & 234165.845703755 & 2919.15429624481 \tabularnewline
53 & 225554 & 231904.378028072 & -6350.37802807221 \tabularnewline
54 & 226839 & 221211.247115566 & 5627.75288443358 \tabularnewline
55 & 247934 & 244678.063378676 & 3255.93662132375 \tabularnewline
56 & 248333 & 251193.551635975 & -2860.55163597505 \tabularnewline
57 & 246969 & 249053.926249261 & -2084.92624926139 \tabularnewline
58 & 245098 & 242829.370455777 & 2268.62954422287 \tabularnewline
59 & 246263 & 238657.007207882 & 7605.99279211755 \tabularnewline
60 & 255765 & 247073.561526891 & 8691.43847310918 \tabularnewline
61 & 264319 & 257344.130479984 & 6974.86952001599 \tabularnewline
62 & 268347 & 264849.48906655 & 3497.51093345019 \tabularnewline
63 & 273046 & 268880.792660529 & 4165.2073394715 \tabularnewline
64 & 273963 & 277647.422362721 & -3684.42236272106 \tabularnewline
65 & 267430 & 273522.624539900 & -6092.62453989964 \tabularnewline
66 & 271993 & 271145.436523605 & 847.563476394978 \tabularnewline
67 & 292710 & 299532.470696924 & -6822.47069692361 \tabularnewline
\hline
\end{tabular}
%Source: https://freestatistics.org/blog/index.php?pk=64181&T=2

[TABLE]
[ROW][C]Interpolation Forecasts of Exponential Smoothing[/C][/ROW]
[ROW][C]t[/C][C]Observed[/C][C]Fitted[/C][C]Residuals[/C][/ROW]
[ROW][C]13[/C][C]277128[/C][C]271656.566784364[/C][C]5471.43321563635[/C][/ROW]
[ROW][C]14[/C][C]277103[/C][C]277483.788053612[/C][C]-380.788053612225[/C][/ROW]
[ROW][C]15[/C][C]275037[/C][C]276553.613661103[/C][C]-1516.61366110318[/C][/ROW]
[ROW][C]16[/C][C]270150[/C][C]271511.576976334[/C][C]-1361.57697633351[/C][/ROW]
[ROW][C]17[/C][C]267140[/C][C]268175.396332338[/C][C]-1035.39633233793[/C][/ROW]
[ROW][C]18[/C][C]264993[/C][C]265732.685660588[/C][C]-739.685660588148[/C][/ROW]
[ROW][C]19[/C][C]287259[/C][C]286079.615126911[/C][C]1179.38487308915[/C][/ROW]
[ROW][C]20[/C][C]291186[/C][C]295655.565841303[/C][C]-4469.5658413028[/C][/ROW]
[ROW][C]21[/C][C]292300[/C][C]292433.771377636[/C][C]-133.771377635538[/C][/ROW]
[ROW][C]22[/C][C]288186[/C][C]287763.92774633[/C][C]422.072253669729[/C][/ROW]
[ROW][C]23[/C][C]281477[/C][C]280748.888588171[/C][C]728.111411829479[/C][/ROW]
[ROW][C]24[/C][C]282656[/C][C]281926.243210006[/C][C]729.756789993553[/C][/ROW]
[ROW][C]25[/C][C]280190[/C][C]282346.697498893[/C][C]-2156.69749889342[/C][/ROW]
[ROW][C]26[/C][C]280408[/C][C]278761.328973549[/C][C]1646.67102645116[/C][/ROW]
[ROW][C]27[/C][C]276836[/C][C]277668.427284065[/C][C]-832.427284064761[/C][/ROW]
[ROW][C]28[/C][C]275216[/C][C]271783.440257512[/C][C]3432.55974248797[/C][/ROW]
[ROW][C]29[/C][C]274352[/C][C]272133.634029734[/C][C]2218.36597026634[/C][/ROW]
[ROW][C]30[/C][C]271311[/C][C]272879.819984581[/C][C]-1568.81998458074[/C][/ROW]
[ROW][C]31[/C][C]289802[/C][C]293771.524433044[/C][C]-3969.52443304373[/C][/ROW]
[ROW][C]32[/C][C]290726[/C][C]297279.034802464[/C][C]-6553.03480246372[/C][/ROW]
[ROW][C]33[/C][C]292300[/C][C]291744.672675449[/C][C]555.327324550657[/C][/ROW]
[ROW][C]34[/C][C]278506[/C][C]286525.052894788[/C][C]-8019.05289478751[/C][/ROW]
[ROW][C]35[/C][C]269826[/C][C]269713.726168638[/C][C]112.273831362312[/C][/ROW]
[ROW][C]36[/C][C]265861[/C][C]267065.386140095[/C][C]-1204.38614009455[/C][/ROW]
[ROW][C]37[/C][C]269034[/C][C]261685.810345150[/C][C]7348.18965484964[/C][/ROW]
[ROW][C]38[/C][C]264176[/C][C]265141.794784438[/C][C]-965.79478443833[/C][/ROW]
[ROW][C]39[/C][C]255198[/C][C]259569.594797295[/C][C]-4371.59479729534[/C][/ROW]
[ROW][C]40[/C][C]253353[/C][C]249026.629638681[/C][C]4326.37036131855[/C][/ROW]
[ROW][C]41[/C][C]246057[/C][C]247553.975029949[/C][C]-1496.97502994936[/C][/ROW]
[ROW][C]42[/C][C]235372[/C][C]241419.486961528[/C][C]-6047.48696152825[/C][/ROW]
[ROW][C]43[/C][C]258556[/C][C]250662.058880839[/C][C]7893.94111916143[/C][/ROW]
[ROW][C]44[/C][C]260993[/C][C]260602.285217713[/C][C]390.714782287367[/C][/ROW]
[ROW][C]45[/C][C]254663[/C][C]261345.786985552[/C][C]-6682.78698555156[/C][/ROW]
[ROW][C]46[/C][C]250643[/C][C]247233.412775576[/C][C]3409.58722442359[/C][/ROW]
[ROW][C]47[/C][C]243422[/C][C]242422.728102639[/C][C]999.271897361235[/C][/ROW]
[ROW][C]48[/C][C]247105[/C][C]241055.189302988[/C][C]6049.81069701244[/C][/ROW]
[ROW][C]49[/C][C]248541[/C][C]245647.275102611[/C][C]2893.72489738924[/C][/ROW]
[ROW][C]50[/C][C]245039[/C][C]245597.160985660[/C][C]-558.160985659604[/C][/ROW]
[ROW][C]51[/C][C]237080[/C][C]241521.353677640[/C][C]-4441.35367764029[/C][/ROW]
[ROW][C]52[/C][C]237085[/C][C]234165.845703755[/C][C]2919.15429624481[/C][/ROW]
[ROW][C]53[/C][C]225554[/C][C]231904.378028072[/C][C]-6350.37802807221[/C][/ROW]
[ROW][C]54[/C][C]226839[/C][C]221211.247115566[/C][C]5627.75288443358[/C][/ROW]
[ROW][C]55[/C][C]247934[/C][C]244678.063378676[/C][C]3255.93662132375[/C][/ROW]
[ROW][C]56[/C][C]248333[/C][C]251193.551635975[/C][C]-2860.55163597505[/C][/ROW]
[ROW][C]57[/C][C]246969[/C][C]249053.926249261[/C][C]-2084.92624926139[/C][/ROW]
[ROW][C]58[/C][C]245098[/C][C]242829.370455777[/C][C]2268.62954422287[/C][/ROW]
[ROW][C]59[/C][C]246263[/C][C]238657.007207882[/C][C]7605.99279211755[/C][/ROW]
[ROW][C]60[/C][C]255765[/C][C]247073.561526891[/C][C]8691.43847310918[/C][/ROW]
[ROW][C]61[/C][C]264319[/C][C]257344.130479984[/C][C]6974.86952001599[/C][/ROW]
[ROW][C]62[/C][C]268347[/C][C]264849.48906655[/C][C]3497.51093345019[/C][/ROW]
[ROW][C]63[/C][C]273046[/C][C]268880.792660529[/C][C]4165.2073394715[/C][/ROW]
[ROW][C]64[/C][C]273963[/C][C]277647.422362721[/C][C]-3684.42236272106[/C][/ROW]
[ROW][C]65[/C][C]267430[/C][C]273522.624539900[/C][C]-6092.62453989964[/C][/ROW]
[ROW][C]66[/C][C]271993[/C][C]271145.436523605[/C][C]847.563476394978[/C][/ROW]
[ROW][C]67[/C][C]292710[/C][C]299532.470696924[/C][C]-6822.47069692361[/C][/ROW]
[/TABLE]
Source: https://freestatistics.org/blog/index.php?pk=64181&T=2

Globally Unique Identifier (entire table): ba.freestatistics.org/blog/index.php?pk=64181&T=2

As an alternative you can also use a QR Code:  

The GUIDs for individual cells are displayed in the table below:

Interpolation Forecasts of Exponential Smoothing
tObservedFittedResiduals
13277128271656.5667843645471.43321563635
14277103277483.788053612-380.788053612225
15275037276553.613661103-1516.61366110318
16270150271511.576976334-1361.57697633351
17267140268175.396332338-1035.39633233793
18264993265732.685660588-739.685660588148
19287259286079.6151269111179.38487308915
20291186295655.565841303-4469.5658413028
21292300292433.771377636-133.771377635538
22288186287763.92774633422.072253669729
23281477280748.888588171728.111411829479
24282656281926.243210006729.756789993553
25280190282346.697498893-2156.69749889342
26280408278761.3289735491646.67102645116
27276836277668.427284065-832.427284064761
28275216271783.4402575123432.55974248797
29274352272133.6340297342218.36597026634
30271311272879.819984581-1568.81998458074
31289802293771.524433044-3969.52443304373
32290726297279.034802464-6553.03480246372
33292300291744.672675449555.327324550657
34278506286525.052894788-8019.05289478751
35269826269713.726168638112.273831362312
36265861267065.386140095-1204.38614009455
37269034261685.8103451507348.18965484964
38264176265141.794784438-965.79478443833
39255198259569.594797295-4371.59479729534
40253353249026.6296386814326.37036131855
41246057247553.975029949-1496.97502994936
42235372241419.486961528-6047.48696152825
43258556250662.0588808397893.94111916143
44260993260602.285217713390.714782287367
45254663261345.786985552-6682.78698555156
46250643247233.4127755763409.58722442359
47243422242422.728102639999.271897361235
48247105241055.1893029886049.81069701244
49248541245647.2751026112893.72489738924
50245039245597.160985660-558.160985659604
51237080241521.353677640-4441.35367764029
52237085234165.8457037552919.15429624481
53225554231904.378028072-6350.37802807221
54226839221211.2471155665627.75288443358
55247934244678.0633786763255.93662132375
56248333251193.551635975-2860.55163597505
57246969249053.926249261-2084.92624926139
58245098242829.3704557772268.62954422287
59246263238657.0072078827605.99279211755
60255765247073.5615268918691.43847310918
61264319257344.1304799846974.86952001599
62268347264849.489066553497.51093345019
63273046268880.7926605294165.2073394715
64273963277647.422362721-3684.42236272106
65267430273522.624539900-6092.62453989964
66271993271145.436523605847.563476394978
67292710299532.470696924-6822.47069692361


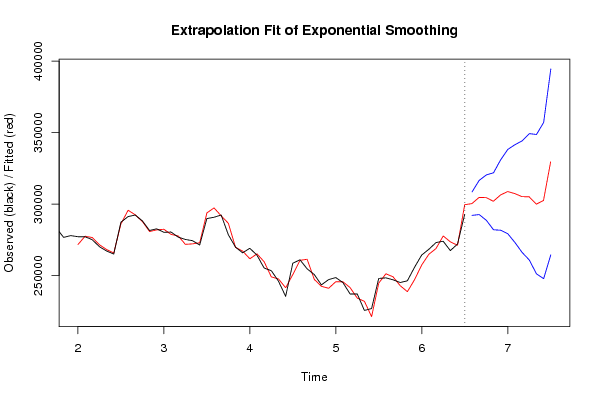
Extrapolation Forecasts of Exponential Smoothing
tForecast95% Lower Bound95% Upper Bound
68300263.910995514292070.737512249308457.084478779
69304587.494867773292634.650189949316540.339545596
70304485.660721309288600.831398128320370.49004449
71301920.54441613281989.521567407321851.567264853
72306306.398597741281656.139222345330956.657973136
73308715.851960042279191.487271475338240.216648609
74307277.326256193273020.073332386341534.579179999
75305162.176131266266114.041729530344210.310533001
76305045.06106947260820.449910969349269.672227972
77299896.377818419251135.642822053348657.112814785
78302424.957021911247792.635856676357057.278187145
79329483.069476088264467.197943384394498.941008792

\begin{tabular}{lllllllll}
\hline
Extrapolation Forecasts of Exponential Smoothing \tabularnewline
t & Forecast & 95% Lower Bound & 95% Upper Bound \tabularnewline
68 & 300263.910995514 & 292070.737512249 & 308457.084478779 \tabularnewline
69 & 304587.494867773 & 292634.650189949 & 316540.339545596 \tabularnewline
70 & 304485.660721309 & 288600.831398128 & 320370.49004449 \tabularnewline
71 & 301920.54441613 & 281989.521567407 & 321851.567264853 \tabularnewline
72 & 306306.398597741 & 281656.139222345 & 330956.657973136 \tabularnewline
73 & 308715.851960042 & 279191.487271475 & 338240.216648609 \tabularnewline
74 & 307277.326256193 & 273020.073332386 & 341534.579179999 \tabularnewline
75 & 305162.176131266 & 266114.041729530 & 344210.310533001 \tabularnewline
76 & 305045.06106947 & 260820.449910969 & 349269.672227972 \tabularnewline
77 & 299896.377818419 & 251135.642822053 & 348657.112814785 \tabularnewline
78 & 302424.957021911 & 247792.635856676 & 357057.278187145 \tabularnewline
79 & 329483.069476088 & 264467.197943384 & 394498.941008792 \tabularnewline
\hline
\end{tabular}
%Source: https://freestatistics.org/blog/index.php?pk=64181&T=3

[TABLE]
[ROW][C]Extrapolation Forecasts of Exponential Smoothing[/C][/ROW]
[ROW][C]t[/C][C]Forecast[/C][C]95% Lower Bound[/C][C]95% Upper Bound[/C][/ROW]
[ROW][C]68[/C][C]300263.910995514[/C][C]292070.737512249[/C][C]308457.084478779[/C][/ROW]
[ROW][C]69[/C][C]304587.494867773[/C][C]292634.650189949[/C][C]316540.339545596[/C][/ROW]
[ROW][C]70[/C][C]304485.660721309[/C][C]288600.831398128[/C][C]320370.49004449[/C][/ROW]
[ROW][C]71[/C][C]301920.54441613[/C][C]281989.521567407[/C][C]321851.567264853[/C][/ROW]
[ROW][C]72[/C][C]306306.398597741[/C][C]281656.139222345[/C][C]330956.657973136[/C][/ROW]
[ROW][C]73[/C][C]308715.851960042[/C][C]279191.487271475[/C][C]338240.216648609[/C][/ROW]
[ROW][C]74[/C][C]307277.326256193[/C][C]273020.073332386[/C][C]341534.579179999[/C][/ROW]
[ROW][C]75[/C][C]305162.176131266[/C][C]266114.041729530[/C][C]344210.310533001[/C][/ROW]
[ROW][C]76[/C][C]305045.06106947[/C][C]260820.449910969[/C][C]349269.672227972[/C][/ROW]
[ROW][C]77[/C][C]299896.377818419[/C][C]251135.642822053[/C][C]348657.112814785[/C][/ROW]
[ROW][C]78[/C][C]302424.957021911[/C][C]247792.635856676[/C][C]357057.278187145[/C][/ROW]
[ROW][C]79[/C][C]329483.069476088[/C][C]264467.197943384[/C][C]394498.941008792[/C][/ROW]
[/TABLE]
Source: https://freestatistics.org/blog/index.php?pk=64181&T=3

Globally Unique Identifier (entire table): ba.freestatistics.org/blog/index.php?pk=64181&T=3

As an alternative you can also use a QR Code:  

The GUIDs for individual cells are displayed in the table below:

Extrapolation Forecasts of Exponential Smoothing
tForecast95% Lower Bound95% Upper Bound
68300263.910995514292070.737512249308457.084478779
69304587.494867773292634.650189949316540.339545596
70304485.660721309288600.831398128320370.49004449
71301920.54441613281989.521567407321851.567264853
72306306.398597741281656.139222345330956.657973136
73308715.851960042279191.487271475338240.216648609
74307277.326256193273020.073332386341534.579179999
75305162.176131266266114.041729530344210.310533001
76305045.06106947260820.449910969349269.672227972
77299896.377818419251135.642822053348657.112814785
78302424.957021911247792.635856676357057.278187145
79329483.069476088264467.197943384394498.941008792


Parameters (Session):
par1 = 12 ;
Parameters (R input):
par1 = 12 ; par2 = Triple ; par3 = multiplicative ;
R code (references can be found in the software module):
par1 <- as.numeric(par1)
if (par2 == 'Single') K <- 1
if (par2 == 'Double') K <- 2
if (par2 == 'Triple') K <- par1
nx <- length(x)
nxmK <- nx - K
x <- ts(x, frequency = par1)
if (par2 == 'Single') fit <- HoltWinters(x, gamma=0, beta=0)
if (par2 == 'Double') fit <- HoltWinters(x, gamma=0)
if (par2 == 'Triple') fit <- HoltWinters(x, seasonal=par3)
fit
myresid <- x - fit$fitted[,'xhat']
bitmap(file='test1.png')
op <- par(mfrow=c(2,1))
plot(fit,ylab='Observed (black) / Fitted (red)',main='Interpolation Fit of Exponential Smoothing')
plot(myresid,ylab='Residuals',main='Interpolation Prediction Errors')
par(op)
dev.off()
bitmap(file='test2.png')
p <- predict(fit, par1, prediction.interval=TRUE)
np <- length(p[,1])
plot(fit,p,ylab='Observed (black) / Fitted (red)',main='Extrapolation Fit of Exponential Smoothing')
dev.off()
bitmap(file='test3.png')
op <- par(mfrow = c(2,2))
acf(as.numeric(myresid),lag.max = nx/2,main='Residual ACF')
spectrum(myresid,main='Residals Periodogram')
cpgram(myresid,main='Residal Cumulative Periodogram')
qqnorm(myresid,main='Residual Normal QQ Plot')
qqline(myresid)
par(op)
dev.off()
load(file='createtable')
a<-table.start()
a<-table.row.start(a)
a<-table.element(a,'Estimated Parameters of Exponential Smoothing',2,TRUE)
a<-table.row.end(a)
a<-table.row.start(a)
a<-table.element(a,'Parameter',header=TRUE)
a<-table.element(a,'Value',header=TRUE)
a<-table.row.end(a)
a<-table.row.start(a)
a<-table.element(a,'alpha',header=TRUE)
a<-table.element(a,fit$alpha)
a<-table.row.end(a)
a<-table.row.start(a)
a<-table.element(a,'beta',header=TRUE)
a<-table.element(a,fit$beta)
a<-table.row.end(a)
a<-table.row.start(a)
a<-table.element(a,'gamma',header=TRUE)
a<-table.element(a,fit$gamma)
a<-table.row.end(a)
a<-table.end(a)
table.save(a,file='mytable.tab')
a<-table.start()
a<-table.row.start(a)
a<-table.element(a,'Interpolation Forecasts of Exponential Smoothing',4,TRUE)
a<-table.row.end(a)
a<-table.row.start(a)
a<-table.element(a,'t',header=TRUE)
a<-table.element(a,'Observed',header=TRUE)
a<-table.element(a,'Fitted',header=TRUE)
a<-table.element(a,'Residuals',header=TRUE)
a<-table.row.end(a)
for (i in 1:nxmK) {
a<-table.row.start(a)
a<-table.element(a,i+K,header=TRUE)
a<-table.element(a,x[i+K])
a<-table.element(a,fit$fitted[i,'xhat'])
a<-table.element(a,myresid[i])
a<-table.row.end(a)
}
a<-table.end(a)
table.save(a,file='mytable1.tab')
a<-table.start()
a<-table.row.start(a)
a<-table.element(a,'Extrapolation Forecasts of Exponential Smoothing',4,TRUE)
a<-table.row.end(a)
a<-table.row.start(a)
a<-table.element(a,'t',header=TRUE)
a<-table.element(a,'Forecast',header=TRUE)
a<-table.element(a,'95% Lower Bound',header=TRUE)
a<-table.element(a,'95% Upper Bound',header=TRUE)
a<-table.row.end(a)
for (i in 1:np) {
a<-table.row.start(a)
a<-table.element(a,nx+i,header=TRUE)
a<-table.element(a,p[i,'fit'])
a<-table.element(a,p[i,'lwr'])
a<-table.element(a,p[i,'upr'])
a<-table.row.end(a)
}
a<-table.end(a)
table.save(a,file='mytable2.tab')