Free Statistics
of Irreproducible Research!
Description of Statistical Computation | |||||||||||||||||||||||||||||||||||||||||
|---|---|---|---|---|---|---|---|---|---|---|---|---|---|---|---|---|---|---|---|---|---|---|---|---|---|---|---|---|---|---|---|---|---|---|---|---|---|---|---|---|---|
| Author's title | |||||||||||||||||||||||||||||||||||||||||
| Author | *The author of this computation has been verified* | ||||||||||||||||||||||||||||||||||||||||
| R Software Module | rwasp_univariatedataseries.wasp | ||||||||||||||||||||||||||||||||||||||||
| Title produced by software | Univariate Data Series | ||||||||||||||||||||||||||||||||||||||||
| Date of computation | Sat, 05 Dec 2009 04:51:15 -0700 | ||||||||||||||||||||||||||||||||||||||||
| Cite this page as follows | Statistical Computations at FreeStatistics.org, Office for Research Development and Education, URL https://freestatistics.org/blog/index.php?v=date/2009/Dec/05/t1260013980k00wwfq6um9x2df.htm/, Retrieved Tue, 30 Apr 2024 05:33:55 +0000 | ||||||||||||||||||||||||||||||||||||||||
| Statistical Computations at FreeStatistics.org, Office for Research Development and Education, URL https://freestatistics.org/blog/index.php?pk=64236, Retrieved Tue, 30 Apr 2024 05:33:55 +0000 | |||||||||||||||||||||||||||||||||||||||||
| QR Codes: | |||||||||||||||||||||||||||||||||||||||||
|
| |||||||||||||||||||||||||||||||||||||||||
| Original text written by user: | |||||||||||||||||||||||||||||||||||||||||
| IsPrivate? | No (this computation is public) | ||||||||||||||||||||||||||||||||||||||||
| User-defined keywords | |||||||||||||||||||||||||||||||||||||||||
| Estimated Impact | 153 | ||||||||||||||||||||||||||||||||||||||||
Tree of Dependent Computations | |||||||||||||||||||||||||||||||||||||||||
| Family? (F = Feedback message, R = changed R code, M = changed R Module, P = changed Parameters, D = changed Data) | |||||||||||||||||||||||||||||||||||||||||
| - [Univariate Data Series] [tijdreeks 1] [2009-12-04 12:52:07] [ed603017d2bee8fbd82b6d5ec04e12c3] - PD [Univariate Data Series] [Tijdreeks 1] [2009-12-05 11:51:15] [87085ce7f5378f281469a8b1f0969170] [Current] | |||||||||||||||||||||||||||||||||||||||||
| Feedback Forum | |||||||||||||||||||||||||||||||||||||||||
Post a new message | |||||||||||||||||||||||||||||||||||||||||
Dataset | |||||||||||||||||||||||||||||||||||||||||
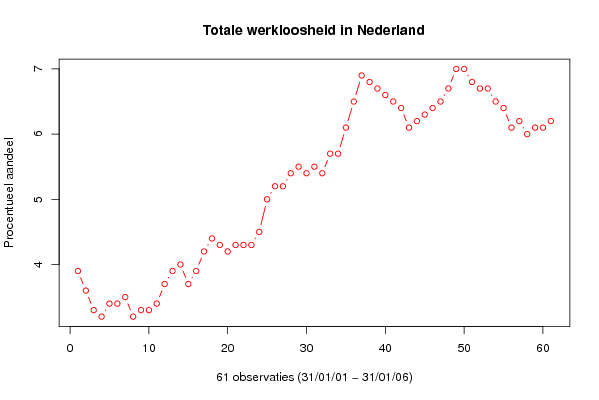
| Dataseries X: | |||||||||||||||||||||||||||||||||||||||||
3,9 3,6 3,3 3,2 3,4 3,4 3,5 3,2 3,3 3,3 3,4 3,7 3,9 4 3,7 3,9 4,2 4,4 4,3 4,2 4,3 4,3 4,3 4,5 5 5,2 5,2 5,4 5,5 5,4 5,5 5,4 5,7 5,7 6,1 6,5 6,9 6,8 6,7 6,6 6,5 6,4 6,1 6,2 6,3 6,4 6,5 6,7 7 7 6,8 6,7 6,7 6,5 6,4 6,1 6,2 6 6,1 6,1 6,2 | |||||||||||||||||||||||||||||||||||||||||
Tables (Output of Computation) | |||||||||||||||||||||||||||||||||||||||||
| |||||||||||||||||||||||||||||||||||||||||
Figures (Output of Computation) | |||||||||||||||||||||||||||||||||||||||||
Input Parameters & R Code | |||||||||||||||||||||||||||||||||||||||||
| Parameters (Session): | |||||||||||||||||||||||||||||||||||||||||
| par1 = Tijdreeks 1: Totale werkloosheid in Nederland t.o.v. beroepsbevolking ; par2 = CBS statline ; par3 = Totale werkloosheid in Nederland ; | |||||||||||||||||||||||||||||||||||||||||
| Parameters (R input): | |||||||||||||||||||||||||||||||||||||||||
| par1 = Tijdreeks 1: Totale werkloosheid in Nederland t.o.v. beroepsbevolking ; par2 = CBS statline ; par3 = Totale werkloosheid in Nederland ; | |||||||||||||||||||||||||||||||||||||||||
| R code (references can be found in the software module): | |||||||||||||||||||||||||||||||||||||||||
bitmap(file='test1.png') | |||||||||||||||||||||||||||||||||||||||||