Free Statistics
of Irreproducible Research!
Description of Statistical Computation | |||||||||||||||||||||||||||||||||||||||||
|---|---|---|---|---|---|---|---|---|---|---|---|---|---|---|---|---|---|---|---|---|---|---|---|---|---|---|---|---|---|---|---|---|---|---|---|---|---|---|---|---|---|
| Author's title | |||||||||||||||||||||||||||||||||||||||||
| Author | *The author of this computation has been verified* | ||||||||||||||||||||||||||||||||||||||||
| R Software Module | rwasp_univariatedataseries.wasp | ||||||||||||||||||||||||||||||||||||||||
| Title produced by software | Univariate Data Series | ||||||||||||||||||||||||||||||||||||||||
| Date of computation | Sat, 05 Dec 2009 08:05:41 -0700 | ||||||||||||||||||||||||||||||||||||||||
| Cite this page as follows | Statistical Computations at FreeStatistics.org, Office for Research Development and Education, URL https://freestatistics.org/blog/index.php?v=date/2009/Dec/05/t1260025586uqpi10eoblk3yls.htm/, Retrieved Tue, 30 Apr 2024 04:40:09 +0000 | ||||||||||||||||||||||||||||||||||||||||
| Statistical Computations at FreeStatistics.org, Office for Research Development and Education, URL https://freestatistics.org/blog/index.php?pk=64279, Retrieved Tue, 30 Apr 2024 04:40:09 +0000 | |||||||||||||||||||||||||||||||||||||||||
| QR Codes: | |||||||||||||||||||||||||||||||||||||||||
|
| |||||||||||||||||||||||||||||||||||||||||
| Original text written by user: | |||||||||||||||||||||||||||||||||||||||||
| IsPrivate? | No (this computation is public) | ||||||||||||||||||||||||||||||||||||||||
| User-defined keywords | |||||||||||||||||||||||||||||||||||||||||
| Estimated Impact | 135 | ||||||||||||||||||||||||||||||||||||||||
Tree of Dependent Computations | |||||||||||||||||||||||||||||||||||||||||
| Family? (F = Feedback message, R = changed R code, M = changed R Module, P = changed Parameters, D = changed Data) | |||||||||||||||||||||||||||||||||||||||||
| - [Univariate Data Series] [data set] [2008-12-01 19:54:57] [b98453cac15ba1066b407e146608df68] - PD [Univariate Data Series] [Univariate data s...] [2008-12-07 20:42:43] [12d343c4448a5f9e527bb31caeac580b] - PD [Univariate Data Series] [Univariate data s...] [2008-12-12 15:30:27] [12d343c4448a5f9e527bb31caeac580b] - MPD [Univariate Data Series] [werkloosheid in d...] [2009-12-05 15:05:41] [0545e25c765ce26b196961216dc11e13] [Current] | |||||||||||||||||||||||||||||||||||||||||
| Feedback Forum | |||||||||||||||||||||||||||||||||||||||||
Post a new message | |||||||||||||||||||||||||||||||||||||||||
Dataset | |||||||||||||||||||||||||||||||||||||||||
| Dataseries X: | |||||||||||||||||||||||||||||||||||||||||
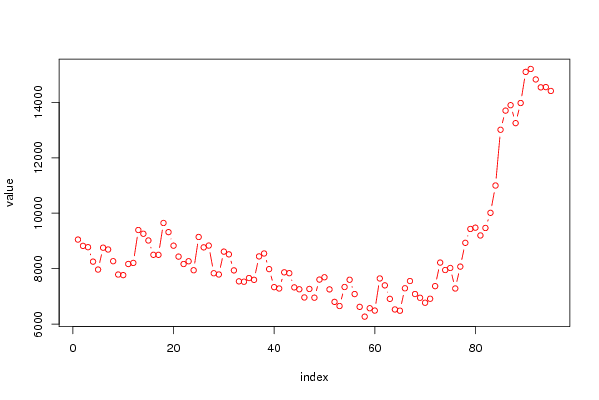
9051 8823 8776 8255 7969 8758 8693 8271 7790 7769 8170 8209 9395 9260 9018 8501 8500 9649 9319 8830 8436 8169 8269 7945 9144 8770 8834 7837 7792 8616 8518 7940 7545 7531 7665 7599 8444 8549 7986 7335 7287 7870 7839 7327 7259 6964 7271 6956 7608 7692 7255 6804 6655 7341 7602 7086 6625 6272 6576 6491 7649 7400 6913 6532 6486 7295 7556 7088 6952 6773 6917 7371 8221 7953 8027 7287 8076 8933 9433 9479 9199 9469 10015 10999 13009 13699 13895 13248 13973 15095 15201 14823 14538 14547 14407 | |||||||||||||||||||||||||||||||||||||||||
Tables (Output of Computation) | |||||||||||||||||||||||||||||||||||||||||
| |||||||||||||||||||||||||||||||||||||||||
Figures (Output of Computation) | |||||||||||||||||||||||||||||||||||||||||
Input Parameters & R Code | |||||||||||||||||||||||||||||||||||||||||
| Parameters (Session): | |||||||||||||||||||||||||||||||||||||||||
| par1 = 1 ; par2 = Include Monthly Dummies ; par3 = Linear Trend ; | |||||||||||||||||||||||||||||||||||||||||
| Parameters (R input): | |||||||||||||||||||||||||||||||||||||||||
| par1 = Werkloosheid in de VS ; par2 = Bureau of Labor Statistics Data ; par3 = maandelijkse werkloosheidscijfers in de VS ; | |||||||||||||||||||||||||||||||||||||||||
| R code (references can be found in the software module): | |||||||||||||||||||||||||||||||||||||||||
bitmap(file='test1.png') | |||||||||||||||||||||||||||||||||||||||||