Free Statistics

of Irreproducible Research!

Author's title

Author*Unverified author*
R Software Modulerwasp_autocorrelation.wasp
Title produced by software(Partial) Autocorrelation Function
Date of computationSat, 05 Dec 2009 11:21:50 -0700
Cite this page as followsStatistical Computations at FreeStatistics.org, Office for Research Development and Education, URL https://freestatistics.org/blog/index.php?v=date/2009/Dec/05/t1260037449kld2tz4b3pgf0gb.htm/, Retrieved Tue, 30 Apr 2024 01:57:28 +0000
Statistical Computations at FreeStatistics.org, Office for Research Development and Education, URL https://freestatistics.org/blog/index.php?pk=64295, Retrieved Tue, 30 Apr 2024 01:57:28 +0000
QR Codes:

Original text written by user:
IsPrivate?No (this computation is public)
User-defined keywordsKDGP2W21
Estimated Impact122
Family? (F = Feedback message, R = changed R code, M = changed R Module, P = changed Parameters, D = changed Data)
-     [(Partial) Autocorrelation Function] [Opgave 6 bis] [2009-12-05 17:52:39] [101768e0846f790d4a51eca83c4a4208]
-    D    [(Partial) Autocorrelation Function] [oefening 6 bis] [2009-12-05 18:21:50] [f8fa19533df6d92688ec2c19e4765e3f] [Current]
Feedback Forum

Post a new message
Dataseries X:
161.88
162.05
162.16
162.61
162.53
162.53
162.53
162.53
162.83
161.61
161.79
161.79
161.79
161.79
161.85
161.77
161.86
161.89
161.89
161.89
162.18
162.43
162.58
162.57
162.57
162.57
162.44
162.79
163.15
163.23
163.23
163.23
163.38
163.71
163.73
163.73
163.73
163.73
163.93
164.27
164.57
164.73
164.73
164.76
165.75
165.86
165.99
166.13
166.13
166.13
166.15
166.45
166.48
166.51
166.51
166.51
166.58
166.82
167.35
167.5
167.5
167.6
167.72
167.29
166.98
166.98
166.98
166.98
167.63
167.83
167.85
167.87
167.87
167.96
167.7
169.25
168.79
168.77
168.77
169
168.92
169.23
169.28
169.29
169.29
170.29
170.59
171.98
172.31
172.28
172.28
172.45
172.27
172.65
172.08
172.2
172.2
172.2
172.36
172.53
173.18
173.17
173.17
173.17
173.4
174.47
174.56
174.59
174.59
175.22
175.3
175.25
175.54
175.58
175.58
175.68
176.05
176.4
176.58
176.49


Summary of computational transaction
Raw Inputview raw input (R code)
Raw Outputview raw output of R engine
Computing time1 seconds
R Server'Gwilym Jenkins' @ 72.249.127.135

\begin{tabular}{lllllllll}
\hline
Summary of computational transaction \tabularnewline
Raw Input & view raw input (R code)  \tabularnewline
Raw Output & view raw output of R engine  \tabularnewline
Computing time & 1 seconds \tabularnewline
R Server & 'Gwilym Jenkins' @ 72.249.127.135 \tabularnewline
\hline
\end{tabular}
%Source: https://freestatistics.org/blog/index.php?pk=64295&T=0

[TABLE]
[ROW][C]Summary of computational transaction[/C][/ROW]
[ROW][C]Raw Input[/C][C]view raw input (R code) [/C][/ROW]
[ROW][C]Raw Output[/C][C]view raw output of R engine [/C][/ROW]
[ROW][C]Computing time[/C][C]1 seconds[/C][/ROW]
[ROW][C]R Server[/C][C]'Gwilym Jenkins' @ 72.249.127.135[/C][/ROW]
[/TABLE]
Source: https://freestatistics.org/blog/index.php?pk=64295&T=0

Globally Unique Identifier (entire table): ba.freestatistics.org/blog/index.php?pk=64295&T=0

As an alternative you can also use a QR Code:  

The GUIDs for individual cells are displayed in the table below:

Summary of computational transaction
Raw Inputview raw input (R code)
Raw Outputview raw output of R engine
Computing time1 seconds
R Server'Gwilym Jenkins' @ 72.249.127.135


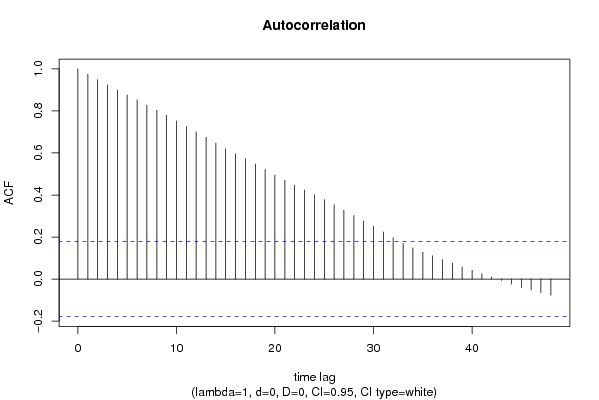
Autocorrelation Function
Time lag kACF(k)T-STATP-value
10.97471810.67750
20.94913110.39720
30.92337610.11510
40.8995469.8540
50.8760189.59630
60.8523849.33740
70.8279739.070
80.8029558.79590
90.7793228.5370
100.7527178.24560
110.7257577.95030
120.7008617.67750
130.6744867.38860
140.6472687.09050
150.6198326.78990
160.5958696.52740
170.5723066.26930
180.5475315.99790
190.521345.7110
200.4947265.41950
210.4703835.15281e-06
220.4470544.89722e-06
230.4243324.64834e-06
240.4013984.39711.2e-05
250.3778214.13883.3e-05
260.3537593.87528.7e-05
270.327163.58390.000245
280.3021623.310.000616
290.2766793.03090.001494
300.2511982.75170.003424
310.2243312.45740.007712
320.1962132.14940.016805
330.1694841.85660.03291
340.1484621.62630.053252
350.1278711.40080.081933
360.1108981.21480.113409
370.0935481.02480.153768
380.0754740.82680.205003
390.0577970.63310.263925
400.0417660.45750.324063
410.0257590.28220.389146
420.0098660.10810.457057
43-0.00653-0.07150.471545
44-0.023746-0.26010.397606
45-0.040635-0.44510.328511
46-0.051855-0.5680.285532
47-0.064104-0.70220.241949
48-0.076643-0.83960.201407

\begin{tabular}{lllllllll}
\hline
Autocorrelation Function \tabularnewline
Time lag k & ACF(k) & T-STAT & P-value \tabularnewline
1 & 0.974718 & 10.6775 & 0 \tabularnewline
2 & 0.949131 & 10.3972 & 0 \tabularnewline
3 & 0.923376 & 10.1151 & 0 \tabularnewline
4 & 0.899546 & 9.854 & 0 \tabularnewline
5 & 0.876018 & 9.5963 & 0 \tabularnewline
6 & 0.852384 & 9.3374 & 0 \tabularnewline
7 & 0.827973 & 9.07 & 0 \tabularnewline
8 & 0.802955 & 8.7959 & 0 \tabularnewline
9 & 0.779322 & 8.537 & 0 \tabularnewline
10 & 0.752717 & 8.2456 & 0 \tabularnewline
11 & 0.725757 & 7.9503 & 0 \tabularnewline
12 & 0.700861 & 7.6775 & 0 \tabularnewline
13 & 0.674486 & 7.3886 & 0 \tabularnewline
14 & 0.647268 & 7.0905 & 0 \tabularnewline
15 & 0.619832 & 6.7899 & 0 \tabularnewline
16 & 0.595869 & 6.5274 & 0 \tabularnewline
17 & 0.572306 & 6.2693 & 0 \tabularnewline
18 & 0.547531 & 5.9979 & 0 \tabularnewline
19 & 0.52134 & 5.711 & 0 \tabularnewline
20 & 0.494726 & 5.4195 & 0 \tabularnewline
21 & 0.470383 & 5.1528 & 1e-06 \tabularnewline
22 & 0.447054 & 4.8972 & 2e-06 \tabularnewline
23 & 0.424332 & 4.6483 & 4e-06 \tabularnewline
24 & 0.401398 & 4.3971 & 1.2e-05 \tabularnewline
25 & 0.377821 & 4.1388 & 3.3e-05 \tabularnewline
26 & 0.353759 & 3.8752 & 8.7e-05 \tabularnewline
27 & 0.32716 & 3.5839 & 0.000245 \tabularnewline
28 & 0.302162 & 3.31 & 0.000616 \tabularnewline
29 & 0.276679 & 3.0309 & 0.001494 \tabularnewline
30 & 0.251198 & 2.7517 & 0.003424 \tabularnewline
31 & 0.224331 & 2.4574 & 0.007712 \tabularnewline
32 & 0.196213 & 2.1494 & 0.016805 \tabularnewline
33 & 0.169484 & 1.8566 & 0.03291 \tabularnewline
34 & 0.148462 & 1.6263 & 0.053252 \tabularnewline
35 & 0.127871 & 1.4008 & 0.081933 \tabularnewline
36 & 0.110898 & 1.2148 & 0.113409 \tabularnewline
37 & 0.093548 & 1.0248 & 0.153768 \tabularnewline
38 & 0.075474 & 0.8268 & 0.205003 \tabularnewline
39 & 0.057797 & 0.6331 & 0.263925 \tabularnewline
40 & 0.041766 & 0.4575 & 0.324063 \tabularnewline
41 & 0.025759 & 0.2822 & 0.389146 \tabularnewline
42 & 0.009866 & 0.1081 & 0.457057 \tabularnewline
43 & -0.00653 & -0.0715 & 0.471545 \tabularnewline
44 & -0.023746 & -0.2601 & 0.397606 \tabularnewline
45 & -0.040635 & -0.4451 & 0.328511 \tabularnewline
46 & -0.051855 & -0.568 & 0.285532 \tabularnewline
47 & -0.064104 & -0.7022 & 0.241949 \tabularnewline
48 & -0.076643 & -0.8396 & 0.201407 \tabularnewline
\hline
\end{tabular}
%Source: https://freestatistics.org/blog/index.php?pk=64295&T=1

[TABLE]
[ROW][C]Autocorrelation Function[/C][/ROW]
[ROW][C]Time lag k[/C][C]ACF(k)[/C][C]T-STAT[/C][C]P-value[/C][/ROW]
[ROW][C]1[/C][C]0.974718[/C][C]10.6775[/C][C]0[/C][/ROW]
[ROW][C]2[/C][C]0.949131[/C][C]10.3972[/C][C]0[/C][/ROW]
[ROW][C]3[/C][C]0.923376[/C][C]10.1151[/C][C]0[/C][/ROW]
[ROW][C]4[/C][C]0.899546[/C][C]9.854[/C][C]0[/C][/ROW]
[ROW][C]5[/C][C]0.876018[/C][C]9.5963[/C][C]0[/C][/ROW]
[ROW][C]6[/C][C]0.852384[/C][C]9.3374[/C][C]0[/C][/ROW]
[ROW][C]7[/C][C]0.827973[/C][C]9.07[/C][C]0[/C][/ROW]
[ROW][C]8[/C][C]0.802955[/C][C]8.7959[/C][C]0[/C][/ROW]
[ROW][C]9[/C][C]0.779322[/C][C]8.537[/C][C]0[/C][/ROW]
[ROW][C]10[/C][C]0.752717[/C][C]8.2456[/C][C]0[/C][/ROW]
[ROW][C]11[/C][C]0.725757[/C][C]7.9503[/C][C]0[/C][/ROW]
[ROW][C]12[/C][C]0.700861[/C][C]7.6775[/C][C]0[/C][/ROW]
[ROW][C]13[/C][C]0.674486[/C][C]7.3886[/C][C]0[/C][/ROW]
[ROW][C]14[/C][C]0.647268[/C][C]7.0905[/C][C]0[/C][/ROW]
[ROW][C]15[/C][C]0.619832[/C][C]6.7899[/C][C]0[/C][/ROW]
[ROW][C]16[/C][C]0.595869[/C][C]6.5274[/C][C]0[/C][/ROW]
[ROW][C]17[/C][C]0.572306[/C][C]6.2693[/C][C]0[/C][/ROW]
[ROW][C]18[/C][C]0.547531[/C][C]5.9979[/C][C]0[/C][/ROW]
[ROW][C]19[/C][C]0.52134[/C][C]5.711[/C][C]0[/C][/ROW]
[ROW][C]20[/C][C]0.494726[/C][C]5.4195[/C][C]0[/C][/ROW]
[ROW][C]21[/C][C]0.470383[/C][C]5.1528[/C][C]1e-06[/C][/ROW]
[ROW][C]22[/C][C]0.447054[/C][C]4.8972[/C][C]2e-06[/C][/ROW]
[ROW][C]23[/C][C]0.424332[/C][C]4.6483[/C][C]4e-06[/C][/ROW]
[ROW][C]24[/C][C]0.401398[/C][C]4.3971[/C][C]1.2e-05[/C][/ROW]
[ROW][C]25[/C][C]0.377821[/C][C]4.1388[/C][C]3.3e-05[/C][/ROW]
[ROW][C]26[/C][C]0.353759[/C][C]3.8752[/C][C]8.7e-05[/C][/ROW]
[ROW][C]27[/C][C]0.32716[/C][C]3.5839[/C][C]0.000245[/C][/ROW]
[ROW][C]28[/C][C]0.302162[/C][C]3.31[/C][C]0.000616[/C][/ROW]
[ROW][C]29[/C][C]0.276679[/C][C]3.0309[/C][C]0.001494[/C][/ROW]
[ROW][C]30[/C][C]0.251198[/C][C]2.7517[/C][C]0.003424[/C][/ROW]
[ROW][C]31[/C][C]0.224331[/C][C]2.4574[/C][C]0.007712[/C][/ROW]
[ROW][C]32[/C][C]0.196213[/C][C]2.1494[/C][C]0.016805[/C][/ROW]
[ROW][C]33[/C][C]0.169484[/C][C]1.8566[/C][C]0.03291[/C][/ROW]
[ROW][C]34[/C][C]0.148462[/C][C]1.6263[/C][C]0.053252[/C][/ROW]
[ROW][C]35[/C][C]0.127871[/C][C]1.4008[/C][C]0.081933[/C][/ROW]
[ROW][C]36[/C][C]0.110898[/C][C]1.2148[/C][C]0.113409[/C][/ROW]
[ROW][C]37[/C][C]0.093548[/C][C]1.0248[/C][C]0.153768[/C][/ROW]
[ROW][C]38[/C][C]0.075474[/C][C]0.8268[/C][C]0.205003[/C][/ROW]
[ROW][C]39[/C][C]0.057797[/C][C]0.6331[/C][C]0.263925[/C][/ROW]
[ROW][C]40[/C][C]0.041766[/C][C]0.4575[/C][C]0.324063[/C][/ROW]
[ROW][C]41[/C][C]0.025759[/C][C]0.2822[/C][C]0.389146[/C][/ROW]
[ROW][C]42[/C][C]0.009866[/C][C]0.1081[/C][C]0.457057[/C][/ROW]
[ROW][C]43[/C][C]-0.00653[/C][C]-0.0715[/C][C]0.471545[/C][/ROW]
[ROW][C]44[/C][C]-0.023746[/C][C]-0.2601[/C][C]0.397606[/C][/ROW]
[ROW][C]45[/C][C]-0.040635[/C][C]-0.4451[/C][C]0.328511[/C][/ROW]
[ROW][C]46[/C][C]-0.051855[/C][C]-0.568[/C][C]0.285532[/C][/ROW]
[ROW][C]47[/C][C]-0.064104[/C][C]-0.7022[/C][C]0.241949[/C][/ROW]
[ROW][C]48[/C][C]-0.076643[/C][C]-0.8396[/C][C]0.201407[/C][/ROW]
[/TABLE]
Source: https://freestatistics.org/blog/index.php?pk=64295&T=1

Globally Unique Identifier (entire table): ba.freestatistics.org/blog/index.php?pk=64295&T=1

As an alternative you can also use a QR Code:  

The GUIDs for individual cells are displayed in the table below:

Autocorrelation Function
Time lag kACF(k)T-STATP-value
10.97471810.67750
20.94913110.39720
30.92337610.11510
40.8995469.8540
50.8760189.59630
60.8523849.33740
70.8279739.070
80.8029558.79590
90.7793228.5370
100.7527178.24560
110.7257577.95030
120.7008617.67750
130.6744867.38860
140.6472687.09050
150.6198326.78990
160.5958696.52740
170.5723066.26930
180.5475315.99790
190.521345.7110
200.4947265.41950
210.4703835.15281e-06
220.4470544.89722e-06
230.4243324.64834e-06
240.4013984.39711.2e-05
250.3778214.13883.3e-05
260.3537593.87528.7e-05
270.327163.58390.000245
280.3021623.310.000616
290.2766793.03090.001494
300.2511982.75170.003424
310.2243312.45740.007712
320.1962132.14940.016805
330.1694841.85660.03291
340.1484621.62630.053252
350.1278711.40080.081933
360.1108981.21480.113409
370.0935481.02480.153768
380.0754740.82680.205003
390.0577970.63310.263925
400.0417660.45750.324063
410.0257590.28220.389146
420.0098660.10810.457057
43-0.00653-0.07150.471545
44-0.023746-0.26010.397606
45-0.040635-0.44510.328511
46-0.051855-0.5680.285532
47-0.064104-0.70220.241949
48-0.076643-0.83960.201407


Partial Autocorrelation Function
Time lag kPACF(k)T-STATP-value
10.97471810.67750
2-0.018922-0.20730.418072
3-0.016454-0.18020.428632
40.0252350.27640.391346
5-0.006964-0.07630.46966
6-0.015036-0.16470.434723
7-0.026952-0.29520.384161
8-0.02488-0.27250.392837
90.0140810.15420.438838
10-0.07437-0.81470.208433
11-0.022836-0.25020.401448
120.0286610.3140.377045
13-0.04912-0.53810.295758
14-0.033811-0.37040.355877
15-0.017667-0.19350.423434
160.0529420.57990.281519
17-0.007529-0.08250.467201
18-0.045858-0.50240.30817
19-0.035761-0.39170.34797
20-0.018533-0.2030.419731
210.0204760.22430.41145
220.000920.01010.495987
23-0.003129-0.03430.486355
24-0.014797-0.16210.435751
25-0.034669-0.37980.352388
26-0.027881-0.30540.380287
27-0.062487-0.68450.247486
280.0107940.11820.453036
29-0.0322-0.35270.362454
30-0.029534-0.32350.373429
31-0.042336-0.46380.321827
32-0.043082-0.47190.318915
330.0025360.02780.488944
340.0889310.97420.165962
35-0.017594-0.19270.423747
360.0692050.75810.224939
37-0.015162-0.16610.434181
38-0.031711-0.34740.364457
39-0.001252-0.01370.494541
400.0098240.10760.457242
41-0.01613-0.17670.430023
42-0.019648-0.21520.414978
43-0.036764-0.40270.343931
44-0.02588-0.28350.388639
45-0.015079-0.16520.434541
460.0841640.9220.179198
47-0.043008-0.47110.319204
48-0.022978-0.25170.400848

\begin{tabular}{lllllllll}
\hline
Partial Autocorrelation Function \tabularnewline
Time lag k & PACF(k) & T-STAT & P-value \tabularnewline
1 & 0.974718 & 10.6775 & 0 \tabularnewline
2 & -0.018922 & -0.2073 & 0.418072 \tabularnewline
3 & -0.016454 & -0.1802 & 0.428632 \tabularnewline
4 & 0.025235 & 0.2764 & 0.391346 \tabularnewline
5 & -0.006964 & -0.0763 & 0.46966 \tabularnewline
6 & -0.015036 & -0.1647 & 0.434723 \tabularnewline
7 & -0.026952 & -0.2952 & 0.384161 \tabularnewline
8 & -0.02488 & -0.2725 & 0.392837 \tabularnewline
9 & 0.014081 & 0.1542 & 0.438838 \tabularnewline
10 & -0.07437 & -0.8147 & 0.208433 \tabularnewline
11 & -0.022836 & -0.2502 & 0.401448 \tabularnewline
12 & 0.028661 & 0.314 & 0.377045 \tabularnewline
13 & -0.04912 & -0.5381 & 0.295758 \tabularnewline
14 & -0.033811 & -0.3704 & 0.355877 \tabularnewline
15 & -0.017667 & -0.1935 & 0.423434 \tabularnewline
16 & 0.052942 & 0.5799 & 0.281519 \tabularnewline
17 & -0.007529 & -0.0825 & 0.467201 \tabularnewline
18 & -0.045858 & -0.5024 & 0.30817 \tabularnewline
19 & -0.035761 & -0.3917 & 0.34797 \tabularnewline
20 & -0.018533 & -0.203 & 0.419731 \tabularnewline
21 & 0.020476 & 0.2243 & 0.41145 \tabularnewline
22 & 0.00092 & 0.0101 & 0.495987 \tabularnewline
23 & -0.003129 & -0.0343 & 0.486355 \tabularnewline
24 & -0.014797 & -0.1621 & 0.435751 \tabularnewline
25 & -0.034669 & -0.3798 & 0.352388 \tabularnewline
26 & -0.027881 & -0.3054 & 0.380287 \tabularnewline
27 & -0.062487 & -0.6845 & 0.247486 \tabularnewline
28 & 0.010794 & 0.1182 & 0.453036 \tabularnewline
29 & -0.0322 & -0.3527 & 0.362454 \tabularnewline
30 & -0.029534 & -0.3235 & 0.373429 \tabularnewline
31 & -0.042336 & -0.4638 & 0.321827 \tabularnewline
32 & -0.043082 & -0.4719 & 0.318915 \tabularnewline
33 & 0.002536 & 0.0278 & 0.488944 \tabularnewline
34 & 0.088931 & 0.9742 & 0.165962 \tabularnewline
35 & -0.017594 & -0.1927 & 0.423747 \tabularnewline
36 & 0.069205 & 0.7581 & 0.224939 \tabularnewline
37 & -0.015162 & -0.1661 & 0.434181 \tabularnewline
38 & -0.031711 & -0.3474 & 0.364457 \tabularnewline
39 & -0.001252 & -0.0137 & 0.494541 \tabularnewline
40 & 0.009824 & 0.1076 & 0.457242 \tabularnewline
41 & -0.01613 & -0.1767 & 0.430023 \tabularnewline
42 & -0.019648 & -0.2152 & 0.414978 \tabularnewline
43 & -0.036764 & -0.4027 & 0.343931 \tabularnewline
44 & -0.02588 & -0.2835 & 0.388639 \tabularnewline
45 & -0.015079 & -0.1652 & 0.434541 \tabularnewline
46 & 0.084164 & 0.922 & 0.179198 \tabularnewline
47 & -0.043008 & -0.4711 & 0.319204 \tabularnewline
48 & -0.022978 & -0.2517 & 0.400848 \tabularnewline
\hline
\end{tabular}
%Source: https://freestatistics.org/blog/index.php?pk=64295&T=2

[TABLE]
[ROW][C]Partial Autocorrelation Function[/C][/ROW]
[ROW][C]Time lag k[/C][C]PACF(k)[/C][C]T-STAT[/C][C]P-value[/C][/ROW]
[ROW][C]1[/C][C]0.974718[/C][C]10.6775[/C][C]0[/C][/ROW]
[ROW][C]2[/C][C]-0.018922[/C][C]-0.2073[/C][C]0.418072[/C][/ROW]
[ROW][C]3[/C][C]-0.016454[/C][C]-0.1802[/C][C]0.428632[/C][/ROW]
[ROW][C]4[/C][C]0.025235[/C][C]0.2764[/C][C]0.391346[/C][/ROW]
[ROW][C]5[/C][C]-0.006964[/C][C]-0.0763[/C][C]0.46966[/C][/ROW]
[ROW][C]6[/C][C]-0.015036[/C][C]-0.1647[/C][C]0.434723[/C][/ROW]
[ROW][C]7[/C][C]-0.026952[/C][C]-0.2952[/C][C]0.384161[/C][/ROW]
[ROW][C]8[/C][C]-0.02488[/C][C]-0.2725[/C][C]0.392837[/C][/ROW]
[ROW][C]9[/C][C]0.014081[/C][C]0.1542[/C][C]0.438838[/C][/ROW]
[ROW][C]10[/C][C]-0.07437[/C][C]-0.8147[/C][C]0.208433[/C][/ROW]
[ROW][C]11[/C][C]-0.022836[/C][C]-0.2502[/C][C]0.401448[/C][/ROW]
[ROW][C]12[/C][C]0.028661[/C][C]0.314[/C][C]0.377045[/C][/ROW]
[ROW][C]13[/C][C]-0.04912[/C][C]-0.5381[/C][C]0.295758[/C][/ROW]
[ROW][C]14[/C][C]-0.033811[/C][C]-0.3704[/C][C]0.355877[/C][/ROW]
[ROW][C]15[/C][C]-0.017667[/C][C]-0.1935[/C][C]0.423434[/C][/ROW]
[ROW][C]16[/C][C]0.052942[/C][C]0.5799[/C][C]0.281519[/C][/ROW]
[ROW][C]17[/C][C]-0.007529[/C][C]-0.0825[/C][C]0.467201[/C][/ROW]
[ROW][C]18[/C][C]-0.045858[/C][C]-0.5024[/C][C]0.30817[/C][/ROW]
[ROW][C]19[/C][C]-0.035761[/C][C]-0.3917[/C][C]0.34797[/C][/ROW]
[ROW][C]20[/C][C]-0.018533[/C][C]-0.203[/C][C]0.419731[/C][/ROW]
[ROW][C]21[/C][C]0.020476[/C][C]0.2243[/C][C]0.41145[/C][/ROW]
[ROW][C]22[/C][C]0.00092[/C][C]0.0101[/C][C]0.495987[/C][/ROW]
[ROW][C]23[/C][C]-0.003129[/C][C]-0.0343[/C][C]0.486355[/C][/ROW]
[ROW][C]24[/C][C]-0.014797[/C][C]-0.1621[/C][C]0.435751[/C][/ROW]
[ROW][C]25[/C][C]-0.034669[/C][C]-0.3798[/C][C]0.352388[/C][/ROW]
[ROW][C]26[/C][C]-0.027881[/C][C]-0.3054[/C][C]0.380287[/C][/ROW]
[ROW][C]27[/C][C]-0.062487[/C][C]-0.6845[/C][C]0.247486[/C][/ROW]
[ROW][C]28[/C][C]0.010794[/C][C]0.1182[/C][C]0.453036[/C][/ROW]
[ROW][C]29[/C][C]-0.0322[/C][C]-0.3527[/C][C]0.362454[/C][/ROW]
[ROW][C]30[/C][C]-0.029534[/C][C]-0.3235[/C][C]0.373429[/C][/ROW]
[ROW][C]31[/C][C]-0.042336[/C][C]-0.4638[/C][C]0.321827[/C][/ROW]
[ROW][C]32[/C][C]-0.043082[/C][C]-0.4719[/C][C]0.318915[/C][/ROW]
[ROW][C]33[/C][C]0.002536[/C][C]0.0278[/C][C]0.488944[/C][/ROW]
[ROW][C]34[/C][C]0.088931[/C][C]0.9742[/C][C]0.165962[/C][/ROW]
[ROW][C]35[/C][C]-0.017594[/C][C]-0.1927[/C][C]0.423747[/C][/ROW]
[ROW][C]36[/C][C]0.069205[/C][C]0.7581[/C][C]0.224939[/C][/ROW]
[ROW][C]37[/C][C]-0.015162[/C][C]-0.1661[/C][C]0.434181[/C][/ROW]
[ROW][C]38[/C][C]-0.031711[/C][C]-0.3474[/C][C]0.364457[/C][/ROW]
[ROW][C]39[/C][C]-0.001252[/C][C]-0.0137[/C][C]0.494541[/C][/ROW]
[ROW][C]40[/C][C]0.009824[/C][C]0.1076[/C][C]0.457242[/C][/ROW]
[ROW][C]41[/C][C]-0.01613[/C][C]-0.1767[/C][C]0.430023[/C][/ROW]
[ROW][C]42[/C][C]-0.019648[/C][C]-0.2152[/C][C]0.414978[/C][/ROW]
[ROW][C]43[/C][C]-0.036764[/C][C]-0.4027[/C][C]0.343931[/C][/ROW]
[ROW][C]44[/C][C]-0.02588[/C][C]-0.2835[/C][C]0.388639[/C][/ROW]
[ROW][C]45[/C][C]-0.015079[/C][C]-0.1652[/C][C]0.434541[/C][/ROW]
[ROW][C]46[/C][C]0.084164[/C][C]0.922[/C][C]0.179198[/C][/ROW]
[ROW][C]47[/C][C]-0.043008[/C][C]-0.4711[/C][C]0.319204[/C][/ROW]
[ROW][C]48[/C][C]-0.022978[/C][C]-0.2517[/C][C]0.400848[/C][/ROW]
[/TABLE]
Source: https://freestatistics.org/blog/index.php?pk=64295&T=2

Globally Unique Identifier (entire table): ba.freestatistics.org/blog/index.php?pk=64295&T=2

As an alternative you can also use a QR Code:  

The GUIDs for individual cells are displayed in the table below:

Partial Autocorrelation Function
Time lag kPACF(k)T-STATP-value
10.97471810.67750
2-0.018922-0.20730.418072
3-0.016454-0.18020.428632
40.0252350.27640.391346
5-0.006964-0.07630.46966
6-0.015036-0.16470.434723
7-0.026952-0.29520.384161
8-0.02488-0.27250.392837
90.0140810.15420.438838
10-0.07437-0.81470.208433
11-0.022836-0.25020.401448
120.0286610.3140.377045
13-0.04912-0.53810.295758
14-0.033811-0.37040.355877
15-0.017667-0.19350.423434
160.0529420.57990.281519
17-0.007529-0.08250.467201
18-0.045858-0.50240.30817
19-0.035761-0.39170.34797
20-0.018533-0.2030.419731
210.0204760.22430.41145
220.000920.01010.495987
23-0.003129-0.03430.486355
24-0.014797-0.16210.435751
25-0.034669-0.37980.352388
26-0.027881-0.30540.380287
27-0.062487-0.68450.247486
280.0107940.11820.453036
29-0.0322-0.35270.362454
30-0.029534-0.32350.373429
31-0.042336-0.46380.321827
32-0.043082-0.47190.318915
330.0025360.02780.488944
340.0889310.97420.165962
35-0.017594-0.19270.423747
360.0692050.75810.224939
37-0.015162-0.16610.434181
38-0.031711-0.34740.364457
39-0.001252-0.01370.494541
400.0098240.10760.457242
41-0.01613-0.17670.430023
42-0.019648-0.21520.414978
43-0.036764-0.40270.343931
44-0.02588-0.28350.388639
45-0.015079-0.16520.434541
460.0841640.9220.179198
47-0.043008-0.47110.319204
48-0.022978-0.25170.400848


Parameters (Session):
par1 = 48 ; par2 = 1 ; par3 = 0 ; par4 = 0 ; par5 = 12 ; par6 = White Noise ; par7 = 0.95 ;
Parameters (R input):
par1 = 48 ; par2 = 1 ; par3 = 0 ; par4 = 0 ; par5 = 12 ; par6 = White Noise ; par7 = 0.95 ;
R code (references can be found in the software module):
if (par1 == 'Default') {
par1 = 10*log10(length(x))
} else {
par1 <- as.numeric(par1)
}
par2 <- as.numeric(par2)
par3 <- as.numeric(par3)
par4 <- as.numeric(par4)
par5 <- as.numeric(par5)
if (par6 == 'White Noise') par6 <- 'white' else par6 <- 'ma'
par7 <- as.numeric(par7)
if (par2 == 0) {
x <- log(x)
} else {
x <- (x ^ par2 - 1) / par2
}
if (par3 > 0) x <- diff(x,lag=1,difference=par3)
if (par4 > 0) x <- diff(x,lag=par5,difference=par4)
bitmap(file='pic1.png')
racf <- acf(x, par1, main='Autocorrelation', xlab='time lag', ylab='ACF', ci.type=par6, ci=par7, sub=paste('(lambda=',par2,', d=',par3,', D=',par4,', CI=', par7, ', CI type=',par6,')',sep=''))
dev.off()
bitmap(file='pic2.png')
rpacf <- pacf(x,par1,main='Partial Autocorrelation',xlab='lags',ylab='PACF')
dev.off()
(myacf <- c(racf$acf))
(mypacf <- c(rpacf$acf))
lengthx <- length(x)
sqrtn <- sqrt(lengthx)
load(file='createtable')
a<-table.start()
a<-table.row.start(a)
a<-table.element(a,'Autocorrelation Function',4,TRUE)
a<-table.row.end(a)
a<-table.row.start(a)
a<-table.element(a,'Time lag k',header=TRUE)
a<-table.element(a,hyperlink('basics.htm','ACF(k)','click here for more information about the Autocorrelation Function'),header=TRUE)
a<-table.element(a,'T-STAT',header=TRUE)
a<-table.element(a,'P-value',header=TRUE)
a<-table.row.end(a)
for (i in 2:(par1+1)) {
a<-table.row.start(a)
a<-table.element(a,i-1,header=TRUE)
a<-table.element(a,round(myacf[i],6))
mytstat <- myacf[i]*sqrtn
a<-table.element(a,round(mytstat,4))
a<-table.element(a,round(1-pt(abs(mytstat),lengthx),6))
a<-table.row.end(a)
}
a<-table.end(a)
table.save(a,file='mytable.tab')
a<-table.start()
a<-table.row.start(a)
a<-table.element(a,'Partial Autocorrelation Function',4,TRUE)
a<-table.row.end(a)
a<-table.row.start(a)
a<-table.element(a,'Time lag k',header=TRUE)
a<-table.element(a,hyperlink('basics.htm','PACF(k)','click here for more information about the Partial Autocorrelation Function'),header=TRUE)
a<-table.element(a,'T-STAT',header=TRUE)
a<-table.element(a,'P-value',header=TRUE)
a<-table.row.end(a)
for (i in 1:par1) {
a<-table.row.start(a)
a<-table.element(a,i,header=TRUE)
a<-table.element(a,round(mypacf[i],6))
mytstat <- mypacf[i]*sqrtn
a<-table.element(a,round(mytstat,4))
a<-table.element(a,round(1-pt(abs(mytstat),lengthx),6))
a<-table.row.end(a)
}
a<-table.end(a)
table.save(a,file='mytable1.tab')