Free Statistics

of Irreproducible Research!

Author's title

Author*Unverified author*
R Software Modulerwasp_autocorrelation.wasp
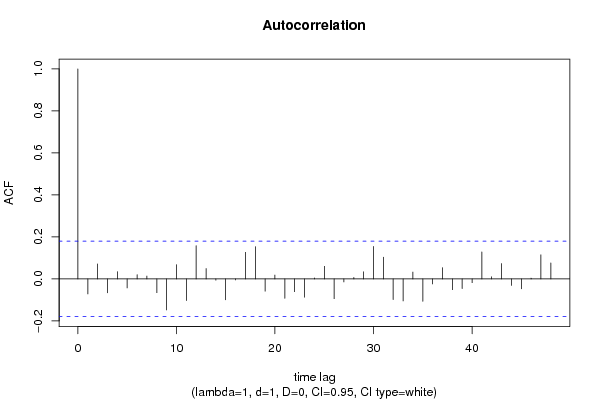
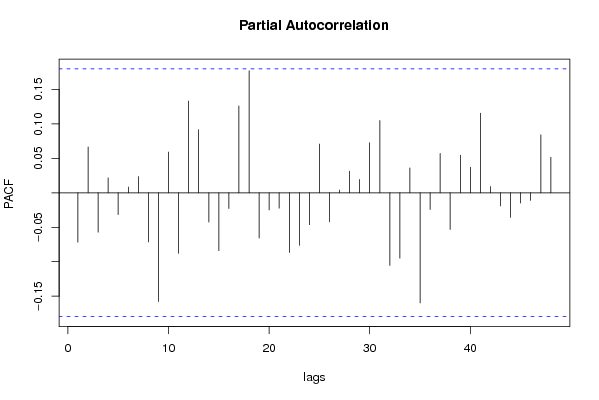
Title produced by software(Partial) Autocorrelation Function
Date of computationSat, 05 Dec 2009 11:26:29 -0700
Cite this page as followsStatistical Computations at FreeStatistics.org, Office for Research Development and Education, URL https://freestatistics.org/blog/index.php?v=date/2009/Dec/05/t1260037704ry0mo1x2ph5g9dz.htm/, Retrieved Tue, 30 Apr 2024 02:03:45 +0000
Statistical Computations at FreeStatistics.org, Office for Research Development and Education, URL https://freestatistics.org/blog/index.php?pk=64297, Retrieved Tue, 30 Apr 2024 02:03:45 +0000
QR Codes:

Original text written by user:
IsPrivate?No (this computation is public)
User-defined keywordsKDGP2W21
Estimated Impact134
Family? (F = Feedback message, R = changed R code, M = changed R Module, P = changed Parameters, D = changed Data)
-     [(Partial) Autocorrelation Function] [Opgave 6 bis] [2009-12-05 17:52:39] [101768e0846f790d4a51eca83c4a4208]
-   PD    [(Partial) Autocorrelation Function] [oefening 6 bis] [2009-12-05 18:26:29] [f8fa19533df6d92688ec2c19e4765e3f] [Current]
Feedback Forum

Post a new message
Dataseries X:
161.88
162.05
162.16
162.61
162.53
162.53
162.53
162.53
162.83
161.61
161.79
161.79
161.79
161.79
161.85
161.77
161.86
161.89
161.89
161.89
162.18
162.43
162.58
162.57
162.57
162.57
162.44
162.79
163.15
163.23
163.23
163.23
163.38
163.71
163.73
163.73
163.73
163.73
163.93
164.27
164.57
164.73
164.73
164.76
165.75
165.86
165.99
166.13
166.13
166.13
166.15
166.45
166.48
166.51
166.51
166.51
166.58
166.82
167.35
167.5
167.5
167.6
167.72
167.29
166.98
166.98
166.98
166.98
167.63
167.83
167.85
167.87
167.87
167.96
167.7
169.25
168.79
168.77
168.77
169
168.92
169.23
169.28
169.29
169.29
170.29
170.59
171.98
172.31
172.28
172.28
172.45
172.27
172.65
172.08
172.2
172.2
172.2
172.36
172.53
173.18
173.17
173.17
173.17
173.4
174.47
174.56
174.59
174.59
175.22
175.3
175.25
175.54
175.58
175.58
175.68
176.05
176.4
176.58
176.49


Summary of computational transaction
Raw Inputview raw input (R code)
Raw Outputview raw output of R engine
Computing time2 seconds
R Server'Gwilym Jenkins' @ 72.249.127.135

\begin{tabular}{lllllllll}
\hline
Summary of computational transaction \tabularnewline
Raw Input & view raw input (R code)  \tabularnewline
Raw Output & view raw output of R engine  \tabularnewline
Computing time & 2 seconds \tabularnewline
R Server & 'Gwilym Jenkins' @ 72.249.127.135 \tabularnewline
\hline
\end{tabular}
%Source: https://freestatistics.org/blog/index.php?pk=64297&T=0

[TABLE]
[ROW][C]Summary of computational transaction[/C][/ROW]
[ROW][C]Raw Input[/C][C]view raw input (R code) [/C][/ROW]
[ROW][C]Raw Output[/C][C]view raw output of R engine [/C][/ROW]
[ROW][C]Computing time[/C][C]2 seconds[/C][/ROW]
[ROW][C]R Server[/C][C]'Gwilym Jenkins' @ 72.249.127.135[/C][/ROW]
[/TABLE]
Source: https://freestatistics.org/blog/index.php?pk=64297&T=0

Globally Unique Identifier (entire table): ba.freestatistics.org/blog/index.php?pk=64297&T=0

As an alternative you can also use a QR Code:  

The GUIDs for individual cells are displayed in the table below:

Summary of computational transaction
Raw Inputview raw input (R code)
Raw Outputview raw output of R engine
Computing time2 seconds
R Server'Gwilym Jenkins' @ 72.249.127.135


Autocorrelation Function
Time lag kACF(k)T-STATP-value
1-0.07161-0.78120.218127
20.0713960.77880.218809
3-0.066218-0.72240.235746
40.0342650.37380.354616
5-0.042815-0.46710.320658
60.0200540.21880.413603
70.0134680.14690.441724
8-0.06559-0.71550.237849
9-0.147768-1.6120.05481
100.0675980.73740.231162
11-0.103284-1.12670.13107
120.1583821.72770.043314
130.049370.53860.295596
14-0.00587-0.0640.474523
15-0.099648-1.0870.139609
16-0.005027-0.05480.478178
170.1268221.38350.084557
180.153431.67370.048406
19-0.058285-0.63580.263059
200.0183380.20.420893
21-0.092184-1.00560.158323
22-0.060932-0.66470.253769
23-0.086726-0.94610.173015
240.004560.04970.480204
250.0603580.65840.255766
26-0.094335-1.02910.152767
27-0.014513-0.15830.437236
280.0071190.07770.469113
290.0341780.37280.354968
300.1549711.69050.046772
310.1036891.13110.13014
32-0.09857-1.07530.142214
33-0.104742-1.14260.127749
340.0326890.35660.361013
35-0.106512-1.16190.1238
36-0.02361-0.25760.398596
370.0535560.58420.280088
38-0.051538-0.56220.287515
39-0.045658-0.49810.309675
40-0.017738-0.19350.423448
410.128431.4010.081908
420.0101650.11090.455945
430.0729550.79580.213854
44-0.030903-0.33710.368313
45-0.046851-0.51110.30512
460.0038580.04210.483251
470.1146551.25070.106742
480.0762160.83140.203703

\begin{tabular}{lllllllll}
\hline
Autocorrelation Function \tabularnewline
Time lag k & ACF(k) & T-STAT & P-value \tabularnewline
1 & -0.07161 & -0.7812 & 0.218127 \tabularnewline
2 & 0.071396 & 0.7788 & 0.218809 \tabularnewline
3 & -0.066218 & -0.7224 & 0.235746 \tabularnewline
4 & 0.034265 & 0.3738 & 0.354616 \tabularnewline
5 & -0.042815 & -0.4671 & 0.320658 \tabularnewline
6 & 0.020054 & 0.2188 & 0.413603 \tabularnewline
7 & 0.013468 & 0.1469 & 0.441724 \tabularnewline
8 & -0.06559 & -0.7155 & 0.237849 \tabularnewline
9 & -0.147768 & -1.612 & 0.05481 \tabularnewline
10 & 0.067598 & 0.7374 & 0.231162 \tabularnewline
11 & -0.103284 & -1.1267 & 0.13107 \tabularnewline
12 & 0.158382 & 1.7277 & 0.043314 \tabularnewline
13 & 0.04937 & 0.5386 & 0.295596 \tabularnewline
14 & -0.00587 & -0.064 & 0.474523 \tabularnewline
15 & -0.099648 & -1.087 & 0.139609 \tabularnewline
16 & -0.005027 & -0.0548 & 0.478178 \tabularnewline
17 & 0.126822 & 1.3835 & 0.084557 \tabularnewline
18 & 0.15343 & 1.6737 & 0.048406 \tabularnewline
19 & -0.058285 & -0.6358 & 0.263059 \tabularnewline
20 & 0.018338 & 0.2 & 0.420893 \tabularnewline
21 & -0.092184 & -1.0056 & 0.158323 \tabularnewline
22 & -0.060932 & -0.6647 & 0.253769 \tabularnewline
23 & -0.086726 & -0.9461 & 0.173015 \tabularnewline
24 & 0.00456 & 0.0497 & 0.480204 \tabularnewline
25 & 0.060358 & 0.6584 & 0.255766 \tabularnewline
26 & -0.094335 & -1.0291 & 0.152767 \tabularnewline
27 & -0.014513 & -0.1583 & 0.437236 \tabularnewline
28 & 0.007119 & 0.0777 & 0.469113 \tabularnewline
29 & 0.034178 & 0.3728 & 0.354968 \tabularnewline
30 & 0.154971 & 1.6905 & 0.046772 \tabularnewline
31 & 0.103689 & 1.1311 & 0.13014 \tabularnewline
32 & -0.09857 & -1.0753 & 0.142214 \tabularnewline
33 & -0.104742 & -1.1426 & 0.127749 \tabularnewline
34 & 0.032689 & 0.3566 & 0.361013 \tabularnewline
35 & -0.106512 & -1.1619 & 0.1238 \tabularnewline
36 & -0.02361 & -0.2576 & 0.398596 \tabularnewline
37 & 0.053556 & 0.5842 & 0.280088 \tabularnewline
38 & -0.051538 & -0.5622 & 0.287515 \tabularnewline
39 & -0.045658 & -0.4981 & 0.309675 \tabularnewline
40 & -0.017738 & -0.1935 & 0.423448 \tabularnewline
41 & 0.12843 & 1.401 & 0.081908 \tabularnewline
42 & 0.010165 & 0.1109 & 0.455945 \tabularnewline
43 & 0.072955 & 0.7958 & 0.213854 \tabularnewline
44 & -0.030903 & -0.3371 & 0.368313 \tabularnewline
45 & -0.046851 & -0.5111 & 0.30512 \tabularnewline
46 & 0.003858 & 0.0421 & 0.483251 \tabularnewline
47 & 0.114655 & 1.2507 & 0.106742 \tabularnewline
48 & 0.076216 & 0.8314 & 0.203703 \tabularnewline
\hline
\end{tabular}
%Source: https://freestatistics.org/blog/index.php?pk=64297&T=1

[TABLE]
[ROW][C]Autocorrelation Function[/C][/ROW]
[ROW][C]Time lag k[/C][C]ACF(k)[/C][C]T-STAT[/C][C]P-value[/C][/ROW]
[ROW][C]1[/C][C]-0.07161[/C][C]-0.7812[/C][C]0.218127[/C][/ROW]
[ROW][C]2[/C][C]0.071396[/C][C]0.7788[/C][C]0.218809[/C][/ROW]
[ROW][C]3[/C][C]-0.066218[/C][C]-0.7224[/C][C]0.235746[/C][/ROW]
[ROW][C]4[/C][C]0.034265[/C][C]0.3738[/C][C]0.354616[/C][/ROW]
[ROW][C]5[/C][C]-0.042815[/C][C]-0.4671[/C][C]0.320658[/C][/ROW]
[ROW][C]6[/C][C]0.020054[/C][C]0.2188[/C][C]0.413603[/C][/ROW]
[ROW][C]7[/C][C]0.013468[/C][C]0.1469[/C][C]0.441724[/C][/ROW]
[ROW][C]8[/C][C]-0.06559[/C][C]-0.7155[/C][C]0.237849[/C][/ROW]
[ROW][C]9[/C][C]-0.147768[/C][C]-1.612[/C][C]0.05481[/C][/ROW]
[ROW][C]10[/C][C]0.067598[/C][C]0.7374[/C][C]0.231162[/C][/ROW]
[ROW][C]11[/C][C]-0.103284[/C][C]-1.1267[/C][C]0.13107[/C][/ROW]
[ROW][C]12[/C][C]0.158382[/C][C]1.7277[/C][C]0.043314[/C][/ROW]
[ROW][C]13[/C][C]0.04937[/C][C]0.5386[/C][C]0.295596[/C][/ROW]
[ROW][C]14[/C][C]-0.00587[/C][C]-0.064[/C][C]0.474523[/C][/ROW]
[ROW][C]15[/C][C]-0.099648[/C][C]-1.087[/C][C]0.139609[/C][/ROW]
[ROW][C]16[/C][C]-0.005027[/C][C]-0.0548[/C][C]0.478178[/C][/ROW]
[ROW][C]17[/C][C]0.126822[/C][C]1.3835[/C][C]0.084557[/C][/ROW]
[ROW][C]18[/C][C]0.15343[/C][C]1.6737[/C][C]0.048406[/C][/ROW]
[ROW][C]19[/C][C]-0.058285[/C][C]-0.6358[/C][C]0.263059[/C][/ROW]
[ROW][C]20[/C][C]0.018338[/C][C]0.2[/C][C]0.420893[/C][/ROW]
[ROW][C]21[/C][C]-0.092184[/C][C]-1.0056[/C][C]0.158323[/C][/ROW]
[ROW][C]22[/C][C]-0.060932[/C][C]-0.6647[/C][C]0.253769[/C][/ROW]
[ROW][C]23[/C][C]-0.086726[/C][C]-0.9461[/C][C]0.173015[/C][/ROW]
[ROW][C]24[/C][C]0.00456[/C][C]0.0497[/C][C]0.480204[/C][/ROW]
[ROW][C]25[/C][C]0.060358[/C][C]0.6584[/C][C]0.255766[/C][/ROW]
[ROW][C]26[/C][C]-0.094335[/C][C]-1.0291[/C][C]0.152767[/C][/ROW]
[ROW][C]27[/C][C]-0.014513[/C][C]-0.1583[/C][C]0.437236[/C][/ROW]
[ROW][C]28[/C][C]0.007119[/C][C]0.0777[/C][C]0.469113[/C][/ROW]
[ROW][C]29[/C][C]0.034178[/C][C]0.3728[/C][C]0.354968[/C][/ROW]
[ROW][C]30[/C][C]0.154971[/C][C]1.6905[/C][C]0.046772[/C][/ROW]
[ROW][C]31[/C][C]0.103689[/C][C]1.1311[/C][C]0.13014[/C][/ROW]
[ROW][C]32[/C][C]-0.09857[/C][C]-1.0753[/C][C]0.142214[/C][/ROW]
[ROW][C]33[/C][C]-0.104742[/C][C]-1.1426[/C][C]0.127749[/C][/ROW]
[ROW][C]34[/C][C]0.032689[/C][C]0.3566[/C][C]0.361013[/C][/ROW]
[ROW][C]35[/C][C]-0.106512[/C][C]-1.1619[/C][C]0.1238[/C][/ROW]
[ROW][C]36[/C][C]-0.02361[/C][C]-0.2576[/C][C]0.398596[/C][/ROW]
[ROW][C]37[/C][C]0.053556[/C][C]0.5842[/C][C]0.280088[/C][/ROW]
[ROW][C]38[/C][C]-0.051538[/C][C]-0.5622[/C][C]0.287515[/C][/ROW]
[ROW][C]39[/C][C]-0.045658[/C][C]-0.4981[/C][C]0.309675[/C][/ROW]
[ROW][C]40[/C][C]-0.017738[/C][C]-0.1935[/C][C]0.423448[/C][/ROW]
[ROW][C]41[/C][C]0.12843[/C][C]1.401[/C][C]0.081908[/C][/ROW]
[ROW][C]42[/C][C]0.010165[/C][C]0.1109[/C][C]0.455945[/C][/ROW]
[ROW][C]43[/C][C]0.072955[/C][C]0.7958[/C][C]0.213854[/C][/ROW]
[ROW][C]44[/C][C]-0.030903[/C][C]-0.3371[/C][C]0.368313[/C][/ROW]
[ROW][C]45[/C][C]-0.046851[/C][C]-0.5111[/C][C]0.30512[/C][/ROW]
[ROW][C]46[/C][C]0.003858[/C][C]0.0421[/C][C]0.483251[/C][/ROW]
[ROW][C]47[/C][C]0.114655[/C][C]1.2507[/C][C]0.106742[/C][/ROW]
[ROW][C]48[/C][C]0.076216[/C][C]0.8314[/C][C]0.203703[/C][/ROW]
[/TABLE]
Source: https://freestatistics.org/blog/index.php?pk=64297&T=1

Globally Unique Identifier (entire table): ba.freestatistics.org/blog/index.php?pk=64297&T=1

As an alternative you can also use a QR Code:  

The GUIDs for individual cells are displayed in the table below:

Autocorrelation Function
Time lag kACF(k)T-STATP-value
1-0.07161-0.78120.218127
20.0713960.77880.218809
3-0.066218-0.72240.235746
40.0342650.37380.354616
5-0.042815-0.46710.320658
60.0200540.21880.413603
70.0134680.14690.441724
8-0.06559-0.71550.237849
9-0.147768-1.6120.05481
100.0675980.73740.231162
11-0.103284-1.12670.13107
120.1583821.72770.043314
130.049370.53860.295596
14-0.00587-0.0640.474523
15-0.099648-1.0870.139609
16-0.005027-0.05480.478178
170.1268221.38350.084557
180.153431.67370.048406
19-0.058285-0.63580.263059
200.0183380.20.420893
21-0.092184-1.00560.158323
22-0.060932-0.66470.253769
23-0.086726-0.94610.173015
240.004560.04970.480204
250.0603580.65840.255766
26-0.094335-1.02910.152767
27-0.014513-0.15830.437236
280.0071190.07770.469113
290.0341780.37280.354968
300.1549711.69050.046772
310.1036891.13110.13014
32-0.09857-1.07530.142214
33-0.104742-1.14260.127749
340.0326890.35660.361013
35-0.106512-1.16190.1238
36-0.02361-0.25760.398596
370.0535560.58420.280088
38-0.051538-0.56220.287515
39-0.045658-0.49810.309675
40-0.017738-0.19350.423448
410.128431.4010.081908
420.0101650.11090.455945
430.0729550.79580.213854
44-0.030903-0.33710.368313
45-0.046851-0.51110.30512
460.0038580.04210.483251
470.1146551.25070.106742
480.0762160.83140.203703


Partial Autocorrelation Function
Time lag kPACF(k)T-STATP-value
1-0.07161-0.78120.218127
20.066610.72660.23444
3-0.057222-0.62420.266838
40.0217890.23770.406264
5-0.031501-0.34360.365865
60.008270.09020.464136
70.0234890.25620.399105
8-0.071203-0.77670.219428
9-0.157838-1.72180.043851
100.0591550.64530.259987
11-0.087716-0.95690.170287
120.1330461.45140.074656
130.0915240.99840.160052
14-0.042534-0.4640.321752
15-0.08398-0.91610.180731
16-0.02263-0.24690.402719
170.1260321.37480.085881
180.1771541.93250.027836
19-0.065671-0.71640.237577
20-0.024912-0.27180.393138
21-0.022282-0.24310.404187
22-0.086745-0.94630.172962
23-0.076194-0.83120.203769
24-0.046289-0.5050.307263
250.0706770.7710.221118
26-0.042069-0.45890.323564
270.0039710.04330.48276
280.0312910.34130.366723
290.0193380.2110.416641
300.0724950.79080.215308
310.1047291.14250.127779
32-0.105327-1.1490.126434
33-0.094816-1.03430.151541
340.0360030.39270.347607
35-0.159844-1.74370.041898
36-0.024051-0.26240.396747
370.0570780.62260.267353
38-0.053157-0.57990.281547
390.0546070.59570.276255
400.0371630.40540.342957
410.1155611.26060.104955
420.0090970.09920.46056
43-0.019153-0.20890.41743
44-0.035715-0.38960.348764
45-0.014886-0.16240.435638
46-0.011007-0.12010.452314
470.0840590.9170.180504
480.0513910.56060.288059

\begin{tabular}{lllllllll}
\hline
Partial Autocorrelation Function \tabularnewline
Time lag k & PACF(k) & T-STAT & P-value \tabularnewline
1 & -0.07161 & -0.7812 & 0.218127 \tabularnewline
2 & 0.06661 & 0.7266 & 0.23444 \tabularnewline
3 & -0.057222 & -0.6242 & 0.266838 \tabularnewline
4 & 0.021789 & 0.2377 & 0.406264 \tabularnewline
5 & -0.031501 & -0.3436 & 0.365865 \tabularnewline
6 & 0.00827 & 0.0902 & 0.464136 \tabularnewline
7 & 0.023489 & 0.2562 & 0.399105 \tabularnewline
8 & -0.071203 & -0.7767 & 0.219428 \tabularnewline
9 & -0.157838 & -1.7218 & 0.043851 \tabularnewline
10 & 0.059155 & 0.6453 & 0.259987 \tabularnewline
11 & -0.087716 & -0.9569 & 0.170287 \tabularnewline
12 & 0.133046 & 1.4514 & 0.074656 \tabularnewline
13 & 0.091524 & 0.9984 & 0.160052 \tabularnewline
14 & -0.042534 & -0.464 & 0.321752 \tabularnewline
15 & -0.08398 & -0.9161 & 0.180731 \tabularnewline
16 & -0.02263 & -0.2469 & 0.402719 \tabularnewline
17 & 0.126032 & 1.3748 & 0.085881 \tabularnewline
18 & 0.177154 & 1.9325 & 0.027836 \tabularnewline
19 & -0.065671 & -0.7164 & 0.237577 \tabularnewline
20 & -0.024912 & -0.2718 & 0.393138 \tabularnewline
21 & -0.022282 & -0.2431 & 0.404187 \tabularnewline
22 & -0.086745 & -0.9463 & 0.172962 \tabularnewline
23 & -0.076194 & -0.8312 & 0.203769 \tabularnewline
24 & -0.046289 & -0.505 & 0.307263 \tabularnewline
25 & 0.070677 & 0.771 & 0.221118 \tabularnewline
26 & -0.042069 & -0.4589 & 0.323564 \tabularnewline
27 & 0.003971 & 0.0433 & 0.48276 \tabularnewline
28 & 0.031291 & 0.3413 & 0.366723 \tabularnewline
29 & 0.019338 & 0.211 & 0.416641 \tabularnewline
30 & 0.072495 & 0.7908 & 0.215308 \tabularnewline
31 & 0.104729 & 1.1425 & 0.127779 \tabularnewline
32 & -0.105327 & -1.149 & 0.126434 \tabularnewline
33 & -0.094816 & -1.0343 & 0.151541 \tabularnewline
34 & 0.036003 & 0.3927 & 0.347607 \tabularnewline
35 & -0.159844 & -1.7437 & 0.041898 \tabularnewline
36 & -0.024051 & -0.2624 & 0.396747 \tabularnewline
37 & 0.057078 & 0.6226 & 0.267353 \tabularnewline
38 & -0.053157 & -0.5799 & 0.281547 \tabularnewline
39 & 0.054607 & 0.5957 & 0.276255 \tabularnewline
40 & 0.037163 & 0.4054 & 0.342957 \tabularnewline
41 & 0.115561 & 1.2606 & 0.104955 \tabularnewline
42 & 0.009097 & 0.0992 & 0.46056 \tabularnewline
43 & -0.019153 & -0.2089 & 0.41743 \tabularnewline
44 & -0.035715 & -0.3896 & 0.348764 \tabularnewline
45 & -0.014886 & -0.1624 & 0.435638 \tabularnewline
46 & -0.011007 & -0.1201 & 0.452314 \tabularnewline
47 & 0.084059 & 0.917 & 0.180504 \tabularnewline
48 & 0.051391 & 0.5606 & 0.288059 \tabularnewline
\hline
\end{tabular}
%Source: https://freestatistics.org/blog/index.php?pk=64297&T=2

[TABLE]
[ROW][C]Partial Autocorrelation Function[/C][/ROW]
[ROW][C]Time lag k[/C][C]PACF(k)[/C][C]T-STAT[/C][C]P-value[/C][/ROW]
[ROW][C]1[/C][C]-0.07161[/C][C]-0.7812[/C][C]0.218127[/C][/ROW]
[ROW][C]2[/C][C]0.06661[/C][C]0.7266[/C][C]0.23444[/C][/ROW]
[ROW][C]3[/C][C]-0.057222[/C][C]-0.6242[/C][C]0.266838[/C][/ROW]
[ROW][C]4[/C][C]0.021789[/C][C]0.2377[/C][C]0.406264[/C][/ROW]
[ROW][C]5[/C][C]-0.031501[/C][C]-0.3436[/C][C]0.365865[/C][/ROW]
[ROW][C]6[/C][C]0.00827[/C][C]0.0902[/C][C]0.464136[/C][/ROW]
[ROW][C]7[/C][C]0.023489[/C][C]0.2562[/C][C]0.399105[/C][/ROW]
[ROW][C]8[/C][C]-0.071203[/C][C]-0.7767[/C][C]0.219428[/C][/ROW]
[ROW][C]9[/C][C]-0.157838[/C][C]-1.7218[/C][C]0.043851[/C][/ROW]
[ROW][C]10[/C][C]0.059155[/C][C]0.6453[/C][C]0.259987[/C][/ROW]
[ROW][C]11[/C][C]-0.087716[/C][C]-0.9569[/C][C]0.170287[/C][/ROW]
[ROW][C]12[/C][C]0.133046[/C][C]1.4514[/C][C]0.074656[/C][/ROW]
[ROW][C]13[/C][C]0.091524[/C][C]0.9984[/C][C]0.160052[/C][/ROW]
[ROW][C]14[/C][C]-0.042534[/C][C]-0.464[/C][C]0.321752[/C][/ROW]
[ROW][C]15[/C][C]-0.08398[/C][C]-0.9161[/C][C]0.180731[/C][/ROW]
[ROW][C]16[/C][C]-0.02263[/C][C]-0.2469[/C][C]0.402719[/C][/ROW]
[ROW][C]17[/C][C]0.126032[/C][C]1.3748[/C][C]0.085881[/C][/ROW]
[ROW][C]18[/C][C]0.177154[/C][C]1.9325[/C][C]0.027836[/C][/ROW]
[ROW][C]19[/C][C]-0.065671[/C][C]-0.7164[/C][C]0.237577[/C][/ROW]
[ROW][C]20[/C][C]-0.024912[/C][C]-0.2718[/C][C]0.393138[/C][/ROW]
[ROW][C]21[/C][C]-0.022282[/C][C]-0.2431[/C][C]0.404187[/C][/ROW]
[ROW][C]22[/C][C]-0.086745[/C][C]-0.9463[/C][C]0.172962[/C][/ROW]
[ROW][C]23[/C][C]-0.076194[/C][C]-0.8312[/C][C]0.203769[/C][/ROW]
[ROW][C]24[/C][C]-0.046289[/C][C]-0.505[/C][C]0.307263[/C][/ROW]
[ROW][C]25[/C][C]0.070677[/C][C]0.771[/C][C]0.221118[/C][/ROW]
[ROW][C]26[/C][C]-0.042069[/C][C]-0.4589[/C][C]0.323564[/C][/ROW]
[ROW][C]27[/C][C]0.003971[/C][C]0.0433[/C][C]0.48276[/C][/ROW]
[ROW][C]28[/C][C]0.031291[/C][C]0.3413[/C][C]0.366723[/C][/ROW]
[ROW][C]29[/C][C]0.019338[/C][C]0.211[/C][C]0.416641[/C][/ROW]
[ROW][C]30[/C][C]0.072495[/C][C]0.7908[/C][C]0.215308[/C][/ROW]
[ROW][C]31[/C][C]0.104729[/C][C]1.1425[/C][C]0.127779[/C][/ROW]
[ROW][C]32[/C][C]-0.105327[/C][C]-1.149[/C][C]0.126434[/C][/ROW]
[ROW][C]33[/C][C]-0.094816[/C][C]-1.0343[/C][C]0.151541[/C][/ROW]
[ROW][C]34[/C][C]0.036003[/C][C]0.3927[/C][C]0.347607[/C][/ROW]
[ROW][C]35[/C][C]-0.159844[/C][C]-1.7437[/C][C]0.041898[/C][/ROW]
[ROW][C]36[/C][C]-0.024051[/C][C]-0.2624[/C][C]0.396747[/C][/ROW]
[ROW][C]37[/C][C]0.057078[/C][C]0.6226[/C][C]0.267353[/C][/ROW]
[ROW][C]38[/C][C]-0.053157[/C][C]-0.5799[/C][C]0.281547[/C][/ROW]
[ROW][C]39[/C][C]0.054607[/C][C]0.5957[/C][C]0.276255[/C][/ROW]
[ROW][C]40[/C][C]0.037163[/C][C]0.4054[/C][C]0.342957[/C][/ROW]
[ROW][C]41[/C][C]0.115561[/C][C]1.2606[/C][C]0.104955[/C][/ROW]
[ROW][C]42[/C][C]0.009097[/C][C]0.0992[/C][C]0.46056[/C][/ROW]
[ROW][C]43[/C][C]-0.019153[/C][C]-0.2089[/C][C]0.41743[/C][/ROW]
[ROW][C]44[/C][C]-0.035715[/C][C]-0.3896[/C][C]0.348764[/C][/ROW]
[ROW][C]45[/C][C]-0.014886[/C][C]-0.1624[/C][C]0.435638[/C][/ROW]
[ROW][C]46[/C][C]-0.011007[/C][C]-0.1201[/C][C]0.452314[/C][/ROW]
[ROW][C]47[/C][C]0.084059[/C][C]0.917[/C][C]0.180504[/C][/ROW]
[ROW][C]48[/C][C]0.051391[/C][C]0.5606[/C][C]0.288059[/C][/ROW]
[/TABLE]
Source: https://freestatistics.org/blog/index.php?pk=64297&T=2

Globally Unique Identifier (entire table): ba.freestatistics.org/blog/index.php?pk=64297&T=2

As an alternative you can also use a QR Code:  

The GUIDs for individual cells are displayed in the table below:

Partial Autocorrelation Function
Time lag kPACF(k)T-STATP-value
1-0.07161-0.78120.218127
20.066610.72660.23444
3-0.057222-0.62420.266838
40.0217890.23770.406264
5-0.031501-0.34360.365865
60.008270.09020.464136
70.0234890.25620.399105
8-0.071203-0.77670.219428
9-0.157838-1.72180.043851
100.0591550.64530.259987
11-0.087716-0.95690.170287
120.1330461.45140.074656
130.0915240.99840.160052
14-0.042534-0.4640.321752
15-0.08398-0.91610.180731
16-0.02263-0.24690.402719
170.1260321.37480.085881
180.1771541.93250.027836
19-0.065671-0.71640.237577
20-0.024912-0.27180.393138
21-0.022282-0.24310.404187
22-0.086745-0.94630.172962
23-0.076194-0.83120.203769
24-0.046289-0.5050.307263
250.0706770.7710.221118
26-0.042069-0.45890.323564
270.0039710.04330.48276
280.0312910.34130.366723
290.0193380.2110.416641
300.0724950.79080.215308
310.1047291.14250.127779
32-0.105327-1.1490.126434
33-0.094816-1.03430.151541
340.0360030.39270.347607
35-0.159844-1.74370.041898
36-0.024051-0.26240.396747
370.0570780.62260.267353
38-0.053157-0.57990.281547
390.0546070.59570.276255
400.0371630.40540.342957
410.1155611.26060.104955
420.0090970.09920.46056
43-0.019153-0.20890.41743
44-0.035715-0.38960.348764
45-0.014886-0.16240.435638
46-0.011007-0.12010.452314
470.0840590.9170.180504
480.0513910.56060.288059


Parameters (Session):
par1 = 48 ; par2 = 1 ; par3 = 1 ; par4 = 0 ; par5 = 12 ; par6 = White Noise ; par7 = 0.95 ;
Parameters (R input):
par1 = 48 ; par2 = 1 ; par3 = 1 ; par4 = 0 ; par5 = 12 ; par6 = White Noise ; par7 = 0.95 ;
R code (references can be found in the software module):
if (par1 == 'Default') {
par1 = 10*log10(length(x))
} else {
par1 <- as.numeric(par1)
}
par2 <- as.numeric(par2)
par3 <- as.numeric(par3)
par4 <- as.numeric(par4)
par5 <- as.numeric(par5)
if (par6 == 'White Noise') par6 <- 'white' else par6 <- 'ma'
par7 <- as.numeric(par7)
if (par2 == 0) {
x <- log(x)
} else {
x <- (x ^ par2 - 1) / par2
}
if (par3 > 0) x <- diff(x,lag=1,difference=par3)
if (par4 > 0) x <- diff(x,lag=par5,difference=par4)
bitmap(file='pic1.png')
racf <- acf(x, par1, main='Autocorrelation', xlab='time lag', ylab='ACF', ci.type=par6, ci=par7, sub=paste('(lambda=',par2,', d=',par3,', D=',par4,', CI=', par7, ', CI type=',par6,')',sep=''))
dev.off()
bitmap(file='pic2.png')
rpacf <- pacf(x,par1,main='Partial Autocorrelation',xlab='lags',ylab='PACF')
dev.off()
(myacf <- c(racf$acf))
(mypacf <- c(rpacf$acf))
lengthx <- length(x)
sqrtn <- sqrt(lengthx)
load(file='createtable')
a<-table.start()
a<-table.row.start(a)
a<-table.element(a,'Autocorrelation Function',4,TRUE)
a<-table.row.end(a)
a<-table.row.start(a)
a<-table.element(a,'Time lag k',header=TRUE)
a<-table.element(a,hyperlink('basics.htm','ACF(k)','click here for more information about the Autocorrelation Function'),header=TRUE)
a<-table.element(a,'T-STAT',header=TRUE)
a<-table.element(a,'P-value',header=TRUE)
a<-table.row.end(a)
for (i in 2:(par1+1)) {
a<-table.row.start(a)
a<-table.element(a,i-1,header=TRUE)
a<-table.element(a,round(myacf[i],6))
mytstat <- myacf[i]*sqrtn
a<-table.element(a,round(mytstat,4))
a<-table.element(a,round(1-pt(abs(mytstat),lengthx),6))
a<-table.row.end(a)
}
a<-table.end(a)
table.save(a,file='mytable.tab')
a<-table.start()
a<-table.row.start(a)
a<-table.element(a,'Partial Autocorrelation Function',4,TRUE)
a<-table.row.end(a)
a<-table.row.start(a)
a<-table.element(a,'Time lag k',header=TRUE)
a<-table.element(a,hyperlink('basics.htm','PACF(k)','click here for more information about the Partial Autocorrelation Function'),header=TRUE)
a<-table.element(a,'T-STAT',header=TRUE)
a<-table.element(a,'P-value',header=TRUE)
a<-table.row.end(a)
for (i in 1:par1) {
a<-table.row.start(a)
a<-table.element(a,i,header=TRUE)
a<-table.element(a,round(mypacf[i],6))
mytstat <- mypacf[i]*sqrtn
a<-table.element(a,round(mytstat,4))
a<-table.element(a,round(1-pt(abs(mytstat),lengthx),6))
a<-table.row.end(a)
}
a<-table.end(a)
table.save(a,file='mytable1.tab')