Free Statistics

of Irreproducible Research!

Author's title

Author*The author of this computation has been verified*
R Software Modulerwasp_autocorrelation.wasp
Title produced by software(Partial) Autocorrelation Function
Date of computationSat, 05 Dec 2009 14:12:51 -0700
Cite this page as followsStatistical Computations at FreeStatistics.org, Office for Research Development and Education, URL https://freestatistics.org/blog/index.php?v=date/2009/Dec/05/t1260047640f8t0kdv01317o5a.htm/, Retrieved Tue, 30 Apr 2024 03:28:55 +0000
Statistical Computations at FreeStatistics.org, Office for Research Development and Education, URL https://freestatistics.org/blog/index.php?pk=64315, Retrieved Tue, 30 Apr 2024 03:28:55 +0000
QR Codes:

Original text written by user:
IsPrivate?No (this computation is public)
User-defined keywords
Estimated Impact146
Family? (F = Feedback message, R = changed R code, M = changed R Module, P = changed Parameters, D = changed Data)
-     [Univariate Data Series] [] [2009-11-25 09:31:30] [1eac2882020791f6c49a90a91c34285a]
- RMP   [Standard Deviation-Mean Plot] [] [2009-12-05 20:25:58] [3daae06e609b839af47edc9c5015e41f]
- RMP       [(Partial) Autocorrelation Function] [] [2009-12-05 21:12:51] [21503129a47c64de7f80e1fde84c3a45] [Current]
Feedback Forum

Post a new message
Dataseries X:
99.9
98.6
107.2
95.7
93.7
106.7
86.7
95.3
99.3
101.8
96
91.7
95.3
96.6
107.2
108
98.4
103.1
81.1
96.6
103.7
106.6
97.6
87.6
99.4
98.5
105.2
104.6
97.5
108.9
86.8
88.9
110.3
114.8
94.6
92
93.8
93.8
107.6
101
95.4
96.5
89.2
87.1
110.5
110.8
104.2
88.9
89.8
90
93.9
91.3
87.8
99.7
73.5
79.2
96.9
95.2
95.6
89.7


Summary of computational transaction
Raw Inputview raw input (R code)
Raw Outputview raw output of R engine
Computing time1 seconds
R Server'Gwilym Jenkins' @ 72.249.127.135

\begin{tabular}{lllllllll}
\hline
Summary of computational transaction \tabularnewline
Raw Input & view raw input (R code)  \tabularnewline
Raw Output & view raw output of R engine  \tabularnewline
Computing time & 1 seconds \tabularnewline
R Server & 'Gwilym Jenkins' @ 72.249.127.135 \tabularnewline
\hline
\end{tabular}
%Source: https://freestatistics.org/blog/index.php?pk=64315&T=0

[TABLE]
[ROW][C]Summary of computational transaction[/C][/ROW]
[ROW][C]Raw Input[/C][C]view raw input (R code) [/C][/ROW]
[ROW][C]Raw Output[/C][C]view raw output of R engine [/C][/ROW]
[ROW][C]Computing time[/C][C]1 seconds[/C][/ROW]
[ROW][C]R Server[/C][C]'Gwilym Jenkins' @ 72.249.127.135[/C][/ROW]
[/TABLE]
Source: https://freestatistics.org/blog/index.php?pk=64315&T=0

Globally Unique Identifier (entire table): ba.freestatistics.org/blog/index.php?pk=64315&T=0

As an alternative you can also use a QR Code:  

The GUIDs for individual cells are displayed in the table below:

Summary of computational transaction
Raw Inputview raw input (R code)
Raw Outputview raw output of R engine
Computing time1 seconds
R Server'Gwilym Jenkins' @ 72.249.127.135


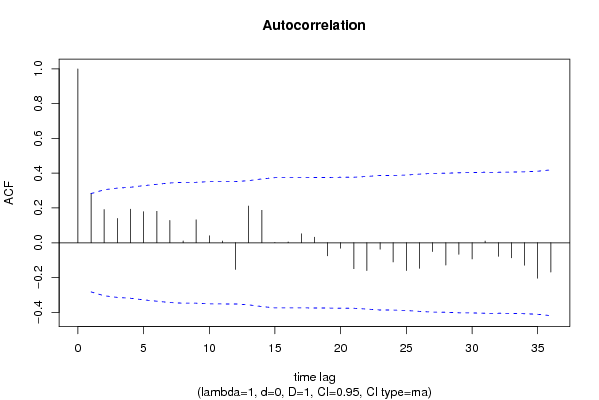
Autocorrelation Function
Time lag kACF(k)T-STATP-value
10.2851221.97540.026995
20.1908021.32190.096231
30.1401790.97120.168162
40.1930431.33740.093691
50.1789421.23970.110548
60.181011.25410.107944
70.1282290.88840.189379
80.010660.07390.470718
90.1317040.91250.183041
100.0396080.27440.392472
110.0100370.06950.472424
12-0.153346-1.06240.146682
130.2113681.46440.074802
140.1868181.29430.100875
150.0009220.00640.497465
160.0043290.030.488098
170.0513920.35610.36168
180.0320870.22230.412509
19-0.075246-0.52130.30227
20-0.031235-0.21640.414795
21-0.14914-1.03330.153327
22-0.159779-1.1070.13691
23-0.03706-0.25680.399232
24-0.110463-0.76530.223917
25-0.159854-1.10750.136798
26-0.147208-1.01990.156447
27-0.050952-0.3530.362815
28-0.128568-0.89070.188754
29-0.066233-0.45890.324196
30-0.093115-0.64510.260962
310.0094790.06570.473955
32-0.0777-0.53830.296422
33-0.086696-0.60060.27545
34-0.128995-0.89370.18797
35-0.203617-1.41070.082391
36-0.168801-1.16950.123992

\begin{tabular}{lllllllll}
\hline
Autocorrelation Function \tabularnewline
Time lag k & ACF(k) & T-STAT & P-value \tabularnewline
1 & 0.285122 & 1.9754 & 0.026995 \tabularnewline
2 & 0.190802 & 1.3219 & 0.096231 \tabularnewline
3 & 0.140179 & 0.9712 & 0.168162 \tabularnewline
4 & 0.193043 & 1.3374 & 0.093691 \tabularnewline
5 & 0.178942 & 1.2397 & 0.110548 \tabularnewline
6 & 0.18101 & 1.2541 & 0.107944 \tabularnewline
7 & 0.128229 & 0.8884 & 0.189379 \tabularnewline
8 & 0.01066 & 0.0739 & 0.470718 \tabularnewline
9 & 0.131704 & 0.9125 & 0.183041 \tabularnewline
10 & 0.039608 & 0.2744 & 0.392472 \tabularnewline
11 & 0.010037 & 0.0695 & 0.472424 \tabularnewline
12 & -0.153346 & -1.0624 & 0.146682 \tabularnewline
13 & 0.211368 & 1.4644 & 0.074802 \tabularnewline
14 & 0.186818 & 1.2943 & 0.100875 \tabularnewline
15 & 0.000922 & 0.0064 & 0.497465 \tabularnewline
16 & 0.004329 & 0.03 & 0.488098 \tabularnewline
17 & 0.051392 & 0.3561 & 0.36168 \tabularnewline
18 & 0.032087 & 0.2223 & 0.412509 \tabularnewline
19 & -0.075246 & -0.5213 & 0.30227 \tabularnewline
20 & -0.031235 & -0.2164 & 0.414795 \tabularnewline
21 & -0.14914 & -1.0333 & 0.153327 \tabularnewline
22 & -0.159779 & -1.107 & 0.13691 \tabularnewline
23 & -0.03706 & -0.2568 & 0.399232 \tabularnewline
24 & -0.110463 & -0.7653 & 0.223917 \tabularnewline
25 & -0.159854 & -1.1075 & 0.136798 \tabularnewline
26 & -0.147208 & -1.0199 & 0.156447 \tabularnewline
27 & -0.050952 & -0.353 & 0.362815 \tabularnewline
28 & -0.128568 & -0.8907 & 0.188754 \tabularnewline
29 & -0.066233 & -0.4589 & 0.324196 \tabularnewline
30 & -0.093115 & -0.6451 & 0.260962 \tabularnewline
31 & 0.009479 & 0.0657 & 0.473955 \tabularnewline
32 & -0.0777 & -0.5383 & 0.296422 \tabularnewline
33 & -0.086696 & -0.6006 & 0.27545 \tabularnewline
34 & -0.128995 & -0.8937 & 0.18797 \tabularnewline
35 & -0.203617 & -1.4107 & 0.082391 \tabularnewline
36 & -0.168801 & -1.1695 & 0.123992 \tabularnewline
\hline
\end{tabular}
%Source: https://freestatistics.org/blog/index.php?pk=64315&T=1

[TABLE]
[ROW][C]Autocorrelation Function[/C][/ROW]
[ROW][C]Time lag k[/C][C]ACF(k)[/C][C]T-STAT[/C][C]P-value[/C][/ROW]
[ROW][C]1[/C][C]0.285122[/C][C]1.9754[/C][C]0.026995[/C][/ROW]
[ROW][C]2[/C][C]0.190802[/C][C]1.3219[/C][C]0.096231[/C][/ROW]
[ROW][C]3[/C][C]0.140179[/C][C]0.9712[/C][C]0.168162[/C][/ROW]
[ROW][C]4[/C][C]0.193043[/C][C]1.3374[/C][C]0.093691[/C][/ROW]
[ROW][C]5[/C][C]0.178942[/C][C]1.2397[/C][C]0.110548[/C][/ROW]
[ROW][C]6[/C][C]0.18101[/C][C]1.2541[/C][C]0.107944[/C][/ROW]
[ROW][C]7[/C][C]0.128229[/C][C]0.8884[/C][C]0.189379[/C][/ROW]
[ROW][C]8[/C][C]0.01066[/C][C]0.0739[/C][C]0.470718[/C][/ROW]
[ROW][C]9[/C][C]0.131704[/C][C]0.9125[/C][C]0.183041[/C][/ROW]
[ROW][C]10[/C][C]0.039608[/C][C]0.2744[/C][C]0.392472[/C][/ROW]
[ROW][C]11[/C][C]0.010037[/C][C]0.0695[/C][C]0.472424[/C][/ROW]
[ROW][C]12[/C][C]-0.153346[/C][C]-1.0624[/C][C]0.146682[/C][/ROW]
[ROW][C]13[/C][C]0.211368[/C][C]1.4644[/C][C]0.074802[/C][/ROW]
[ROW][C]14[/C][C]0.186818[/C][C]1.2943[/C][C]0.100875[/C][/ROW]
[ROW][C]15[/C][C]0.000922[/C][C]0.0064[/C][C]0.497465[/C][/ROW]
[ROW][C]16[/C][C]0.004329[/C][C]0.03[/C][C]0.488098[/C][/ROW]
[ROW][C]17[/C][C]0.051392[/C][C]0.3561[/C][C]0.36168[/C][/ROW]
[ROW][C]18[/C][C]0.032087[/C][C]0.2223[/C][C]0.412509[/C][/ROW]
[ROW][C]19[/C][C]-0.075246[/C][C]-0.5213[/C][C]0.30227[/C][/ROW]
[ROW][C]20[/C][C]-0.031235[/C][C]-0.2164[/C][C]0.414795[/C][/ROW]
[ROW][C]21[/C][C]-0.14914[/C][C]-1.0333[/C][C]0.153327[/C][/ROW]
[ROW][C]22[/C][C]-0.159779[/C][C]-1.107[/C][C]0.13691[/C][/ROW]
[ROW][C]23[/C][C]-0.03706[/C][C]-0.2568[/C][C]0.399232[/C][/ROW]
[ROW][C]24[/C][C]-0.110463[/C][C]-0.7653[/C][C]0.223917[/C][/ROW]
[ROW][C]25[/C][C]-0.159854[/C][C]-1.1075[/C][C]0.136798[/C][/ROW]
[ROW][C]26[/C][C]-0.147208[/C][C]-1.0199[/C][C]0.156447[/C][/ROW]
[ROW][C]27[/C][C]-0.050952[/C][C]-0.353[/C][C]0.362815[/C][/ROW]
[ROW][C]28[/C][C]-0.128568[/C][C]-0.8907[/C][C]0.188754[/C][/ROW]
[ROW][C]29[/C][C]-0.066233[/C][C]-0.4589[/C][C]0.324196[/C][/ROW]
[ROW][C]30[/C][C]-0.093115[/C][C]-0.6451[/C][C]0.260962[/C][/ROW]
[ROW][C]31[/C][C]0.009479[/C][C]0.0657[/C][C]0.473955[/C][/ROW]
[ROW][C]32[/C][C]-0.0777[/C][C]-0.5383[/C][C]0.296422[/C][/ROW]
[ROW][C]33[/C][C]-0.086696[/C][C]-0.6006[/C][C]0.27545[/C][/ROW]
[ROW][C]34[/C][C]-0.128995[/C][C]-0.8937[/C][C]0.18797[/C][/ROW]
[ROW][C]35[/C][C]-0.203617[/C][C]-1.4107[/C][C]0.082391[/C][/ROW]
[ROW][C]36[/C][C]-0.168801[/C][C]-1.1695[/C][C]0.123992[/C][/ROW]
[/TABLE]
Source: https://freestatistics.org/blog/index.php?pk=64315&T=1

Globally Unique Identifier (entire table): ba.freestatistics.org/blog/index.php?pk=64315&T=1

As an alternative you can also use a QR Code:  

The GUIDs for individual cells are displayed in the table below:

Autocorrelation Function
Time lag kACF(k)T-STATP-value
10.2851221.97540.026995
20.1908021.32190.096231
30.1401790.97120.168162
40.1930431.33740.093691
50.1789421.23970.110548
60.181011.25410.107944
70.1282290.88840.189379
80.010660.07390.470718
90.1317040.91250.183041
100.0396080.27440.392472
110.0100370.06950.472424
12-0.153346-1.06240.146682
130.2113681.46440.074802
140.1868181.29430.100875
150.0009220.00640.497465
160.0043290.030.488098
170.0513920.35610.36168
180.0320870.22230.412509
19-0.075246-0.52130.30227
20-0.031235-0.21640.414795
21-0.14914-1.03330.153327
22-0.159779-1.1070.13691
23-0.03706-0.25680.399232
24-0.110463-0.76530.223917
25-0.159854-1.10750.136798
26-0.147208-1.01990.156447
27-0.050952-0.3530.362815
28-0.128568-0.89070.188754
29-0.066233-0.45890.324196
30-0.093115-0.64510.260962
310.0094790.06570.473955
32-0.0777-0.53830.296422
33-0.086696-0.60060.27545
34-0.128995-0.89370.18797
35-0.203617-1.41070.082391
36-0.168801-1.16950.123992


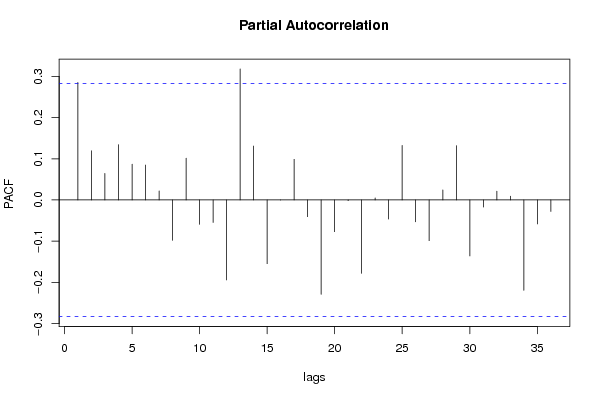
Partial Autocorrelation Function
Time lag kPACF(k)T-STATP-value
10.2851221.97540.026995
20.1191970.82580.206495
30.0643460.44580.328871
40.1340590.92880.178823
50.0867420.6010.275344
60.0848560.58790.279678
70.0219280.15190.439942
8-0.097641-0.67650.250992
90.1012760.70170.24314
10-0.058858-0.40780.342625
11-0.054447-0.37720.353837
12-0.193975-1.34390.09265
130.3177772.20160.016266
140.1306880.90540.184879
15-0.1545-1.07040.144894
16-3.2e-05-2e-040.499912
170.0986330.68330.248836
18-0.04035-0.27960.390511
19-0.228637-1.5840.059876
20-0.076943-0.53310.298219
21-0.001718-0.01190.495275
22-0.177832-1.23210.111965
230.0048850.03380.48657
24-0.046183-0.320.375192
250.1322790.91650.182006
26-0.052909-0.36660.357779
27-0.098682-0.68370.248729
280.0243750.16890.433302
290.1316220.91190.183188
30-0.135524-0.93890.176231
31-0.01705-0.11810.45323
320.0214280.14850.441302
330.0091790.06360.474779
34-0.218975-1.51710.0679
35-0.058215-0.40330.344249
36-0.027729-0.19210.424233

\begin{tabular}{lllllllll}
\hline
Partial Autocorrelation Function \tabularnewline
Time lag k & PACF(k) & T-STAT & P-value \tabularnewline
1 & 0.285122 & 1.9754 & 0.026995 \tabularnewline
2 & 0.119197 & 0.8258 & 0.206495 \tabularnewline
3 & 0.064346 & 0.4458 & 0.328871 \tabularnewline
4 & 0.134059 & 0.9288 & 0.178823 \tabularnewline
5 & 0.086742 & 0.601 & 0.275344 \tabularnewline
6 & 0.084856 & 0.5879 & 0.279678 \tabularnewline
7 & 0.021928 & 0.1519 & 0.439942 \tabularnewline
8 & -0.097641 & -0.6765 & 0.250992 \tabularnewline
9 & 0.101276 & 0.7017 & 0.24314 \tabularnewline
10 & -0.058858 & -0.4078 & 0.342625 \tabularnewline
11 & -0.054447 & -0.3772 & 0.353837 \tabularnewline
12 & -0.193975 & -1.3439 & 0.09265 \tabularnewline
13 & 0.317777 & 2.2016 & 0.016266 \tabularnewline
14 & 0.130688 & 0.9054 & 0.184879 \tabularnewline
15 & -0.1545 & -1.0704 & 0.144894 \tabularnewline
16 & -3.2e-05 & -2e-04 & 0.499912 \tabularnewline
17 & 0.098633 & 0.6833 & 0.248836 \tabularnewline
18 & -0.04035 & -0.2796 & 0.390511 \tabularnewline
19 & -0.228637 & -1.584 & 0.059876 \tabularnewline
20 & -0.076943 & -0.5331 & 0.298219 \tabularnewline
21 & -0.001718 & -0.0119 & 0.495275 \tabularnewline
22 & -0.177832 & -1.2321 & 0.111965 \tabularnewline
23 & 0.004885 & 0.0338 & 0.48657 \tabularnewline
24 & -0.046183 & -0.32 & 0.375192 \tabularnewline
25 & 0.132279 & 0.9165 & 0.182006 \tabularnewline
26 & -0.052909 & -0.3666 & 0.357779 \tabularnewline
27 & -0.098682 & -0.6837 & 0.248729 \tabularnewline
28 & 0.024375 & 0.1689 & 0.433302 \tabularnewline
29 & 0.131622 & 0.9119 & 0.183188 \tabularnewline
30 & -0.135524 & -0.9389 & 0.176231 \tabularnewline
31 & -0.01705 & -0.1181 & 0.45323 \tabularnewline
32 & 0.021428 & 0.1485 & 0.441302 \tabularnewline
33 & 0.009179 & 0.0636 & 0.474779 \tabularnewline
34 & -0.218975 & -1.5171 & 0.0679 \tabularnewline
35 & -0.058215 & -0.4033 & 0.344249 \tabularnewline
36 & -0.027729 & -0.1921 & 0.424233 \tabularnewline
\hline
\end{tabular}
%Source: https://freestatistics.org/blog/index.php?pk=64315&T=2

[TABLE]
[ROW][C]Partial Autocorrelation Function[/C][/ROW]
[ROW][C]Time lag k[/C][C]PACF(k)[/C][C]T-STAT[/C][C]P-value[/C][/ROW]
[ROW][C]1[/C][C]0.285122[/C][C]1.9754[/C][C]0.026995[/C][/ROW]
[ROW][C]2[/C][C]0.119197[/C][C]0.8258[/C][C]0.206495[/C][/ROW]
[ROW][C]3[/C][C]0.064346[/C][C]0.4458[/C][C]0.328871[/C][/ROW]
[ROW][C]4[/C][C]0.134059[/C][C]0.9288[/C][C]0.178823[/C][/ROW]
[ROW][C]5[/C][C]0.086742[/C][C]0.601[/C][C]0.275344[/C][/ROW]
[ROW][C]6[/C][C]0.084856[/C][C]0.5879[/C][C]0.279678[/C][/ROW]
[ROW][C]7[/C][C]0.021928[/C][C]0.1519[/C][C]0.439942[/C][/ROW]
[ROW][C]8[/C][C]-0.097641[/C][C]-0.6765[/C][C]0.250992[/C][/ROW]
[ROW][C]9[/C][C]0.101276[/C][C]0.7017[/C][C]0.24314[/C][/ROW]
[ROW][C]10[/C][C]-0.058858[/C][C]-0.4078[/C][C]0.342625[/C][/ROW]
[ROW][C]11[/C][C]-0.054447[/C][C]-0.3772[/C][C]0.353837[/C][/ROW]
[ROW][C]12[/C][C]-0.193975[/C][C]-1.3439[/C][C]0.09265[/C][/ROW]
[ROW][C]13[/C][C]0.317777[/C][C]2.2016[/C][C]0.016266[/C][/ROW]
[ROW][C]14[/C][C]0.130688[/C][C]0.9054[/C][C]0.184879[/C][/ROW]
[ROW][C]15[/C][C]-0.1545[/C][C]-1.0704[/C][C]0.144894[/C][/ROW]
[ROW][C]16[/C][C]-3.2e-05[/C][C]-2e-04[/C][C]0.499912[/C][/ROW]
[ROW][C]17[/C][C]0.098633[/C][C]0.6833[/C][C]0.248836[/C][/ROW]
[ROW][C]18[/C][C]-0.04035[/C][C]-0.2796[/C][C]0.390511[/C][/ROW]
[ROW][C]19[/C][C]-0.228637[/C][C]-1.584[/C][C]0.059876[/C][/ROW]
[ROW][C]20[/C][C]-0.076943[/C][C]-0.5331[/C][C]0.298219[/C][/ROW]
[ROW][C]21[/C][C]-0.001718[/C][C]-0.0119[/C][C]0.495275[/C][/ROW]
[ROW][C]22[/C][C]-0.177832[/C][C]-1.2321[/C][C]0.111965[/C][/ROW]
[ROW][C]23[/C][C]0.004885[/C][C]0.0338[/C][C]0.48657[/C][/ROW]
[ROW][C]24[/C][C]-0.046183[/C][C]-0.32[/C][C]0.375192[/C][/ROW]
[ROW][C]25[/C][C]0.132279[/C][C]0.9165[/C][C]0.182006[/C][/ROW]
[ROW][C]26[/C][C]-0.052909[/C][C]-0.3666[/C][C]0.357779[/C][/ROW]
[ROW][C]27[/C][C]-0.098682[/C][C]-0.6837[/C][C]0.248729[/C][/ROW]
[ROW][C]28[/C][C]0.024375[/C][C]0.1689[/C][C]0.433302[/C][/ROW]
[ROW][C]29[/C][C]0.131622[/C][C]0.9119[/C][C]0.183188[/C][/ROW]
[ROW][C]30[/C][C]-0.135524[/C][C]-0.9389[/C][C]0.176231[/C][/ROW]
[ROW][C]31[/C][C]-0.01705[/C][C]-0.1181[/C][C]0.45323[/C][/ROW]
[ROW][C]32[/C][C]0.021428[/C][C]0.1485[/C][C]0.441302[/C][/ROW]
[ROW][C]33[/C][C]0.009179[/C][C]0.0636[/C][C]0.474779[/C][/ROW]
[ROW][C]34[/C][C]-0.218975[/C][C]-1.5171[/C][C]0.0679[/C][/ROW]
[ROW][C]35[/C][C]-0.058215[/C][C]-0.4033[/C][C]0.344249[/C][/ROW]
[ROW][C]36[/C][C]-0.027729[/C][C]-0.1921[/C][C]0.424233[/C][/ROW]
[/TABLE]
Source: https://freestatistics.org/blog/index.php?pk=64315&T=2

Globally Unique Identifier (entire table): ba.freestatistics.org/blog/index.php?pk=64315&T=2

As an alternative you can also use a QR Code:  

The GUIDs for individual cells are displayed in the table below:

Partial Autocorrelation Function
Time lag kPACF(k)T-STATP-value
10.2851221.97540.026995
20.1191970.82580.206495
30.0643460.44580.328871
40.1340590.92880.178823
50.0867420.6010.275344
60.0848560.58790.279678
70.0219280.15190.439942
8-0.097641-0.67650.250992
90.1012760.70170.24314
10-0.058858-0.40780.342625
11-0.054447-0.37720.353837
12-0.193975-1.34390.09265
130.3177772.20160.016266
140.1306880.90540.184879
15-0.1545-1.07040.144894
16-3.2e-05-2e-040.499912
170.0986330.68330.248836
18-0.04035-0.27960.390511
19-0.228637-1.5840.059876
20-0.076943-0.53310.298219
21-0.001718-0.01190.495275
22-0.177832-1.23210.111965
230.0048850.03380.48657
24-0.046183-0.320.375192
250.1322790.91650.182006
26-0.052909-0.36660.357779
27-0.098682-0.68370.248729
280.0243750.16890.433302
290.1316220.91190.183188
30-0.135524-0.93890.176231
31-0.01705-0.11810.45323
320.0214280.14850.441302
330.0091790.06360.474779
34-0.218975-1.51710.0679
35-0.058215-0.40330.344249
36-0.027729-0.19210.424233


Parameters (Session):
par1 = 36 ; par2 = 1 ; par3 = 0 ; par4 = 1 ; par5 = 12 ; par6 = MA ; par7 = 0.95 ;
Parameters (R input):
par1 = 36 ; par2 = 1 ; par3 = 0 ; par4 = 1 ; par5 = 12 ; par6 = MA ; par7 = 0.95 ;
R code (references can be found in the software module):
if (par1 == 'Default') {
par1 = 10*log10(length(x))
} else {
par1 <- as.numeric(par1)
}
par2 <- as.numeric(par2)
par3 <- as.numeric(par3)
par4 <- as.numeric(par4)
par5 <- as.numeric(par5)
if (par6 == 'White Noise') par6 <- 'white' else par6 <- 'ma'
par7 <- as.numeric(par7)
if (par2 == 0) {
x <- log(x)
} else {
x <- (x ^ par2 - 1) / par2
}
if (par3 > 0) x <- diff(x,lag=1,difference=par3)
if (par4 > 0) x <- diff(x,lag=par5,difference=par4)
bitmap(file='pic1.png')
racf <- acf(x, par1, main='Autocorrelation', xlab='time lag', ylab='ACF', ci.type=par6, ci=par7, sub=paste('(lambda=',par2,', d=',par3,', D=',par4,', CI=', par7, ', CI type=',par6,')',sep=''))
dev.off()
bitmap(file='pic2.png')
rpacf <- pacf(x,par1,main='Partial Autocorrelation',xlab='lags',ylab='PACF')
dev.off()
(myacf <- c(racf$acf))
(mypacf <- c(rpacf$acf))
lengthx <- length(x)
sqrtn <- sqrt(lengthx)
load(file='createtable')
a<-table.start()
a<-table.row.start(a)
a<-table.element(a,'Autocorrelation Function',4,TRUE)
a<-table.row.end(a)
a<-table.row.start(a)
a<-table.element(a,'Time lag k',header=TRUE)
a<-table.element(a,hyperlink('basics.htm','ACF(k)','click here for more information about the Autocorrelation Function'),header=TRUE)
a<-table.element(a,'T-STAT',header=TRUE)
a<-table.element(a,'P-value',header=TRUE)
a<-table.row.end(a)
for (i in 2:(par1+1)) {
a<-table.row.start(a)
a<-table.element(a,i-1,header=TRUE)
a<-table.element(a,round(myacf[i],6))
mytstat <- myacf[i]*sqrtn
a<-table.element(a,round(mytstat,4))
a<-table.element(a,round(1-pt(abs(mytstat),lengthx),6))
a<-table.row.end(a)
}
a<-table.end(a)
table.save(a,file='mytable.tab')
a<-table.start()
a<-table.row.start(a)
a<-table.element(a,'Partial Autocorrelation Function',4,TRUE)
a<-table.row.end(a)
a<-table.row.start(a)
a<-table.element(a,'Time lag k',header=TRUE)
a<-table.element(a,hyperlink('basics.htm','PACF(k)','click here for more information about the Partial Autocorrelation Function'),header=TRUE)
a<-table.element(a,'T-STAT',header=TRUE)
a<-table.element(a,'P-value',header=TRUE)
a<-table.row.end(a)
for (i in 1:par1) {
a<-table.row.start(a)
a<-table.element(a,i,header=TRUE)
a<-table.element(a,round(mypacf[i],6))
mytstat <- mypacf[i]*sqrtn
a<-table.element(a,round(mytstat,4))
a<-table.element(a,round(1-pt(abs(mytstat),lengthx),6))
a<-table.row.end(a)
}
a<-table.end(a)
table.save(a,file='mytable1.tab')