Free Statistics

of Irreproducible Research!

Author's title

Author*The author of this computation has been verified*
R Software Modulerwasp_autocorrelation.wasp
Title produced by software(Partial) Autocorrelation Function
Date of computationMon, 07 Dec 2009 06:41:12 -0700
Cite this page as followsStatistical Computations at FreeStatistics.org, Office for Research Development and Education, URL https://freestatistics.org/blog/index.php?v=date/2009/Dec/07/t12601933341szi95ag7e62qra.htm/, Retrieved Sun, 05 May 2024 07:34:34 +0000
Statistical Computations at FreeStatistics.org, Office for Research Development and Education, URL https://freestatistics.org/blog/index.php?pk=64574, Retrieved Sun, 05 May 2024 07:34:34 +0000
QR Codes:

Original text written by user:
IsPrivate?No (this computation is public)
User-defined keywords
Estimated Impact129
Family? (F = Feedback message, R = changed R code, M = changed R Module, P = changed Parameters, D = changed Data)
-       [(Partial) Autocorrelation Function] [acf na diff d=1] [2009-12-07 13:41:12] [b42c0aeada8a5fa89825c81e73c10645] [Current]
Feedback Forum

Post a new message
Dataseries X:
104.1
90.2
99.2
116.5
98.4
90.6
130.5
107.4
106
196.5
107.8
90.5
123.8
114.7
115.3
197
88.4
93.8
111.3
105.9
123.6
171
97
99.2
126.6
103.4
121.3
129.6
110.8
98.9
122.8
120.9
133.1
203.1
110.2
119.5
135.1
113.9
137.4
157.1
126.4
112.2
128.8
136.8
156.5
215.2
146.7
130.8
133.1
153.4
159.9
174.6
145
112.9
137.8
150.6
162.1
226.4
112.3
126.3


Summary of computational transaction
Raw Inputview raw input (R code)
Raw Outputview raw output of R engine
Computing time2 seconds
R Server'Gwilym Jenkins' @ 72.249.127.135

\begin{tabular}{lllllllll}
\hline
Summary of computational transaction \tabularnewline
Raw Input & view raw input (R code)  \tabularnewline
Raw Output & view raw output of R engine  \tabularnewline
Computing time & 2 seconds \tabularnewline
R Server & 'Gwilym Jenkins' @ 72.249.127.135 \tabularnewline
\hline
\end{tabular}
%Source: https://freestatistics.org/blog/index.php?pk=64574&T=0

[TABLE]
[ROW][C]Summary of computational transaction[/C][/ROW]
[ROW][C]Raw Input[/C][C]view raw input (R code) [/C][/ROW]
[ROW][C]Raw Output[/C][C]view raw output of R engine [/C][/ROW]
[ROW][C]Computing time[/C][C]2 seconds[/C][/ROW]
[ROW][C]R Server[/C][C]'Gwilym Jenkins' @ 72.249.127.135[/C][/ROW]
[/TABLE]
Source: https://freestatistics.org/blog/index.php?pk=64574&T=0

Globally Unique Identifier (entire table): ba.freestatistics.org/blog/index.php?pk=64574&T=0

As an alternative you can also use a QR Code:  

The GUIDs for individual cells are displayed in the table below:

Summary of computational transaction
Raw Inputview raw input (R code)
Raw Outputview raw output of R engine
Computing time2 seconds
R Server'Gwilym Jenkins' @ 72.249.127.135


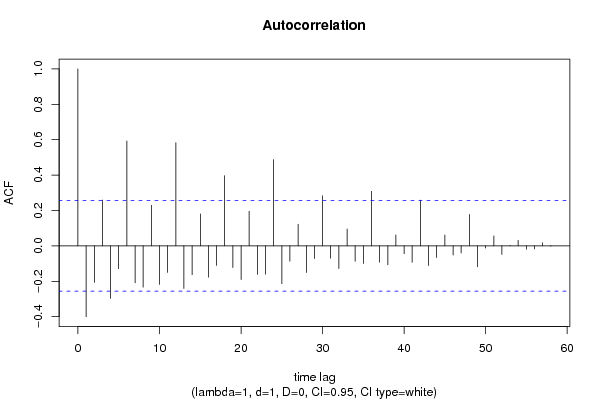
Autocorrelation Function
Time lag kACF(k)T-STATP-value
1-0.400133-3.07350.001601
2-0.206669-1.58750.058877
30.258691.9870.025784
4-0.296928-2.28080.013095
5-0.129375-0.99380.162201
60.5921744.54861.4e-05
7-0.208768-1.60360.057074
8-0.233635-1.79460.038922
90.2300211.76680.041215
10-0.218382-1.67740.049375
11-0.150505-1.15610.12616
120.5833294.48061.7e-05
13-0.240974-1.8510.034592
14-0.163223-1.25370.10744
150.1805271.38670.085383
16-0.177078-1.36020.089477
17-0.110755-0.85070.199181
180.3966333.04660.001729
19-0.122359-0.93990.175562
20-0.190357-1.46220.074502
210.1963461.50820.068425
22-0.161318-1.23910.110107
23-0.15993-1.22840.112078
240.4874963.74450.000206
25-0.213931-1.64320.052827
26-0.086355-0.66330.25486
270.1223560.93980.175568
28-0.150618-1.15690.125984
29-0.071541-0.54950.292361
300.283152.17490.016828
31-0.069887-0.53680.296707
32-0.128414-0.98640.16399
330.0949980.72970.234233
34-0.087398-0.67130.252319
35-0.09962-0.76520.223602
360.3086472.37080.010519
37-0.092134-0.70770.240962
38-0.106855-0.82080.207542
390.0617150.4740.318609
40-0.044407-0.34110.367122
41-0.092738-0.71230.239533
420.2585461.98590.025847
43-0.111137-0.85370.198373
44-0.066448-0.51040.305838
450.0608110.46710.321075
46-0.051769-0.39760.346164
47-0.04002-0.30740.37981
480.1778111.36580.088594
49-0.118703-0.91180.182799
50-0.012372-0.0950.462305
510.056140.43120.333941
52-0.04844-0.37210.355585
530.0024670.01890.492474
540.0310460.23850.406171
55-0.018567-0.14260.443538
56-0.017251-0.13250.447517
570.0181040.13910.444938
58-0.00201-0.01540.493867
59NANANA
60NANANA

\begin{tabular}{lllllllll}
\hline
Autocorrelation Function \tabularnewline
Time lag k & ACF(k) & T-STAT & P-value \tabularnewline
1 & -0.400133 & -3.0735 & 0.001601 \tabularnewline
2 & -0.206669 & -1.5875 & 0.058877 \tabularnewline
3 & 0.25869 & 1.987 & 0.025784 \tabularnewline
4 & -0.296928 & -2.2808 & 0.013095 \tabularnewline
5 & -0.129375 & -0.9938 & 0.162201 \tabularnewline
6 & 0.592174 & 4.5486 & 1.4e-05 \tabularnewline
7 & -0.208768 & -1.6036 & 0.057074 \tabularnewline
8 & -0.233635 & -1.7946 & 0.038922 \tabularnewline
9 & 0.230021 & 1.7668 & 0.041215 \tabularnewline
10 & -0.218382 & -1.6774 & 0.049375 \tabularnewline
11 & -0.150505 & -1.1561 & 0.12616 \tabularnewline
12 & 0.583329 & 4.4806 & 1.7e-05 \tabularnewline
13 & -0.240974 & -1.851 & 0.034592 \tabularnewline
14 & -0.163223 & -1.2537 & 0.10744 \tabularnewline
15 & 0.180527 & 1.3867 & 0.085383 \tabularnewline
16 & -0.177078 & -1.3602 & 0.089477 \tabularnewline
17 & -0.110755 & -0.8507 & 0.199181 \tabularnewline
18 & 0.396633 & 3.0466 & 0.001729 \tabularnewline
19 & -0.122359 & -0.9399 & 0.175562 \tabularnewline
20 & -0.190357 & -1.4622 & 0.074502 \tabularnewline
21 & 0.196346 & 1.5082 & 0.068425 \tabularnewline
22 & -0.161318 & -1.2391 & 0.110107 \tabularnewline
23 & -0.15993 & -1.2284 & 0.112078 \tabularnewline
24 & 0.487496 & 3.7445 & 0.000206 \tabularnewline
25 & -0.213931 & -1.6432 & 0.052827 \tabularnewline
26 & -0.086355 & -0.6633 & 0.25486 \tabularnewline
27 & 0.122356 & 0.9398 & 0.175568 \tabularnewline
28 & -0.150618 & -1.1569 & 0.125984 \tabularnewline
29 & -0.071541 & -0.5495 & 0.292361 \tabularnewline
30 & 0.28315 & 2.1749 & 0.016828 \tabularnewline
31 & -0.069887 & -0.5368 & 0.296707 \tabularnewline
32 & -0.128414 & -0.9864 & 0.16399 \tabularnewline
33 & 0.094998 & 0.7297 & 0.234233 \tabularnewline
34 & -0.087398 & -0.6713 & 0.252319 \tabularnewline
35 & -0.09962 & -0.7652 & 0.223602 \tabularnewline
36 & 0.308647 & 2.3708 & 0.010519 \tabularnewline
37 & -0.092134 & -0.7077 & 0.240962 \tabularnewline
38 & -0.106855 & -0.8208 & 0.207542 \tabularnewline
39 & 0.061715 & 0.474 & 0.318609 \tabularnewline
40 & -0.044407 & -0.3411 & 0.367122 \tabularnewline
41 & -0.092738 & -0.7123 & 0.239533 \tabularnewline
42 & 0.258546 & 1.9859 & 0.025847 \tabularnewline
43 & -0.111137 & -0.8537 & 0.198373 \tabularnewline
44 & -0.066448 & -0.5104 & 0.305838 \tabularnewline
45 & 0.060811 & 0.4671 & 0.321075 \tabularnewline
46 & -0.051769 & -0.3976 & 0.346164 \tabularnewline
47 & -0.04002 & -0.3074 & 0.37981 \tabularnewline
48 & 0.177811 & 1.3658 & 0.088594 \tabularnewline
49 & -0.118703 & -0.9118 & 0.182799 \tabularnewline
50 & -0.012372 & -0.095 & 0.462305 \tabularnewline
51 & 0.05614 & 0.4312 & 0.333941 \tabularnewline
52 & -0.04844 & -0.3721 & 0.355585 \tabularnewline
53 & 0.002467 & 0.0189 & 0.492474 \tabularnewline
54 & 0.031046 & 0.2385 & 0.406171 \tabularnewline
55 & -0.018567 & -0.1426 & 0.443538 \tabularnewline
56 & -0.017251 & -0.1325 & 0.447517 \tabularnewline
57 & 0.018104 & 0.1391 & 0.444938 \tabularnewline
58 & -0.00201 & -0.0154 & 0.493867 \tabularnewline
59 & NA & NA & NA \tabularnewline
60 & NA & NA & NA \tabularnewline
\hline
\end{tabular}
%Source: https://freestatistics.org/blog/index.php?pk=64574&T=1

[TABLE]
[ROW][C]Autocorrelation Function[/C][/ROW]
[ROW][C]Time lag k[/C][C]ACF(k)[/C][C]T-STAT[/C][C]P-value[/C][/ROW]
[ROW][C]1[/C][C]-0.400133[/C][C]-3.0735[/C][C]0.001601[/C][/ROW]
[ROW][C]2[/C][C]-0.206669[/C][C]-1.5875[/C][C]0.058877[/C][/ROW]
[ROW][C]3[/C][C]0.25869[/C][C]1.987[/C][C]0.025784[/C][/ROW]
[ROW][C]4[/C][C]-0.296928[/C][C]-2.2808[/C][C]0.013095[/C][/ROW]
[ROW][C]5[/C][C]-0.129375[/C][C]-0.9938[/C][C]0.162201[/C][/ROW]
[ROW][C]6[/C][C]0.592174[/C][C]4.5486[/C][C]1.4e-05[/C][/ROW]
[ROW][C]7[/C][C]-0.208768[/C][C]-1.6036[/C][C]0.057074[/C][/ROW]
[ROW][C]8[/C][C]-0.233635[/C][C]-1.7946[/C][C]0.038922[/C][/ROW]
[ROW][C]9[/C][C]0.230021[/C][C]1.7668[/C][C]0.041215[/C][/ROW]
[ROW][C]10[/C][C]-0.218382[/C][C]-1.6774[/C][C]0.049375[/C][/ROW]
[ROW][C]11[/C][C]-0.150505[/C][C]-1.1561[/C][C]0.12616[/C][/ROW]
[ROW][C]12[/C][C]0.583329[/C][C]4.4806[/C][C]1.7e-05[/C][/ROW]
[ROW][C]13[/C][C]-0.240974[/C][C]-1.851[/C][C]0.034592[/C][/ROW]
[ROW][C]14[/C][C]-0.163223[/C][C]-1.2537[/C][C]0.10744[/C][/ROW]
[ROW][C]15[/C][C]0.180527[/C][C]1.3867[/C][C]0.085383[/C][/ROW]
[ROW][C]16[/C][C]-0.177078[/C][C]-1.3602[/C][C]0.089477[/C][/ROW]
[ROW][C]17[/C][C]-0.110755[/C][C]-0.8507[/C][C]0.199181[/C][/ROW]
[ROW][C]18[/C][C]0.396633[/C][C]3.0466[/C][C]0.001729[/C][/ROW]
[ROW][C]19[/C][C]-0.122359[/C][C]-0.9399[/C][C]0.175562[/C][/ROW]
[ROW][C]20[/C][C]-0.190357[/C][C]-1.4622[/C][C]0.074502[/C][/ROW]
[ROW][C]21[/C][C]0.196346[/C][C]1.5082[/C][C]0.068425[/C][/ROW]
[ROW][C]22[/C][C]-0.161318[/C][C]-1.2391[/C][C]0.110107[/C][/ROW]
[ROW][C]23[/C][C]-0.15993[/C][C]-1.2284[/C][C]0.112078[/C][/ROW]
[ROW][C]24[/C][C]0.487496[/C][C]3.7445[/C][C]0.000206[/C][/ROW]
[ROW][C]25[/C][C]-0.213931[/C][C]-1.6432[/C][C]0.052827[/C][/ROW]
[ROW][C]26[/C][C]-0.086355[/C][C]-0.6633[/C][C]0.25486[/C][/ROW]
[ROW][C]27[/C][C]0.122356[/C][C]0.9398[/C][C]0.175568[/C][/ROW]
[ROW][C]28[/C][C]-0.150618[/C][C]-1.1569[/C][C]0.125984[/C][/ROW]
[ROW][C]29[/C][C]-0.071541[/C][C]-0.5495[/C][C]0.292361[/C][/ROW]
[ROW][C]30[/C][C]0.28315[/C][C]2.1749[/C][C]0.016828[/C][/ROW]
[ROW][C]31[/C][C]-0.069887[/C][C]-0.5368[/C][C]0.296707[/C][/ROW]
[ROW][C]32[/C][C]-0.128414[/C][C]-0.9864[/C][C]0.16399[/C][/ROW]
[ROW][C]33[/C][C]0.094998[/C][C]0.7297[/C][C]0.234233[/C][/ROW]
[ROW][C]34[/C][C]-0.087398[/C][C]-0.6713[/C][C]0.252319[/C][/ROW]
[ROW][C]35[/C][C]-0.09962[/C][C]-0.7652[/C][C]0.223602[/C][/ROW]
[ROW][C]36[/C][C]0.308647[/C][C]2.3708[/C][C]0.010519[/C][/ROW]
[ROW][C]37[/C][C]-0.092134[/C][C]-0.7077[/C][C]0.240962[/C][/ROW]
[ROW][C]38[/C][C]-0.106855[/C][C]-0.8208[/C][C]0.207542[/C][/ROW]
[ROW][C]39[/C][C]0.061715[/C][C]0.474[/C][C]0.318609[/C][/ROW]
[ROW][C]40[/C][C]-0.044407[/C][C]-0.3411[/C][C]0.367122[/C][/ROW]
[ROW][C]41[/C][C]-0.092738[/C][C]-0.7123[/C][C]0.239533[/C][/ROW]
[ROW][C]42[/C][C]0.258546[/C][C]1.9859[/C][C]0.025847[/C][/ROW]
[ROW][C]43[/C][C]-0.111137[/C][C]-0.8537[/C][C]0.198373[/C][/ROW]
[ROW][C]44[/C][C]-0.066448[/C][C]-0.5104[/C][C]0.305838[/C][/ROW]
[ROW][C]45[/C][C]0.060811[/C][C]0.4671[/C][C]0.321075[/C][/ROW]
[ROW][C]46[/C][C]-0.051769[/C][C]-0.3976[/C][C]0.346164[/C][/ROW]
[ROW][C]47[/C][C]-0.04002[/C][C]-0.3074[/C][C]0.37981[/C][/ROW]
[ROW][C]48[/C][C]0.177811[/C][C]1.3658[/C][C]0.088594[/C][/ROW]
[ROW][C]49[/C][C]-0.118703[/C][C]-0.9118[/C][C]0.182799[/C][/ROW]
[ROW][C]50[/C][C]-0.012372[/C][C]-0.095[/C][C]0.462305[/C][/ROW]
[ROW][C]51[/C][C]0.05614[/C][C]0.4312[/C][C]0.333941[/C][/ROW]
[ROW][C]52[/C][C]-0.04844[/C][C]-0.3721[/C][C]0.355585[/C][/ROW]
[ROW][C]53[/C][C]0.002467[/C][C]0.0189[/C][C]0.492474[/C][/ROW]
[ROW][C]54[/C][C]0.031046[/C][C]0.2385[/C][C]0.406171[/C][/ROW]
[ROW][C]55[/C][C]-0.018567[/C][C]-0.1426[/C][C]0.443538[/C][/ROW]
[ROW][C]56[/C][C]-0.017251[/C][C]-0.1325[/C][C]0.447517[/C][/ROW]
[ROW][C]57[/C][C]0.018104[/C][C]0.1391[/C][C]0.444938[/C][/ROW]
[ROW][C]58[/C][C]-0.00201[/C][C]-0.0154[/C][C]0.493867[/C][/ROW]
[ROW][C]59[/C][C]NA[/C][C]NA[/C][C]NA[/C][/ROW]
[ROW][C]60[/C][C]NA[/C][C]NA[/C][C]NA[/C][/ROW]
[/TABLE]
Source: https://freestatistics.org/blog/index.php?pk=64574&T=1

Globally Unique Identifier (entire table): ba.freestatistics.org/blog/index.php?pk=64574&T=1

As an alternative you can also use a QR Code:  

The GUIDs for individual cells are displayed in the table below:

Autocorrelation Function
Time lag kACF(k)T-STATP-value
1-0.400133-3.07350.001601
2-0.206669-1.58750.058877
30.258691.9870.025784
4-0.296928-2.28080.013095
5-0.129375-0.99380.162201
60.5921744.54861.4e-05
7-0.208768-1.60360.057074
8-0.233635-1.79460.038922
90.2300211.76680.041215
10-0.218382-1.67740.049375
11-0.150505-1.15610.12616
120.5833294.48061.7e-05
13-0.240974-1.8510.034592
14-0.163223-1.25370.10744
150.1805271.38670.085383
16-0.177078-1.36020.089477
17-0.110755-0.85070.199181
180.3966333.04660.001729
19-0.122359-0.93990.175562
20-0.190357-1.46220.074502
210.1963461.50820.068425
22-0.161318-1.23910.110107
23-0.15993-1.22840.112078
240.4874963.74450.000206
25-0.213931-1.64320.052827
26-0.086355-0.66330.25486
270.1223560.93980.175568
28-0.150618-1.15690.125984
29-0.071541-0.54950.292361
300.283152.17490.016828
31-0.069887-0.53680.296707
32-0.128414-0.98640.16399
330.0949980.72970.234233
34-0.087398-0.67130.252319
35-0.09962-0.76520.223602
360.3086472.37080.010519
37-0.092134-0.70770.240962
38-0.106855-0.82080.207542
390.0617150.4740.318609
40-0.044407-0.34110.367122
41-0.092738-0.71230.239533
420.2585461.98590.025847
43-0.111137-0.85370.198373
44-0.066448-0.51040.305838
450.0608110.46710.321075
46-0.051769-0.39760.346164
47-0.04002-0.30740.37981
480.1778111.36580.088594
49-0.118703-0.91180.182799
50-0.012372-0.0950.462305
510.056140.43120.333941
52-0.04844-0.37210.355585
530.0024670.01890.492474
540.0310460.23850.406171
55-0.018567-0.14260.443538
56-0.017251-0.13250.447517
570.0181040.13910.444938
58-0.00201-0.01540.493867
59NANANA
60NANANA


Partial Autocorrelation Function
Time lag kPACF(k)T-STATP-value
1-0.400133-3.07350.001601
2-0.436693-3.35430.000698
3-0.051276-0.39390.347553
4-0.382459-2.93770.002355
5-0.616248-4.73357e-06
60.0285270.21910.413658
70.1893341.45430.075581
8-0.074107-0.56920.28568
9-0.126039-0.96810.168467
10-0.043037-0.33060.37107
11-0.282121-2.1670.017142
120.0520190.39960.345458
130.03230.24810.40246
140.0869710.6680.253357
150.0097870.07520.470164
160.1334651.02520.154735
170.0558250.42880.334815
18-0.108802-0.83570.203341
19-0.067239-0.51650.303728
20-0.066725-0.51250.305099
21-0.017455-0.13410.446901
22-0.058247-0.44740.328112
23-0.255846-1.96520.027053
240.0431490.33140.370747
25-0.027269-0.20950.417407
260.0815460.62640.266744
27-0.041248-0.31680.376244
280.0080390.06170.475486
290.1116120.85730.197371
30-0.067806-0.52080.302218
31-0.028446-0.21850.413897
32-0.008896-0.06830.472877
33-0.092521-0.71070.240045
34-0.034041-0.26150.397318
35-0.05455-0.4190.338367
36-0.022825-0.17530.430713
37-0.001972-0.01520.493982
38-0.051296-0.3940.347495
39-0.044141-0.33910.367887
40-0.012184-0.09360.462876
41-0.025097-0.19280.4239
420.1570851.20660.116202
43-0.073172-0.5620.288108
440.0802840.61670.26991
450.0596180.45790.32434
460.0878660.67490.251185
470.1627461.25010.108104
48-0.039389-0.30260.381648
49-0.105646-0.81150.210175
50-0.118061-0.90680.184089
510.0017010.01310.49481
52-0.011191-0.0860.465895
530.0308240.23680.406829
54-0.118833-0.91280.182537
550.0151650.11650.453832
56-0.021711-0.16680.434062
57-0.055823-0.42880.33482
58-0.131956-1.01360.157463
59NANANA
60NANANA

\begin{tabular}{lllllllll}
\hline
Partial Autocorrelation Function \tabularnewline
Time lag k & PACF(k) & T-STAT & P-value \tabularnewline
1 & -0.400133 & -3.0735 & 0.001601 \tabularnewline
2 & -0.436693 & -3.3543 & 0.000698 \tabularnewline
3 & -0.051276 & -0.3939 & 0.347553 \tabularnewline
4 & -0.382459 & -2.9377 & 0.002355 \tabularnewline
5 & -0.616248 & -4.7335 & 7e-06 \tabularnewline
6 & 0.028527 & 0.2191 & 0.413658 \tabularnewline
7 & 0.189334 & 1.4543 & 0.075581 \tabularnewline
8 & -0.074107 & -0.5692 & 0.28568 \tabularnewline
9 & -0.126039 & -0.9681 & 0.168467 \tabularnewline
10 & -0.043037 & -0.3306 & 0.37107 \tabularnewline
11 & -0.282121 & -2.167 & 0.017142 \tabularnewline
12 & 0.052019 & 0.3996 & 0.345458 \tabularnewline
13 & 0.0323 & 0.2481 & 0.40246 \tabularnewline
14 & 0.086971 & 0.668 & 0.253357 \tabularnewline
15 & 0.009787 & 0.0752 & 0.470164 \tabularnewline
16 & 0.133465 & 1.0252 & 0.154735 \tabularnewline
17 & 0.055825 & 0.4288 & 0.334815 \tabularnewline
18 & -0.108802 & -0.8357 & 0.203341 \tabularnewline
19 & -0.067239 & -0.5165 & 0.303728 \tabularnewline
20 & -0.066725 & -0.5125 & 0.305099 \tabularnewline
21 & -0.017455 & -0.1341 & 0.446901 \tabularnewline
22 & -0.058247 & -0.4474 & 0.328112 \tabularnewline
23 & -0.255846 & -1.9652 & 0.027053 \tabularnewline
24 & 0.043149 & 0.3314 & 0.370747 \tabularnewline
25 & -0.027269 & -0.2095 & 0.417407 \tabularnewline
26 & 0.081546 & 0.6264 & 0.266744 \tabularnewline
27 & -0.041248 & -0.3168 & 0.376244 \tabularnewline
28 & 0.008039 & 0.0617 & 0.475486 \tabularnewline
29 & 0.111612 & 0.8573 & 0.197371 \tabularnewline
30 & -0.067806 & -0.5208 & 0.302218 \tabularnewline
31 & -0.028446 & -0.2185 & 0.413897 \tabularnewline
32 & -0.008896 & -0.0683 & 0.472877 \tabularnewline
33 & -0.092521 & -0.7107 & 0.240045 \tabularnewline
34 & -0.034041 & -0.2615 & 0.397318 \tabularnewline
35 & -0.05455 & -0.419 & 0.338367 \tabularnewline
36 & -0.022825 & -0.1753 & 0.430713 \tabularnewline
37 & -0.001972 & -0.0152 & 0.493982 \tabularnewline
38 & -0.051296 & -0.394 & 0.347495 \tabularnewline
39 & -0.044141 & -0.3391 & 0.367887 \tabularnewline
40 & -0.012184 & -0.0936 & 0.462876 \tabularnewline
41 & -0.025097 & -0.1928 & 0.4239 \tabularnewline
42 & 0.157085 & 1.2066 & 0.116202 \tabularnewline
43 & -0.073172 & -0.562 & 0.288108 \tabularnewline
44 & 0.080284 & 0.6167 & 0.26991 \tabularnewline
45 & 0.059618 & 0.4579 & 0.32434 \tabularnewline
46 & 0.087866 & 0.6749 & 0.251185 \tabularnewline
47 & 0.162746 & 1.2501 & 0.108104 \tabularnewline
48 & -0.039389 & -0.3026 & 0.381648 \tabularnewline
49 & -0.105646 & -0.8115 & 0.210175 \tabularnewline
50 & -0.118061 & -0.9068 & 0.184089 \tabularnewline
51 & 0.001701 & 0.0131 & 0.49481 \tabularnewline
52 & -0.011191 & -0.086 & 0.465895 \tabularnewline
53 & 0.030824 & 0.2368 & 0.406829 \tabularnewline
54 & -0.118833 & -0.9128 & 0.182537 \tabularnewline
55 & 0.015165 & 0.1165 & 0.453832 \tabularnewline
56 & -0.021711 & -0.1668 & 0.434062 \tabularnewline
57 & -0.055823 & -0.4288 & 0.33482 \tabularnewline
58 & -0.131956 & -1.0136 & 0.157463 \tabularnewline
59 & NA & NA & NA \tabularnewline
60 & NA & NA & NA \tabularnewline
\hline
\end{tabular}
%Source: https://freestatistics.org/blog/index.php?pk=64574&T=2

[TABLE]
[ROW][C]Partial Autocorrelation Function[/C][/ROW]
[ROW][C]Time lag k[/C][C]PACF(k)[/C][C]T-STAT[/C][C]P-value[/C][/ROW]
[ROW][C]1[/C][C]-0.400133[/C][C]-3.0735[/C][C]0.001601[/C][/ROW]
[ROW][C]2[/C][C]-0.436693[/C][C]-3.3543[/C][C]0.000698[/C][/ROW]
[ROW][C]3[/C][C]-0.051276[/C][C]-0.3939[/C][C]0.347553[/C][/ROW]
[ROW][C]4[/C][C]-0.382459[/C][C]-2.9377[/C][C]0.002355[/C][/ROW]
[ROW][C]5[/C][C]-0.616248[/C][C]-4.7335[/C][C]7e-06[/C][/ROW]
[ROW][C]6[/C][C]0.028527[/C][C]0.2191[/C][C]0.413658[/C][/ROW]
[ROW][C]7[/C][C]0.189334[/C][C]1.4543[/C][C]0.075581[/C][/ROW]
[ROW][C]8[/C][C]-0.074107[/C][C]-0.5692[/C][C]0.28568[/C][/ROW]
[ROW][C]9[/C][C]-0.126039[/C][C]-0.9681[/C][C]0.168467[/C][/ROW]
[ROW][C]10[/C][C]-0.043037[/C][C]-0.3306[/C][C]0.37107[/C][/ROW]
[ROW][C]11[/C][C]-0.282121[/C][C]-2.167[/C][C]0.017142[/C][/ROW]
[ROW][C]12[/C][C]0.052019[/C][C]0.3996[/C][C]0.345458[/C][/ROW]
[ROW][C]13[/C][C]0.0323[/C][C]0.2481[/C][C]0.40246[/C][/ROW]
[ROW][C]14[/C][C]0.086971[/C][C]0.668[/C][C]0.253357[/C][/ROW]
[ROW][C]15[/C][C]0.009787[/C][C]0.0752[/C][C]0.470164[/C][/ROW]
[ROW][C]16[/C][C]0.133465[/C][C]1.0252[/C][C]0.154735[/C][/ROW]
[ROW][C]17[/C][C]0.055825[/C][C]0.4288[/C][C]0.334815[/C][/ROW]
[ROW][C]18[/C][C]-0.108802[/C][C]-0.8357[/C][C]0.203341[/C][/ROW]
[ROW][C]19[/C][C]-0.067239[/C][C]-0.5165[/C][C]0.303728[/C][/ROW]
[ROW][C]20[/C][C]-0.066725[/C][C]-0.5125[/C][C]0.305099[/C][/ROW]
[ROW][C]21[/C][C]-0.017455[/C][C]-0.1341[/C][C]0.446901[/C][/ROW]
[ROW][C]22[/C][C]-0.058247[/C][C]-0.4474[/C][C]0.328112[/C][/ROW]
[ROW][C]23[/C][C]-0.255846[/C][C]-1.9652[/C][C]0.027053[/C][/ROW]
[ROW][C]24[/C][C]0.043149[/C][C]0.3314[/C][C]0.370747[/C][/ROW]
[ROW][C]25[/C][C]-0.027269[/C][C]-0.2095[/C][C]0.417407[/C][/ROW]
[ROW][C]26[/C][C]0.081546[/C][C]0.6264[/C][C]0.266744[/C][/ROW]
[ROW][C]27[/C][C]-0.041248[/C][C]-0.3168[/C][C]0.376244[/C][/ROW]
[ROW][C]28[/C][C]0.008039[/C][C]0.0617[/C][C]0.475486[/C][/ROW]
[ROW][C]29[/C][C]0.111612[/C][C]0.8573[/C][C]0.197371[/C][/ROW]
[ROW][C]30[/C][C]-0.067806[/C][C]-0.5208[/C][C]0.302218[/C][/ROW]
[ROW][C]31[/C][C]-0.028446[/C][C]-0.2185[/C][C]0.413897[/C][/ROW]
[ROW][C]32[/C][C]-0.008896[/C][C]-0.0683[/C][C]0.472877[/C][/ROW]
[ROW][C]33[/C][C]-0.092521[/C][C]-0.7107[/C][C]0.240045[/C][/ROW]
[ROW][C]34[/C][C]-0.034041[/C][C]-0.2615[/C][C]0.397318[/C][/ROW]
[ROW][C]35[/C][C]-0.05455[/C][C]-0.419[/C][C]0.338367[/C][/ROW]
[ROW][C]36[/C][C]-0.022825[/C][C]-0.1753[/C][C]0.430713[/C][/ROW]
[ROW][C]37[/C][C]-0.001972[/C][C]-0.0152[/C][C]0.493982[/C][/ROW]
[ROW][C]38[/C][C]-0.051296[/C][C]-0.394[/C][C]0.347495[/C][/ROW]
[ROW][C]39[/C][C]-0.044141[/C][C]-0.3391[/C][C]0.367887[/C][/ROW]
[ROW][C]40[/C][C]-0.012184[/C][C]-0.0936[/C][C]0.462876[/C][/ROW]
[ROW][C]41[/C][C]-0.025097[/C][C]-0.1928[/C][C]0.4239[/C][/ROW]
[ROW][C]42[/C][C]0.157085[/C][C]1.2066[/C][C]0.116202[/C][/ROW]
[ROW][C]43[/C][C]-0.073172[/C][C]-0.562[/C][C]0.288108[/C][/ROW]
[ROW][C]44[/C][C]0.080284[/C][C]0.6167[/C][C]0.26991[/C][/ROW]
[ROW][C]45[/C][C]0.059618[/C][C]0.4579[/C][C]0.32434[/C][/ROW]
[ROW][C]46[/C][C]0.087866[/C][C]0.6749[/C][C]0.251185[/C][/ROW]
[ROW][C]47[/C][C]0.162746[/C][C]1.2501[/C][C]0.108104[/C][/ROW]
[ROW][C]48[/C][C]-0.039389[/C][C]-0.3026[/C][C]0.381648[/C][/ROW]
[ROW][C]49[/C][C]-0.105646[/C][C]-0.8115[/C][C]0.210175[/C][/ROW]
[ROW][C]50[/C][C]-0.118061[/C][C]-0.9068[/C][C]0.184089[/C][/ROW]
[ROW][C]51[/C][C]0.001701[/C][C]0.0131[/C][C]0.49481[/C][/ROW]
[ROW][C]52[/C][C]-0.011191[/C][C]-0.086[/C][C]0.465895[/C][/ROW]
[ROW][C]53[/C][C]0.030824[/C][C]0.2368[/C][C]0.406829[/C][/ROW]
[ROW][C]54[/C][C]-0.118833[/C][C]-0.9128[/C][C]0.182537[/C][/ROW]
[ROW][C]55[/C][C]0.015165[/C][C]0.1165[/C][C]0.453832[/C][/ROW]
[ROW][C]56[/C][C]-0.021711[/C][C]-0.1668[/C][C]0.434062[/C][/ROW]
[ROW][C]57[/C][C]-0.055823[/C][C]-0.4288[/C][C]0.33482[/C][/ROW]
[ROW][C]58[/C][C]-0.131956[/C][C]-1.0136[/C][C]0.157463[/C][/ROW]
[ROW][C]59[/C][C]NA[/C][C]NA[/C][C]NA[/C][/ROW]
[ROW][C]60[/C][C]NA[/C][C]NA[/C][C]NA[/C][/ROW]
[/TABLE]
Source: https://freestatistics.org/blog/index.php?pk=64574&T=2

Globally Unique Identifier (entire table): ba.freestatistics.org/blog/index.php?pk=64574&T=2

As an alternative you can also use a QR Code:  

The GUIDs for individual cells are displayed in the table below:

Partial Autocorrelation Function
Time lag kPACF(k)T-STATP-value
1-0.400133-3.07350.001601
2-0.436693-3.35430.000698
3-0.051276-0.39390.347553
4-0.382459-2.93770.002355
5-0.616248-4.73357e-06
60.0285270.21910.413658
70.1893341.45430.075581
8-0.074107-0.56920.28568
9-0.126039-0.96810.168467
10-0.043037-0.33060.37107
11-0.282121-2.1670.017142
120.0520190.39960.345458
130.03230.24810.40246
140.0869710.6680.253357
150.0097870.07520.470164
160.1334651.02520.154735
170.0558250.42880.334815
18-0.108802-0.83570.203341
19-0.067239-0.51650.303728
20-0.066725-0.51250.305099
21-0.017455-0.13410.446901
22-0.058247-0.44740.328112
23-0.255846-1.96520.027053
240.0431490.33140.370747
25-0.027269-0.20950.417407
260.0815460.62640.266744
27-0.041248-0.31680.376244
280.0080390.06170.475486
290.1116120.85730.197371
30-0.067806-0.52080.302218
31-0.028446-0.21850.413897
32-0.008896-0.06830.472877
33-0.092521-0.71070.240045
34-0.034041-0.26150.397318
35-0.05455-0.4190.338367
36-0.022825-0.17530.430713
37-0.001972-0.01520.493982
38-0.051296-0.3940.347495
39-0.044141-0.33910.367887
40-0.012184-0.09360.462876
41-0.025097-0.19280.4239
420.1570851.20660.116202
43-0.073172-0.5620.288108
440.0802840.61670.26991
450.0596180.45790.32434
460.0878660.67490.251185
470.1627461.25010.108104
48-0.039389-0.30260.381648
49-0.105646-0.81150.210175
50-0.118061-0.90680.184089
510.0017010.01310.49481
52-0.011191-0.0860.465895
530.0308240.23680.406829
54-0.118833-0.91280.182537
550.0151650.11650.453832
56-0.021711-0.16680.434062
57-0.055823-0.42880.33482
58-0.131956-1.01360.157463
59NANANA
60NANANA


Parameters (Session):
par1 = 60 ; par2 = 1 ; par3 = 1 ; par4 = 0 ; par5 = 12 ; par6 = White Noise ; par7 = 0.95 ;
Parameters (R input):
par1 = 60 ; par2 = 1 ; par3 = 1 ; par4 = 0 ; par5 = 12 ; par6 = White Noise ; par7 = 0.95 ;
R code (references can be found in the software module):
if (par1 == 'Default') {
par1 = 10*log10(length(x))
} else {
par1 <- as.numeric(par1)
}
par2 <- as.numeric(par2)
par3 <- as.numeric(par3)
par4 <- as.numeric(par4)
par5 <- as.numeric(par5)
if (par6 == 'White Noise') par6 <- 'white' else par6 <- 'ma'
par7 <- as.numeric(par7)
if (par2 == 0) {
x <- log(x)
} else {
x <- (x ^ par2 - 1) / par2
}
if (par3 > 0) x <- diff(x,lag=1,difference=par3)
if (par4 > 0) x <- diff(x,lag=par5,difference=par4)
bitmap(file='pic1.png')
racf <- acf(x, par1, main='Autocorrelation', xlab='time lag', ylab='ACF', ci.type=par6, ci=par7, sub=paste('(lambda=',par2,', d=',par3,', D=',par4,', CI=', par7, ', CI type=',par6,')',sep=''))
dev.off()
bitmap(file='pic2.png')
rpacf <- pacf(x,par1,main='Partial Autocorrelation',xlab='lags',ylab='PACF')
dev.off()
(myacf <- c(racf$acf))
(mypacf <- c(rpacf$acf))
lengthx <- length(x)
sqrtn <- sqrt(lengthx)
load(file='createtable')
a<-table.start()
a<-table.row.start(a)
a<-table.element(a,'Autocorrelation Function',4,TRUE)
a<-table.row.end(a)
a<-table.row.start(a)
a<-table.element(a,'Time lag k',header=TRUE)
a<-table.element(a,hyperlink('basics.htm','ACF(k)','click here for more information about the Autocorrelation Function'),header=TRUE)
a<-table.element(a,'T-STAT',header=TRUE)
a<-table.element(a,'P-value',header=TRUE)
a<-table.row.end(a)
for (i in 2:(par1+1)) {
a<-table.row.start(a)
a<-table.element(a,i-1,header=TRUE)
a<-table.element(a,round(myacf[i],6))
mytstat <- myacf[i]*sqrtn
a<-table.element(a,round(mytstat,4))
a<-table.element(a,round(1-pt(abs(mytstat),lengthx),6))
a<-table.row.end(a)
}
a<-table.end(a)
table.save(a,file='mytable.tab')
a<-table.start()
a<-table.row.start(a)
a<-table.element(a,'Partial Autocorrelation Function',4,TRUE)
a<-table.row.end(a)
a<-table.row.start(a)
a<-table.element(a,'Time lag k',header=TRUE)
a<-table.element(a,hyperlink('basics.htm','PACF(k)','click here for more information about the Partial Autocorrelation Function'),header=TRUE)
a<-table.element(a,'T-STAT',header=TRUE)
a<-table.element(a,'P-value',header=TRUE)
a<-table.row.end(a)
for (i in 1:par1) {
a<-table.row.start(a)
a<-table.element(a,i,header=TRUE)
a<-table.element(a,round(mypacf[i],6))
mytstat <- mypacf[i]*sqrtn
a<-table.element(a,round(mytstat,4))
a<-table.element(a,round(1-pt(abs(mytstat),lengthx),6))
a<-table.row.end(a)
}
a<-table.end(a)
table.save(a,file='mytable1.tab')