Free Statistics

of Irreproducible Research!

Author's title

Author*Unverified author*
R Software Modulerwasp_autocorrelation.wasp
Title produced by software(Partial) Autocorrelation Function
Date of computationWed, 09 Dec 2009 02:57:16 -0700
Cite this page as followsStatistical Computations at FreeStatistics.org, Office for Research Development and Education, URL https://freestatistics.org/blog/index.php?v=date/2009/Dec/09/t1260352686k00wwfq6um9x2df.htm/, Retrieved Mon, 29 Apr 2024 16:08:29 +0000
Statistical Computations at FreeStatistics.org, Office for Research Development and Education, URL https://freestatistics.org/blog/index.php?pk=64901, Retrieved Mon, 29 Apr 2024 16:08:29 +0000
QR Codes:

Original text written by user:
IsPrivate?No (this computation is public)
User-defined keywordsKDGP2W21
Estimated Impact139
Family? (F = Feedback message, R = changed R code, M = changed R Module, P = changed Parameters, D = changed Data)
-       [(Partial) Autocorrelation Function] [] [2009-12-09 09:57:16] [4ed6a647410123598b51b3bdc215cd7e] [Current]
Feedback Forum

Post a new message
Dataseries X:
8.82000
8.80000
8.82000
8.58000
8.54000
8.42000
8.43000
8.44000
8.09000
7.69000
7.56000
7.54000
7.40000
7.39000
7.37000
7.31000
7.35000
7.26000
7.37000
7.35000
7.33000
7.32000
7.31000
7.33000
7.32000
7.27000
7.48000
7.70000
7.77000
7.80000
7.84000
7.81000
7.78000
7.82000
7.80000
7.81000
7.80000
7.66000
7.41000
7.35000
7.39000
7.32000
7.32000
7.30000
7.29000
7.26000
7.22000
7.21000
7.21000
7.21000
7.20000
7.19000
7.18000
7.12000
7.12000
7.07000
7.08000
7.05000
7.06000
7.07000
7.08000
7.08000
7.09000
7.07000
7.06000
6.99000
6.99000
6.99000
6.98000
6.96000
6.95000
6.91000
6.91000
6.87000
6.91000
6.89000
6.88000
6.90000
6.91000
6.85000
6.86000
6.82000
6.80000
6.83000
6.84000
6.89000
7.14000
7.21000
7.25000
7.31000
7.30000
7.48000
7.49000
7.40000
7.44000
7.42000
7.14000
7.24000
7.33000
7.61000
7.66000
7.69000
7.70000
7.68000
7.71000
7.71000
7.72000
7.68000
7.72000
7.74000
7.76000
7.90000
7.97000
7.96000
7.95000
7.97000
7.93000
7.99000
7.96000
7.92000
7.97000
7.98000
8.00000
8.04000
8.17000
8.29000
8.26000
8.30000
8.32000
8.28000
8.27000
8.32000


Summary of computational transaction
Raw Inputview raw input (R code)
Raw Outputview raw output of R engine
Computing time2 seconds
R Server'Gwilym Jenkins' @ 72.249.127.135

\begin{tabular}{lllllllll}
\hline
Summary of computational transaction \tabularnewline
Raw Input & view raw input (R code)  \tabularnewline
Raw Output & view raw output of R engine  \tabularnewline
Computing time & 2 seconds \tabularnewline
R Server & 'Gwilym Jenkins' @ 72.249.127.135 \tabularnewline
\hline
\end{tabular}
%Source: https://freestatistics.org/blog/index.php?pk=64901&T=0

[TABLE]
[ROW][C]Summary of computational transaction[/C][/ROW]
[ROW][C]Raw Input[/C][C]view raw input (R code) [/C][/ROW]
[ROW][C]Raw Output[/C][C]view raw output of R engine [/C][/ROW]
[ROW][C]Computing time[/C][C]2 seconds[/C][/ROW]
[ROW][C]R Server[/C][C]'Gwilym Jenkins' @ 72.249.127.135[/C][/ROW]
[/TABLE]
Source: https://freestatistics.org/blog/index.php?pk=64901&T=0

Globally Unique Identifier (entire table): ba.freestatistics.org/blog/index.php?pk=64901&T=0

As an alternative you can also use a QR Code:  

The GUIDs for individual cells are displayed in the table below:

Summary of computational transaction
Raw Inputview raw input (R code)
Raw Outputview raw output of R engine
Computing time2 seconds
R Server'Gwilym Jenkins' @ 72.249.127.135


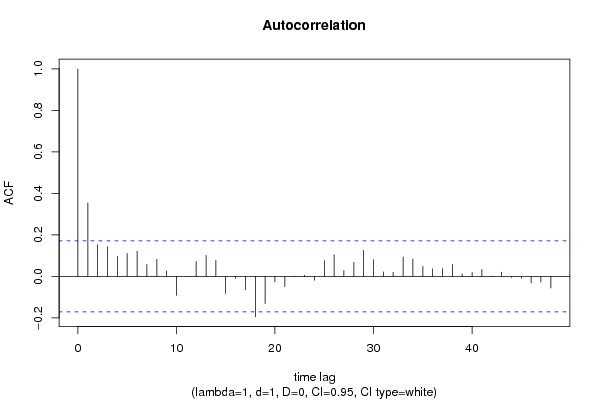
Autocorrelation Function
Time lag kACF(k)T-STATP-value
10.354054.05234.3e-05
20.1520261.740.042103
30.1431021.63790.051924
40.0968161.10810.134923
50.1108571.26880.103378
60.1206741.38120.084787
70.057340.65630.256395
80.0822450.94130.174131
90.02620.29990.382375
10-0.091271-1.04460.149056
110.0004690.00540.497861
120.072310.82760.204694
130.1012661.1590.124275
140.076850.87960.190348
15-0.081913-0.93750.175103
16-0.010017-0.11470.454448
17-0.064801-0.74170.229804
18-0.193982-2.22020.014061
19-0.131048-1.49990.068021
20-0.025774-0.2950.384231
21-0.048812-0.55870.288669
220.0011910.01360.494572
230.0050280.05760.477097
24-0.017929-0.20520.418863
250.075670.86610.194015
260.1042051.19270.117575
270.0279490.31990.37478
280.0680550.77890.218716
290.1257651.43950.076204
300.0805850.92230.179025
310.021540.24650.402828
320.0195970.22430.411437
330.0937161.07260.142704
340.0838790.960.169401
350.0481350.55090.291311
360.0363210.41570.33915
370.0376830.43130.333478
380.0576730.66010.255176
390.0123590.14150.443866
400.0188910.21620.414579
410.0332980.38110.35187
420.001220.0140.494442
430.0200830.22990.40928
44-0.004826-0.05520.478016
45-0.009478-0.10850.456892
46-0.031057-0.35550.361409
47-0.027024-0.30930.37879
48-0.055762-0.63820.262222

\begin{tabular}{lllllllll}
\hline
Autocorrelation Function \tabularnewline
Time lag k & ACF(k) & T-STAT & P-value \tabularnewline
1 & 0.35405 & 4.0523 & 4.3e-05 \tabularnewline
2 & 0.152026 & 1.74 & 0.042103 \tabularnewline
3 & 0.143102 & 1.6379 & 0.051924 \tabularnewline
4 & 0.096816 & 1.1081 & 0.134923 \tabularnewline
5 & 0.110857 & 1.2688 & 0.103378 \tabularnewline
6 & 0.120674 & 1.3812 & 0.084787 \tabularnewline
7 & 0.05734 & 0.6563 & 0.256395 \tabularnewline
8 & 0.082245 & 0.9413 & 0.174131 \tabularnewline
9 & 0.0262 & 0.2999 & 0.382375 \tabularnewline
10 & -0.091271 & -1.0446 & 0.149056 \tabularnewline
11 & 0.000469 & 0.0054 & 0.497861 \tabularnewline
12 & 0.07231 & 0.8276 & 0.204694 \tabularnewline
13 & 0.101266 & 1.159 & 0.124275 \tabularnewline
14 & 0.07685 & 0.8796 & 0.190348 \tabularnewline
15 & -0.081913 & -0.9375 & 0.175103 \tabularnewline
16 & -0.010017 & -0.1147 & 0.454448 \tabularnewline
17 & -0.064801 & -0.7417 & 0.229804 \tabularnewline
18 & -0.193982 & -2.2202 & 0.014061 \tabularnewline
19 & -0.131048 & -1.4999 & 0.068021 \tabularnewline
20 & -0.025774 & -0.295 & 0.384231 \tabularnewline
21 & -0.048812 & -0.5587 & 0.288669 \tabularnewline
22 & 0.001191 & 0.0136 & 0.494572 \tabularnewline
23 & 0.005028 & 0.0576 & 0.477097 \tabularnewline
24 & -0.017929 & -0.2052 & 0.418863 \tabularnewline
25 & 0.07567 & 0.8661 & 0.194015 \tabularnewline
26 & 0.104205 & 1.1927 & 0.117575 \tabularnewline
27 & 0.027949 & 0.3199 & 0.37478 \tabularnewline
28 & 0.068055 & 0.7789 & 0.218716 \tabularnewline
29 & 0.125765 & 1.4395 & 0.076204 \tabularnewline
30 & 0.080585 & 0.9223 & 0.179025 \tabularnewline
31 & 0.02154 & 0.2465 & 0.402828 \tabularnewline
32 & 0.019597 & 0.2243 & 0.411437 \tabularnewline
33 & 0.093716 & 1.0726 & 0.142704 \tabularnewline
34 & 0.083879 & 0.96 & 0.169401 \tabularnewline
35 & 0.048135 & 0.5509 & 0.291311 \tabularnewline
36 & 0.036321 & 0.4157 & 0.33915 \tabularnewline
37 & 0.037683 & 0.4313 & 0.333478 \tabularnewline
38 & 0.057673 & 0.6601 & 0.255176 \tabularnewline
39 & 0.012359 & 0.1415 & 0.443866 \tabularnewline
40 & 0.018891 & 0.2162 & 0.414579 \tabularnewline
41 & 0.033298 & 0.3811 & 0.35187 \tabularnewline
42 & 0.00122 & 0.014 & 0.494442 \tabularnewline
43 & 0.020083 & 0.2299 & 0.40928 \tabularnewline
44 & -0.004826 & -0.0552 & 0.478016 \tabularnewline
45 & -0.009478 & -0.1085 & 0.456892 \tabularnewline
46 & -0.031057 & -0.3555 & 0.361409 \tabularnewline
47 & -0.027024 & -0.3093 & 0.37879 \tabularnewline
48 & -0.055762 & -0.6382 & 0.262222 \tabularnewline
\hline
\end{tabular}
%Source: https://freestatistics.org/blog/index.php?pk=64901&T=1

[TABLE]
[ROW][C]Autocorrelation Function[/C][/ROW]
[ROW][C]Time lag k[/C][C]ACF(k)[/C][C]T-STAT[/C][C]P-value[/C][/ROW]
[ROW][C]1[/C][C]0.35405[/C][C]4.0523[/C][C]4.3e-05[/C][/ROW]
[ROW][C]2[/C][C]0.152026[/C][C]1.74[/C][C]0.042103[/C][/ROW]
[ROW][C]3[/C][C]0.143102[/C][C]1.6379[/C][C]0.051924[/C][/ROW]
[ROW][C]4[/C][C]0.096816[/C][C]1.1081[/C][C]0.134923[/C][/ROW]
[ROW][C]5[/C][C]0.110857[/C][C]1.2688[/C][C]0.103378[/C][/ROW]
[ROW][C]6[/C][C]0.120674[/C][C]1.3812[/C][C]0.084787[/C][/ROW]
[ROW][C]7[/C][C]0.05734[/C][C]0.6563[/C][C]0.256395[/C][/ROW]
[ROW][C]8[/C][C]0.082245[/C][C]0.9413[/C][C]0.174131[/C][/ROW]
[ROW][C]9[/C][C]0.0262[/C][C]0.2999[/C][C]0.382375[/C][/ROW]
[ROW][C]10[/C][C]-0.091271[/C][C]-1.0446[/C][C]0.149056[/C][/ROW]
[ROW][C]11[/C][C]0.000469[/C][C]0.0054[/C][C]0.497861[/C][/ROW]
[ROW][C]12[/C][C]0.07231[/C][C]0.8276[/C][C]0.204694[/C][/ROW]
[ROW][C]13[/C][C]0.101266[/C][C]1.159[/C][C]0.124275[/C][/ROW]
[ROW][C]14[/C][C]0.07685[/C][C]0.8796[/C][C]0.190348[/C][/ROW]
[ROW][C]15[/C][C]-0.081913[/C][C]-0.9375[/C][C]0.175103[/C][/ROW]
[ROW][C]16[/C][C]-0.010017[/C][C]-0.1147[/C][C]0.454448[/C][/ROW]
[ROW][C]17[/C][C]-0.064801[/C][C]-0.7417[/C][C]0.229804[/C][/ROW]
[ROW][C]18[/C][C]-0.193982[/C][C]-2.2202[/C][C]0.014061[/C][/ROW]
[ROW][C]19[/C][C]-0.131048[/C][C]-1.4999[/C][C]0.068021[/C][/ROW]
[ROW][C]20[/C][C]-0.025774[/C][C]-0.295[/C][C]0.384231[/C][/ROW]
[ROW][C]21[/C][C]-0.048812[/C][C]-0.5587[/C][C]0.288669[/C][/ROW]
[ROW][C]22[/C][C]0.001191[/C][C]0.0136[/C][C]0.494572[/C][/ROW]
[ROW][C]23[/C][C]0.005028[/C][C]0.0576[/C][C]0.477097[/C][/ROW]
[ROW][C]24[/C][C]-0.017929[/C][C]-0.2052[/C][C]0.418863[/C][/ROW]
[ROW][C]25[/C][C]0.07567[/C][C]0.8661[/C][C]0.194015[/C][/ROW]
[ROW][C]26[/C][C]0.104205[/C][C]1.1927[/C][C]0.117575[/C][/ROW]
[ROW][C]27[/C][C]0.027949[/C][C]0.3199[/C][C]0.37478[/C][/ROW]
[ROW][C]28[/C][C]0.068055[/C][C]0.7789[/C][C]0.218716[/C][/ROW]
[ROW][C]29[/C][C]0.125765[/C][C]1.4395[/C][C]0.076204[/C][/ROW]
[ROW][C]30[/C][C]0.080585[/C][C]0.9223[/C][C]0.179025[/C][/ROW]
[ROW][C]31[/C][C]0.02154[/C][C]0.2465[/C][C]0.402828[/C][/ROW]
[ROW][C]32[/C][C]0.019597[/C][C]0.2243[/C][C]0.411437[/C][/ROW]
[ROW][C]33[/C][C]0.093716[/C][C]1.0726[/C][C]0.142704[/C][/ROW]
[ROW][C]34[/C][C]0.083879[/C][C]0.96[/C][C]0.169401[/C][/ROW]
[ROW][C]35[/C][C]0.048135[/C][C]0.5509[/C][C]0.291311[/C][/ROW]
[ROW][C]36[/C][C]0.036321[/C][C]0.4157[/C][C]0.33915[/C][/ROW]
[ROW][C]37[/C][C]0.037683[/C][C]0.4313[/C][C]0.333478[/C][/ROW]
[ROW][C]38[/C][C]0.057673[/C][C]0.6601[/C][C]0.255176[/C][/ROW]
[ROW][C]39[/C][C]0.012359[/C][C]0.1415[/C][C]0.443866[/C][/ROW]
[ROW][C]40[/C][C]0.018891[/C][C]0.2162[/C][C]0.414579[/C][/ROW]
[ROW][C]41[/C][C]0.033298[/C][C]0.3811[/C][C]0.35187[/C][/ROW]
[ROW][C]42[/C][C]0.00122[/C][C]0.014[/C][C]0.494442[/C][/ROW]
[ROW][C]43[/C][C]0.020083[/C][C]0.2299[/C][C]0.40928[/C][/ROW]
[ROW][C]44[/C][C]-0.004826[/C][C]-0.0552[/C][C]0.478016[/C][/ROW]
[ROW][C]45[/C][C]-0.009478[/C][C]-0.1085[/C][C]0.456892[/C][/ROW]
[ROW][C]46[/C][C]-0.031057[/C][C]-0.3555[/C][C]0.361409[/C][/ROW]
[ROW][C]47[/C][C]-0.027024[/C][C]-0.3093[/C][C]0.37879[/C][/ROW]
[ROW][C]48[/C][C]-0.055762[/C][C]-0.6382[/C][C]0.262222[/C][/ROW]
[/TABLE]
Source: https://freestatistics.org/blog/index.php?pk=64901&T=1

Globally Unique Identifier (entire table): ba.freestatistics.org/blog/index.php?pk=64901&T=1

As an alternative you can also use a QR Code:  

The GUIDs for individual cells are displayed in the table below:

Autocorrelation Function
Time lag kACF(k)T-STATP-value
10.354054.05234.3e-05
20.1520261.740.042103
30.1431021.63790.051924
40.0968161.10810.134923
50.1108571.26880.103378
60.1206741.38120.084787
70.057340.65630.256395
80.0822450.94130.174131
90.02620.29990.382375
10-0.091271-1.04460.149056
110.0004690.00540.497861
120.072310.82760.204694
130.1012661.1590.124275
140.076850.87960.190348
15-0.081913-0.93750.175103
16-0.010017-0.11470.454448
17-0.064801-0.74170.229804
18-0.193982-2.22020.014061
19-0.131048-1.49990.068021
20-0.025774-0.2950.384231
21-0.048812-0.55870.288669
220.0011910.01360.494572
230.0050280.05760.477097
24-0.017929-0.20520.418863
250.075670.86610.194015
260.1042051.19270.117575
270.0279490.31990.37478
280.0680550.77890.218716
290.1257651.43950.076204
300.0805850.92230.179025
310.021540.24650.402828
320.0195970.22430.411437
330.0937161.07260.142704
340.0838790.960.169401
350.0481350.55090.291311
360.0363210.41570.33915
370.0376830.43130.333478
380.0576730.66010.255176
390.0123590.14150.443866
400.0188910.21620.414579
410.0332980.38110.35187
420.001220.0140.494442
430.0200830.22990.40928
44-0.004826-0.05520.478016
45-0.009478-0.10850.456892
46-0.031057-0.35550.361409
47-0.027024-0.30930.37879
48-0.055762-0.63820.262222


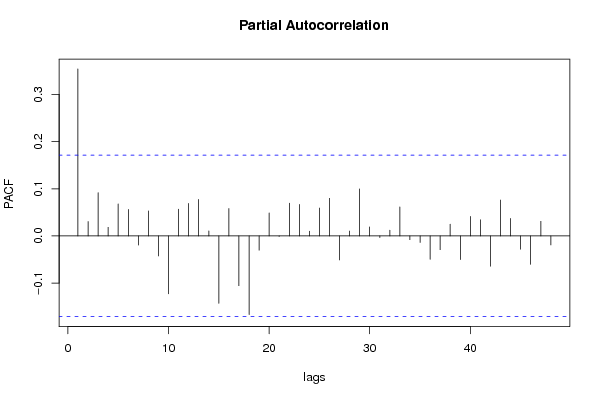
Partial Autocorrelation Function
Time lag kPACF(k)T-STATP-value
10.354054.05234.3e-05
20.0304970.34910.363803
30.0916891.04940.147956
40.0182130.20850.417596
50.0678240.77630.219491
60.0561080.64220.260939
7-0.019433-0.22240.412168
80.0528770.60520.273044
9-0.042515-0.48660.313676
10-0.12269-1.40420.081306
110.0566560.64850.258913
120.0688180.78770.216161
130.0772150.88380.189221
140.0105780.12110.451912
15-0.142969-1.63640.052083
160.0580050.66390.253961
17-0.105532-1.20790.114636
18-0.166876-1.910.029161
19-0.030431-0.34830.364088
200.0485940.55620.289519
21-0.001028-0.01180.495317
220.0695050.79550.213875
230.0668310.76490.222849
240.0099090.11340.45494
250.0589820.67510.250406
260.0796340.91150.181865
27-0.05098-0.58350.280282
280.0102190.1170.453536
290.0996561.14060.128055
300.0190580.21810.413834
31-0.003588-0.04110.48365
320.0121510.13910.444802
330.0614240.7030.241641
34-0.00814-0.09320.462955
35-0.013817-0.15810.437292
36-0.049586-0.56750.285658
37-0.029366-0.33610.368664
380.0248460.28440.388286
39-0.050159-0.57410.283444
400.0414070.47390.318172
410.0341950.39140.348075
42-0.064325-0.73620.231453
430.0761020.8710.192666
440.0370540.42410.336094
45-0.028223-0.3230.373594
46-0.060199-0.6890.246017
470.0309130.35380.362024
48-0.019053-0.21810.413858

\begin{tabular}{lllllllll}
\hline
Partial Autocorrelation Function \tabularnewline
Time lag k & PACF(k) & T-STAT & P-value \tabularnewline
1 & 0.35405 & 4.0523 & 4.3e-05 \tabularnewline
2 & 0.030497 & 0.3491 & 0.363803 \tabularnewline
3 & 0.091689 & 1.0494 & 0.147956 \tabularnewline
4 & 0.018213 & 0.2085 & 0.417596 \tabularnewline
5 & 0.067824 & 0.7763 & 0.219491 \tabularnewline
6 & 0.056108 & 0.6422 & 0.260939 \tabularnewline
7 & -0.019433 & -0.2224 & 0.412168 \tabularnewline
8 & 0.052877 & 0.6052 & 0.273044 \tabularnewline
9 & -0.042515 & -0.4866 & 0.313676 \tabularnewline
10 & -0.12269 & -1.4042 & 0.081306 \tabularnewline
11 & 0.056656 & 0.6485 & 0.258913 \tabularnewline
12 & 0.068818 & 0.7877 & 0.216161 \tabularnewline
13 & 0.077215 & 0.8838 & 0.189221 \tabularnewline
14 & 0.010578 & 0.1211 & 0.451912 \tabularnewline
15 & -0.142969 & -1.6364 & 0.052083 \tabularnewline
16 & 0.058005 & 0.6639 & 0.253961 \tabularnewline
17 & -0.105532 & -1.2079 & 0.114636 \tabularnewline
18 & -0.166876 & -1.91 & 0.029161 \tabularnewline
19 & -0.030431 & -0.3483 & 0.364088 \tabularnewline
20 & 0.048594 & 0.5562 & 0.289519 \tabularnewline
21 & -0.001028 & -0.0118 & 0.495317 \tabularnewline
22 & 0.069505 & 0.7955 & 0.213875 \tabularnewline
23 & 0.066831 & 0.7649 & 0.222849 \tabularnewline
24 & 0.009909 & 0.1134 & 0.45494 \tabularnewline
25 & 0.058982 & 0.6751 & 0.250406 \tabularnewline
26 & 0.079634 & 0.9115 & 0.181865 \tabularnewline
27 & -0.05098 & -0.5835 & 0.280282 \tabularnewline
28 & 0.010219 & 0.117 & 0.453536 \tabularnewline
29 & 0.099656 & 1.1406 & 0.128055 \tabularnewline
30 & 0.019058 & 0.2181 & 0.413834 \tabularnewline
31 & -0.003588 & -0.0411 & 0.48365 \tabularnewline
32 & 0.012151 & 0.1391 & 0.444802 \tabularnewline
33 & 0.061424 & 0.703 & 0.241641 \tabularnewline
34 & -0.00814 & -0.0932 & 0.462955 \tabularnewline
35 & -0.013817 & -0.1581 & 0.437292 \tabularnewline
36 & -0.049586 & -0.5675 & 0.285658 \tabularnewline
37 & -0.029366 & -0.3361 & 0.368664 \tabularnewline
38 & 0.024846 & 0.2844 & 0.388286 \tabularnewline
39 & -0.050159 & -0.5741 & 0.283444 \tabularnewline
40 & 0.041407 & 0.4739 & 0.318172 \tabularnewline
41 & 0.034195 & 0.3914 & 0.348075 \tabularnewline
42 & -0.064325 & -0.7362 & 0.231453 \tabularnewline
43 & 0.076102 & 0.871 & 0.192666 \tabularnewline
44 & 0.037054 & 0.4241 & 0.336094 \tabularnewline
45 & -0.028223 & -0.323 & 0.373594 \tabularnewline
46 & -0.060199 & -0.689 & 0.246017 \tabularnewline
47 & 0.030913 & 0.3538 & 0.362024 \tabularnewline
48 & -0.019053 & -0.2181 & 0.413858 \tabularnewline
\hline
\end{tabular}
%Source: https://freestatistics.org/blog/index.php?pk=64901&T=2

[TABLE]
[ROW][C]Partial Autocorrelation Function[/C][/ROW]
[ROW][C]Time lag k[/C][C]PACF(k)[/C][C]T-STAT[/C][C]P-value[/C][/ROW]
[ROW][C]1[/C][C]0.35405[/C][C]4.0523[/C][C]4.3e-05[/C][/ROW]
[ROW][C]2[/C][C]0.030497[/C][C]0.3491[/C][C]0.363803[/C][/ROW]
[ROW][C]3[/C][C]0.091689[/C][C]1.0494[/C][C]0.147956[/C][/ROW]
[ROW][C]4[/C][C]0.018213[/C][C]0.2085[/C][C]0.417596[/C][/ROW]
[ROW][C]5[/C][C]0.067824[/C][C]0.7763[/C][C]0.219491[/C][/ROW]
[ROW][C]6[/C][C]0.056108[/C][C]0.6422[/C][C]0.260939[/C][/ROW]
[ROW][C]7[/C][C]-0.019433[/C][C]-0.2224[/C][C]0.412168[/C][/ROW]
[ROW][C]8[/C][C]0.052877[/C][C]0.6052[/C][C]0.273044[/C][/ROW]
[ROW][C]9[/C][C]-0.042515[/C][C]-0.4866[/C][C]0.313676[/C][/ROW]
[ROW][C]10[/C][C]-0.12269[/C][C]-1.4042[/C][C]0.081306[/C][/ROW]
[ROW][C]11[/C][C]0.056656[/C][C]0.6485[/C][C]0.258913[/C][/ROW]
[ROW][C]12[/C][C]0.068818[/C][C]0.7877[/C][C]0.216161[/C][/ROW]
[ROW][C]13[/C][C]0.077215[/C][C]0.8838[/C][C]0.189221[/C][/ROW]
[ROW][C]14[/C][C]0.010578[/C][C]0.1211[/C][C]0.451912[/C][/ROW]
[ROW][C]15[/C][C]-0.142969[/C][C]-1.6364[/C][C]0.052083[/C][/ROW]
[ROW][C]16[/C][C]0.058005[/C][C]0.6639[/C][C]0.253961[/C][/ROW]
[ROW][C]17[/C][C]-0.105532[/C][C]-1.2079[/C][C]0.114636[/C][/ROW]
[ROW][C]18[/C][C]-0.166876[/C][C]-1.91[/C][C]0.029161[/C][/ROW]
[ROW][C]19[/C][C]-0.030431[/C][C]-0.3483[/C][C]0.364088[/C][/ROW]
[ROW][C]20[/C][C]0.048594[/C][C]0.5562[/C][C]0.289519[/C][/ROW]
[ROW][C]21[/C][C]-0.001028[/C][C]-0.0118[/C][C]0.495317[/C][/ROW]
[ROW][C]22[/C][C]0.069505[/C][C]0.7955[/C][C]0.213875[/C][/ROW]
[ROW][C]23[/C][C]0.066831[/C][C]0.7649[/C][C]0.222849[/C][/ROW]
[ROW][C]24[/C][C]0.009909[/C][C]0.1134[/C][C]0.45494[/C][/ROW]
[ROW][C]25[/C][C]0.058982[/C][C]0.6751[/C][C]0.250406[/C][/ROW]
[ROW][C]26[/C][C]0.079634[/C][C]0.9115[/C][C]0.181865[/C][/ROW]
[ROW][C]27[/C][C]-0.05098[/C][C]-0.5835[/C][C]0.280282[/C][/ROW]
[ROW][C]28[/C][C]0.010219[/C][C]0.117[/C][C]0.453536[/C][/ROW]
[ROW][C]29[/C][C]0.099656[/C][C]1.1406[/C][C]0.128055[/C][/ROW]
[ROW][C]30[/C][C]0.019058[/C][C]0.2181[/C][C]0.413834[/C][/ROW]
[ROW][C]31[/C][C]-0.003588[/C][C]-0.0411[/C][C]0.48365[/C][/ROW]
[ROW][C]32[/C][C]0.012151[/C][C]0.1391[/C][C]0.444802[/C][/ROW]
[ROW][C]33[/C][C]0.061424[/C][C]0.703[/C][C]0.241641[/C][/ROW]
[ROW][C]34[/C][C]-0.00814[/C][C]-0.0932[/C][C]0.462955[/C][/ROW]
[ROW][C]35[/C][C]-0.013817[/C][C]-0.1581[/C][C]0.437292[/C][/ROW]
[ROW][C]36[/C][C]-0.049586[/C][C]-0.5675[/C][C]0.285658[/C][/ROW]
[ROW][C]37[/C][C]-0.029366[/C][C]-0.3361[/C][C]0.368664[/C][/ROW]
[ROW][C]38[/C][C]0.024846[/C][C]0.2844[/C][C]0.388286[/C][/ROW]
[ROW][C]39[/C][C]-0.050159[/C][C]-0.5741[/C][C]0.283444[/C][/ROW]
[ROW][C]40[/C][C]0.041407[/C][C]0.4739[/C][C]0.318172[/C][/ROW]
[ROW][C]41[/C][C]0.034195[/C][C]0.3914[/C][C]0.348075[/C][/ROW]
[ROW][C]42[/C][C]-0.064325[/C][C]-0.7362[/C][C]0.231453[/C][/ROW]
[ROW][C]43[/C][C]0.076102[/C][C]0.871[/C][C]0.192666[/C][/ROW]
[ROW][C]44[/C][C]0.037054[/C][C]0.4241[/C][C]0.336094[/C][/ROW]
[ROW][C]45[/C][C]-0.028223[/C][C]-0.323[/C][C]0.373594[/C][/ROW]
[ROW][C]46[/C][C]-0.060199[/C][C]-0.689[/C][C]0.246017[/C][/ROW]
[ROW][C]47[/C][C]0.030913[/C][C]0.3538[/C][C]0.362024[/C][/ROW]
[ROW][C]48[/C][C]-0.019053[/C][C]-0.2181[/C][C]0.413858[/C][/ROW]
[/TABLE]
Source: https://freestatistics.org/blog/index.php?pk=64901&T=2

Globally Unique Identifier (entire table): ba.freestatistics.org/blog/index.php?pk=64901&T=2

As an alternative you can also use a QR Code:  

The GUIDs for individual cells are displayed in the table below:

Partial Autocorrelation Function
Time lag kPACF(k)T-STATP-value
10.354054.05234.3e-05
20.0304970.34910.363803
30.0916891.04940.147956
40.0182130.20850.417596
50.0678240.77630.219491
60.0561080.64220.260939
7-0.019433-0.22240.412168
80.0528770.60520.273044
9-0.042515-0.48660.313676
10-0.12269-1.40420.081306
110.0566560.64850.258913
120.0688180.78770.216161
130.0772150.88380.189221
140.0105780.12110.451912
15-0.142969-1.63640.052083
160.0580050.66390.253961
17-0.105532-1.20790.114636
18-0.166876-1.910.029161
19-0.030431-0.34830.364088
200.0485940.55620.289519
21-0.001028-0.01180.495317
220.0695050.79550.213875
230.0668310.76490.222849
240.0099090.11340.45494
250.0589820.67510.250406
260.0796340.91150.181865
27-0.05098-0.58350.280282
280.0102190.1170.453536
290.0996561.14060.128055
300.0190580.21810.413834
31-0.003588-0.04110.48365
320.0121510.13910.444802
330.0614240.7030.241641
34-0.00814-0.09320.462955
35-0.013817-0.15810.437292
36-0.049586-0.56750.285658
37-0.029366-0.33610.368664
380.0248460.28440.388286
39-0.050159-0.57410.283444
400.0414070.47390.318172
410.0341950.39140.348075
42-0.064325-0.73620.231453
430.0761020.8710.192666
440.0370540.42410.336094
45-0.028223-0.3230.373594
46-0.060199-0.6890.246017
470.0309130.35380.362024
48-0.019053-0.21810.413858


Parameters (Session):
par1 = 48 ; par2 = 1 ; par3 = 1 ; par4 = 0 ; par5 = 12 ; par6 = White Noise ; par7 = 0.95 ;
Parameters (R input):
par1 = 48 ; par2 = 1 ; par3 = 1 ; par4 = 0 ; par5 = 12 ; par6 = White Noise ; par7 = 0.95 ;
R code (references can be found in the software module):
if (par1 == 'Default') {
par1 = 10*log10(length(x))
} else {
par1 <- as.numeric(par1)
}
par2 <- as.numeric(par2)
par3 <- as.numeric(par3)
par4 <- as.numeric(par4)
par5 <- as.numeric(par5)
if (par6 == 'White Noise') par6 <- 'white' else par6 <- 'ma'
par7 <- as.numeric(par7)
if (par2 == 0) {
x <- log(x)
} else {
x <- (x ^ par2 - 1) / par2
}
if (par3 > 0) x <- diff(x,lag=1,difference=par3)
if (par4 > 0) x <- diff(x,lag=par5,difference=par4)
bitmap(file='pic1.png')
racf <- acf(x, par1, main='Autocorrelation', xlab='time lag', ylab='ACF', ci.type=par6, ci=par7, sub=paste('(lambda=',par2,', d=',par3,', D=',par4,', CI=', par7, ', CI type=',par6,')',sep=''))
dev.off()
bitmap(file='pic2.png')
rpacf <- pacf(x,par1,main='Partial Autocorrelation',xlab='lags',ylab='PACF')
dev.off()
(myacf <- c(racf$acf))
(mypacf <- c(rpacf$acf))
lengthx <- length(x)
sqrtn <- sqrt(lengthx)
load(file='createtable')
a<-table.start()
a<-table.row.start(a)
a<-table.element(a,'Autocorrelation Function',4,TRUE)
a<-table.row.end(a)
a<-table.row.start(a)
a<-table.element(a,'Time lag k',header=TRUE)
a<-table.element(a,hyperlink('basics.htm','ACF(k)','click here for more information about the Autocorrelation Function'),header=TRUE)
a<-table.element(a,'T-STAT',header=TRUE)
a<-table.element(a,'P-value',header=TRUE)
a<-table.row.end(a)
for (i in 2:(par1+1)) {
a<-table.row.start(a)
a<-table.element(a,i-1,header=TRUE)
a<-table.element(a,round(myacf[i],6))
mytstat <- myacf[i]*sqrtn
a<-table.element(a,round(mytstat,4))
a<-table.element(a,round(1-pt(abs(mytstat),lengthx),6))
a<-table.row.end(a)
}
a<-table.end(a)
table.save(a,file='mytable.tab')
a<-table.start()
a<-table.row.start(a)
a<-table.element(a,'Partial Autocorrelation Function',4,TRUE)
a<-table.row.end(a)
a<-table.row.start(a)
a<-table.element(a,'Time lag k',header=TRUE)
a<-table.element(a,hyperlink('basics.htm','PACF(k)','click here for more information about the Partial Autocorrelation Function'),header=TRUE)
a<-table.element(a,'T-STAT',header=TRUE)
a<-table.element(a,'P-value',header=TRUE)
a<-table.row.end(a)
for (i in 1:par1) {
a<-table.row.start(a)
a<-table.element(a,i,header=TRUE)
a<-table.element(a,round(mypacf[i],6))
mytstat <- mypacf[i]*sqrtn
a<-table.element(a,round(mytstat,4))
a<-table.element(a,round(1-pt(abs(mytstat),lengthx),6))
a<-table.row.end(a)
}
a<-table.end(a)
table.save(a,file='mytable1.tab')