Free Statistics

of Irreproducible Research!

Author's title

Author*The author of this computation has been verified*
R Software Modulerwasp_arimabackwardselection.wasp
Title produced by softwareARIMA Backward Selection
Date of computationWed, 09 Dec 2009 08:15:06 -0700
Cite this page as followsStatistical Computations at FreeStatistics.org, Office for Research Development and Education, URL https://freestatistics.org/blog/index.php?v=date/2009/Dec/09/t1260371791hwbe3cr33ntpgml.htm/, Retrieved Mon, 29 Apr 2024 13:20:53 +0000
Statistical Computations at FreeStatistics.org, Office for Research Development and Education, URL https://freestatistics.org/blog/index.php?pk=64989, Retrieved Mon, 29 Apr 2024 13:20:53 +0000
QR Codes:

Original text written by user:
IsPrivate?No (this computation is public)
User-defined keywordssdws paper
Estimated Impact94
Family? (F = Feedback message, R = changed R code, M = changed R Module, P = changed Parameters, D = changed Data)
-       [ARIMA Backward Selection] [ARIMA backward se...] [2009-12-09 15:15:06] [2d672adbf8ae6977476cb9852ecac1a3] [Current]
Feedback Forum

Post a new message
Dataseries X:
518585
509239
512238
519164
517009
509933
509127
500857
506971
569323
579714
577992
565464
547344
554788
562325
560854
555332
543599
536662
542722
593530
610763
612613
611324
594167
595454
590865
589379
584428
573100
567456
569028
620735
628884
628232
612117
595404
597141
593408
590072
579799
574205
572775
572942
619567
625809
619916
587625
565742
557274
560576
548854
531673
525919
511038
498662
555362
564591
541657
527070
509846
514258
516922
507561
492622
490243
469357
477580
528379
533590
517945
506174
501866
516141
528222
532638
536322
536535
523597
536214
586570
596594
580523
564478


Summary of computational transaction
Raw Inputview raw input (R code)
Raw Outputview raw output of R engine
Computing time10 seconds
R Server'Gwilym Jenkins' @ 72.249.127.135

\begin{tabular}{lllllllll}
\hline
Summary of computational transaction \tabularnewline
Raw Input & view raw input (R code)  \tabularnewline
Raw Output & view raw output of R engine  \tabularnewline
Computing time & 10 seconds \tabularnewline
R Server & 'Gwilym Jenkins' @ 72.249.127.135 \tabularnewline
\hline
\end{tabular}
%Source: https://freestatistics.org/blog/index.php?pk=64989&T=0

[TABLE]
[ROW][C]Summary of computational transaction[/C][/ROW]
[ROW][C]Raw Input[/C][C]view raw input (R code) [/C][/ROW]
[ROW][C]Raw Output[/C][C]view raw output of R engine [/C][/ROW]
[ROW][C]Computing time[/C][C]10 seconds[/C][/ROW]
[ROW][C]R Server[/C][C]'Gwilym Jenkins' @ 72.249.127.135[/C][/ROW]
[/TABLE]
Source: https://freestatistics.org/blog/index.php?pk=64989&T=0

Globally Unique Identifier (entire table): ba.freestatistics.org/blog/index.php?pk=64989&T=0

As an alternative you can also use a QR Code:  

The GUIDs for individual cells are displayed in the table below:

Summary of computational transaction
Raw Inputview raw input (R code)
Raw Outputview raw output of R engine
Computing time10 seconds
R Server'Gwilym Jenkins' @ 72.249.127.135


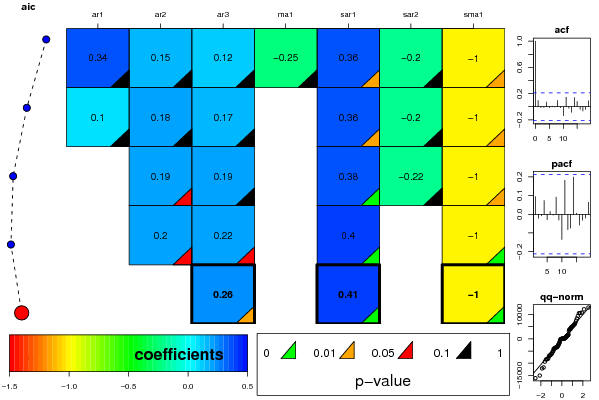
ARIMA Parameter Estimation and Backward Selection
Iterationar1ar2ar3ma1sar1sar2sma1
Estimates ( 1 )0.34150.14890.1189-0.24960.3562-0.2021-0.9993
(p-val)(0.5931 )(0.315 )(0.5425 )(0.6963 )(0.0131 )(0.1867 )(0.0352 )
Estimates ( 2 )0.09860.18140.167900.3594-0.2029-0.9981
(p-val)(0.4077 )(0.1222 )(0.1603 )(NA )(0.0118 )(0.1844 )(0.0243 )
Estimates ( 3 )00.19390.185700.3797-0.2157-0.9994
(p-val)(NA )(0.0981 )(0.1164 )(NA )(0.0075 )(0.1596 )(0.0207 )
Estimates ( 4 )00.19990.218800.39880-1
(p-val)(NA )(0.0824 )(0.0566 )(NA )(0.0078 )(NA )(1e-04 )
Estimates ( 5 )000.25700.40820-0.9999
(p-val)(NA )(NA )(0.0264 )(NA )(0.0074 )(NA )(0 )
Estimates ( 6 )NANANANANANANA
(p-val)(NA )(NA )(NA )(NA )(NA )(NA )(NA )
Estimates ( 7 )NANANANANANANA
(p-val)(NA )(NA )(NA )(NA )(NA )(NA )(NA )
Estimates ( 8 )NANANANANANANA
(p-val)(NA )(NA )(NA )(NA )(NA )(NA )(NA )
Estimates ( 9 )NANANANANANANA
(p-val)(NA )(NA )(NA )(NA )(NA )(NA )(NA )
Estimates ( 10 )NANANANANANANA
(p-val)(NA )(NA )(NA )(NA )(NA )(NA )(NA )
Estimates ( 11 )NANANANANANANA
(p-val)(NA )(NA )(NA )(NA )(NA )(NA )(NA )
Estimates ( 12 )NANANANANANANA
(p-val)(NA )(NA )(NA )(NA )(NA )(NA )(NA )
Estimates ( 13 )NANANANANANANA
(p-val)(NA )(NA )(NA )(NA )(NA )(NA )(NA )

\begin{tabular}{lllllllll}
\hline
ARIMA Parameter Estimation and Backward Selection \tabularnewline
Iteration & ar1 & ar2 & ar3 & ma1 & sar1 & sar2 & sma1 \tabularnewline
Estimates ( 1 ) & 0.3415 & 0.1489 & 0.1189 & -0.2496 & 0.3562 & -0.2021 & -0.9993 \tabularnewline
(p-val) & (0.5931 ) & (0.315 ) & (0.5425 ) & (0.6963 ) & (0.0131 ) & (0.1867 ) & (0.0352 ) \tabularnewline
Estimates ( 2 ) & 0.0986 & 0.1814 & 0.1679 & 0 & 0.3594 & -0.2029 & -0.9981 \tabularnewline
(p-val) & (0.4077 ) & (0.1222 ) & (0.1603 ) & (NA ) & (0.0118 ) & (0.1844 ) & (0.0243 ) \tabularnewline
Estimates ( 3 ) & 0 & 0.1939 & 0.1857 & 0 & 0.3797 & -0.2157 & -0.9994 \tabularnewline
(p-val) & (NA ) & (0.0981 ) & (0.1164 ) & (NA ) & (0.0075 ) & (0.1596 ) & (0.0207 ) \tabularnewline
Estimates ( 4 ) & 0 & 0.1999 & 0.2188 & 0 & 0.3988 & 0 & -1 \tabularnewline
(p-val) & (NA ) & (0.0824 ) & (0.0566 ) & (NA ) & (0.0078 ) & (NA ) & (1e-04 ) \tabularnewline
Estimates ( 5 ) & 0 & 0 & 0.257 & 0 & 0.4082 & 0 & -0.9999 \tabularnewline
(p-val) & (NA ) & (NA ) & (0.0264 ) & (NA ) & (0.0074 ) & (NA ) & (0 ) \tabularnewline
Estimates ( 6 ) & NA & NA & NA & NA & NA & NA & NA \tabularnewline
(p-val) & (NA ) & (NA ) & (NA ) & (NA ) & (NA ) & (NA ) & (NA ) \tabularnewline
Estimates ( 7 ) & NA & NA & NA & NA & NA & NA & NA \tabularnewline
(p-val) & (NA ) & (NA ) & (NA ) & (NA ) & (NA ) & (NA ) & (NA ) \tabularnewline
Estimates ( 8 ) & NA & NA & NA & NA & NA & NA & NA \tabularnewline
(p-val) & (NA ) & (NA ) & (NA ) & (NA ) & (NA ) & (NA ) & (NA ) \tabularnewline
Estimates ( 9 ) & NA & NA & NA & NA & NA & NA & NA \tabularnewline
(p-val) & (NA ) & (NA ) & (NA ) & (NA ) & (NA ) & (NA ) & (NA ) \tabularnewline
Estimates ( 10 ) & NA & NA & NA & NA & NA & NA & NA \tabularnewline
(p-val) & (NA ) & (NA ) & (NA ) & (NA ) & (NA ) & (NA ) & (NA ) \tabularnewline
Estimates ( 11 ) & NA & NA & NA & NA & NA & NA & NA \tabularnewline
(p-val) & (NA ) & (NA ) & (NA ) & (NA ) & (NA ) & (NA ) & (NA ) \tabularnewline
Estimates ( 12 ) & NA & NA & NA & NA & NA & NA & NA \tabularnewline
(p-val) & (NA ) & (NA ) & (NA ) & (NA ) & (NA ) & (NA ) & (NA ) \tabularnewline
Estimates ( 13 ) & NA & NA & NA & NA & NA & NA & NA \tabularnewline
(p-val) & (NA ) & (NA ) & (NA ) & (NA ) & (NA ) & (NA ) & (NA ) \tabularnewline
\hline
\end{tabular}
%Source: https://freestatistics.org/blog/index.php?pk=64989&T=1

[TABLE]
[ROW][C]ARIMA Parameter Estimation and Backward Selection[/C][/ROW]
[ROW][C]Iteration[/C][C]ar1[/C][C]ar2[/C][C]ar3[/C][C]ma1[/C][C]sar1[/C][C]sar2[/C][C]sma1[/C][/ROW]
[ROW][C]Estimates ( 1 )[/C][C]0.3415[/C][C]0.1489[/C][C]0.1189[/C][C]-0.2496[/C][C]0.3562[/C][C]-0.2021[/C][C]-0.9993[/C][/ROW]
[ROW][C](p-val)[/C][C](0.5931 )[/C][C](0.315 )[/C][C](0.5425 )[/C][C](0.6963 )[/C][C](0.0131 )[/C][C](0.1867 )[/C][C](0.0352 )[/C][/ROW]
[ROW][C]Estimates ( 2 )[/C][C]0.0986[/C][C]0.1814[/C][C]0.1679[/C][C]0[/C][C]0.3594[/C][C]-0.2029[/C][C]-0.9981[/C][/ROW]
[ROW][C](p-val)[/C][C](0.4077 )[/C][C](0.1222 )[/C][C](0.1603 )[/C][C](NA )[/C][C](0.0118 )[/C][C](0.1844 )[/C][C](0.0243 )[/C][/ROW]
[ROW][C]Estimates ( 3 )[/C][C]0[/C][C]0.1939[/C][C]0.1857[/C][C]0[/C][C]0.3797[/C][C]-0.2157[/C][C]-0.9994[/C][/ROW]
[ROW][C](p-val)[/C][C](NA )[/C][C](0.0981 )[/C][C](0.1164 )[/C][C](NA )[/C][C](0.0075 )[/C][C](0.1596 )[/C][C](0.0207 )[/C][/ROW]
[ROW][C]Estimates ( 4 )[/C][C]0[/C][C]0.1999[/C][C]0.2188[/C][C]0[/C][C]0.3988[/C][C]0[/C][C]-1[/C][/ROW]
[ROW][C](p-val)[/C][C](NA )[/C][C](0.0824 )[/C][C](0.0566 )[/C][C](NA )[/C][C](0.0078 )[/C][C](NA )[/C][C](1e-04 )[/C][/ROW]
[ROW][C]Estimates ( 5 )[/C][C]0[/C][C]0[/C][C]0.257[/C][C]0[/C][C]0.4082[/C][C]0[/C][C]-0.9999[/C][/ROW]
[ROW][C](p-val)[/C][C](NA )[/C][C](NA )[/C][C](0.0264 )[/C][C](NA )[/C][C](0.0074 )[/C][C](NA )[/C][C](0 )[/C][/ROW]
[ROW][C]Estimates ( 6 )[/C][C]NA[/C][C]NA[/C][C]NA[/C][C]NA[/C][C]NA[/C][C]NA[/C][C]NA[/C][/ROW]
[ROW][C](p-val)[/C][C](NA )[/C][C](NA )[/C][C](NA )[/C][C](NA )[/C][C](NA )[/C][C](NA )[/C][C](NA )[/C][/ROW]
[ROW][C]Estimates ( 7 )[/C][C]NA[/C][C]NA[/C][C]NA[/C][C]NA[/C][C]NA[/C][C]NA[/C][C]NA[/C][/ROW]
[ROW][C](p-val)[/C][C](NA )[/C][C](NA )[/C][C](NA )[/C][C](NA )[/C][C](NA )[/C][C](NA )[/C][C](NA )[/C][/ROW]
[ROW][C]Estimates ( 8 )[/C][C]NA[/C][C]NA[/C][C]NA[/C][C]NA[/C][C]NA[/C][C]NA[/C][C]NA[/C][/ROW]
[ROW][C](p-val)[/C][C](NA )[/C][C](NA )[/C][C](NA )[/C][C](NA )[/C][C](NA )[/C][C](NA )[/C][C](NA )[/C][/ROW]
[ROW][C]Estimates ( 9 )[/C][C]NA[/C][C]NA[/C][C]NA[/C][C]NA[/C][C]NA[/C][C]NA[/C][C]NA[/C][/ROW]
[ROW][C](p-val)[/C][C](NA )[/C][C](NA )[/C][C](NA )[/C][C](NA )[/C][C](NA )[/C][C](NA )[/C][C](NA )[/C][/ROW]
[ROW][C]Estimates ( 10 )[/C][C]NA[/C][C]NA[/C][C]NA[/C][C]NA[/C][C]NA[/C][C]NA[/C][C]NA[/C][/ROW]
[ROW][C](p-val)[/C][C](NA )[/C][C](NA )[/C][C](NA )[/C][C](NA )[/C][C](NA )[/C][C](NA )[/C][C](NA )[/C][/ROW]
[ROW][C]Estimates ( 11 )[/C][C]NA[/C][C]NA[/C][C]NA[/C][C]NA[/C][C]NA[/C][C]NA[/C][C]NA[/C][/ROW]
[ROW][C](p-val)[/C][C](NA )[/C][C](NA )[/C][C](NA )[/C][C](NA )[/C][C](NA )[/C][C](NA )[/C][C](NA )[/C][/ROW]
[ROW][C]Estimates ( 12 )[/C][C]NA[/C][C]NA[/C][C]NA[/C][C]NA[/C][C]NA[/C][C]NA[/C][C]NA[/C][/ROW]
[ROW][C](p-val)[/C][C](NA )[/C][C](NA )[/C][C](NA )[/C][C](NA )[/C][C](NA )[/C][C](NA )[/C][C](NA )[/C][/ROW]
[ROW][C]Estimates ( 13 )[/C][C]NA[/C][C]NA[/C][C]NA[/C][C]NA[/C][C]NA[/C][C]NA[/C][C]NA[/C][/ROW]
[ROW][C](p-val)[/C][C](NA )[/C][C](NA )[/C][C](NA )[/C][C](NA )[/C][C](NA )[/C][C](NA )[/C][C](NA )[/C][/ROW]
[/TABLE]
Source: https://freestatistics.org/blog/index.php?pk=64989&T=1

Globally Unique Identifier (entire table): ba.freestatistics.org/blog/index.php?pk=64989&T=1

As an alternative you can also use a QR Code:  

The GUIDs for individual cells are displayed in the table below:

ARIMA Parameter Estimation and Backward Selection
Iterationar1ar2ar3ma1sar1sar2sma1
Estimates ( 1 )0.34150.14890.1189-0.24960.3562-0.2021-0.9993
(p-val)(0.5931 )(0.315 )(0.5425 )(0.6963 )(0.0131 )(0.1867 )(0.0352 )
Estimates ( 2 )0.09860.18140.167900.3594-0.2029-0.9981
(p-val)(0.4077 )(0.1222 )(0.1603 )(NA )(0.0118 )(0.1844 )(0.0243 )
Estimates ( 3 )00.19390.185700.3797-0.2157-0.9994
(p-val)(NA )(0.0981 )(0.1164 )(NA )(0.0075 )(0.1596 )(0.0207 )
Estimates ( 4 )00.19990.218800.39880-1
(p-val)(NA )(0.0824 )(0.0566 )(NA )(0.0078 )(NA )(1e-04 )
Estimates ( 5 )000.25700.40820-0.9999
(p-val)(NA )(NA )(0.0264 )(NA )(0.0074 )(NA )(0 )
Estimates ( 6 )NANANANANANANA
(p-val)(NA )(NA )(NA )(NA )(NA )(NA )(NA )
Estimates ( 7 )NANANANANANANA
(p-val)(NA )(NA )(NA )(NA )(NA )(NA )(NA )
Estimates ( 8 )NANANANANANANA
(p-val)(NA )(NA )(NA )(NA )(NA )(NA )(NA )
Estimates ( 9 )NANANANANANANA
(p-val)(NA )(NA )(NA )(NA )(NA )(NA )(NA )
Estimates ( 10 )NANANANANANANA
(p-val)(NA )(NA )(NA )(NA )(NA )(NA )(NA )
Estimates ( 11 )NANANANANANANA
(p-val)(NA )(NA )(NA )(NA )(NA )(NA )(NA )
Estimates ( 12 )NANANANANANANA
(p-val)(NA )(NA )(NA )(NA )(NA )(NA )(NA )
Estimates ( 13 )NANANANANANANA
(p-val)(NA )(NA )(NA )(NA )(NA )(NA )(NA )


Estimated ARIMA Residuals
Value
-1683.85608706230
-6999.35087749223
3931.32652673605
1822.75271017275
1412.85831010682
341.612129794388
-9381.55507514847
649.055948328826
1377.63729026095
-7846.62135114955
5098.26277502930
4768.34811151406
10740.5901250635
-3118.87364267085
-6653.8909673415
-12172.3430680778
1308.85607902947
3886.70335197895
-296.995134388884
1185.3316058715
-3756.67652699999
-2029.93703138424
-6049.80708904876
-155.869195324281
-8288.29444857815
579.977007038197
1553.52404432216
-785.985112768088
-1164.46843095385
-3530.73252748869
3994.02389637401
5628.36174903917
-2536.24819950515
-8281.44574137424
-4045.3675548633
-3055.43106194414
-15078.6790675691
-4042.4923457908
-5639.19325606102
8410.26835938425
-5007.38028583601
-6462.30324482812
1106.39886423720
-6829.95884874971
-11713.0921878395
7497.4340368301
5293.56561524665
-16151.1360566203
6574.13330938066
4743.47649440836
9426.5615899051
-2156.25032128639
-3480.89311636835
-3670.22315983447
3783.98461069648
-8502.36327823036
12159.7792426378
-3389.0226392966
-4940.13188753005
-4001.48918672872
4676.19415638844
12887.1486085950
10532.7380857177
5992.8583735267
5855.2650302122
10655.6662177593
85.964117531585
-3652.4610889491
3167.26625859986
-3333.15438338008
353.444090633532
-6120.35884515823
-2534.37536122279

\begin{tabular}{lllllllll}
\hline
Estimated ARIMA Residuals \tabularnewline
Value \tabularnewline
-1683.85608706230 \tabularnewline
-6999.35087749223 \tabularnewline
3931.32652673605 \tabularnewline
1822.75271017275 \tabularnewline
1412.85831010682 \tabularnewline
341.612129794388 \tabularnewline
-9381.55507514847 \tabularnewline
649.055948328826 \tabularnewline
1377.63729026095 \tabularnewline
-7846.62135114955 \tabularnewline
5098.26277502930 \tabularnewline
4768.34811151406 \tabularnewline
10740.5901250635 \tabularnewline
-3118.87364267085 \tabularnewline
-6653.8909673415 \tabularnewline
-12172.3430680778 \tabularnewline
1308.85607902947 \tabularnewline
3886.70335197895 \tabularnewline
-296.995134388884 \tabularnewline
1185.3316058715 \tabularnewline
-3756.67652699999 \tabularnewline
-2029.93703138424 \tabularnewline
-6049.80708904876 \tabularnewline
-155.869195324281 \tabularnewline
-8288.29444857815 \tabularnewline
579.977007038197 \tabularnewline
1553.52404432216 \tabularnewline
-785.985112768088 \tabularnewline
-1164.46843095385 \tabularnewline
-3530.73252748869 \tabularnewline
3994.02389637401 \tabularnewline
5628.36174903917 \tabularnewline
-2536.24819950515 \tabularnewline
-8281.44574137424 \tabularnewline
-4045.3675548633 \tabularnewline
-3055.43106194414 \tabularnewline
-15078.6790675691 \tabularnewline
-4042.4923457908 \tabularnewline
-5639.19325606102 \tabularnewline
8410.26835938425 \tabularnewline
-5007.38028583601 \tabularnewline
-6462.30324482812 \tabularnewline
1106.39886423720 \tabularnewline
-6829.95884874971 \tabularnewline
-11713.0921878395 \tabularnewline
7497.4340368301 \tabularnewline
5293.56561524665 \tabularnewline
-16151.1360566203 \tabularnewline
6574.13330938066 \tabularnewline
4743.47649440836 \tabularnewline
9426.5615899051 \tabularnewline
-2156.25032128639 \tabularnewline
-3480.89311636835 \tabularnewline
-3670.22315983447 \tabularnewline
3783.98461069648 \tabularnewline
-8502.36327823036 \tabularnewline
12159.7792426378 \tabularnewline
-3389.0226392966 \tabularnewline
-4940.13188753005 \tabularnewline
-4001.48918672872 \tabularnewline
4676.19415638844 \tabularnewline
12887.1486085950 \tabularnewline
10532.7380857177 \tabularnewline
5992.8583735267 \tabularnewline
5855.2650302122 \tabularnewline
10655.6662177593 \tabularnewline
85.964117531585 \tabularnewline
-3652.4610889491 \tabularnewline
3167.26625859986 \tabularnewline
-3333.15438338008 \tabularnewline
353.444090633532 \tabularnewline
-6120.35884515823 \tabularnewline
-2534.37536122279 \tabularnewline
\hline
\end{tabular}
%Source: https://freestatistics.org/blog/index.php?pk=64989&T=2

[TABLE]
[ROW][C]Estimated ARIMA Residuals[/C][/ROW]
[ROW][C]Value[/C][/ROW]
[ROW][C]-1683.85608706230[/C][/ROW]
[ROW][C]-6999.35087749223[/C][/ROW]
[ROW][C]3931.32652673605[/C][/ROW]
[ROW][C]1822.75271017275[/C][/ROW]
[ROW][C]1412.85831010682[/C][/ROW]
[ROW][C]341.612129794388[/C][/ROW]
[ROW][C]-9381.55507514847[/C][/ROW]
[ROW][C]649.055948328826[/C][/ROW]
[ROW][C]1377.63729026095[/C][/ROW]
[ROW][C]-7846.62135114955[/C][/ROW]
[ROW][C]5098.26277502930[/C][/ROW]
[ROW][C]4768.34811151406[/C][/ROW]
[ROW][C]10740.5901250635[/C][/ROW]
[ROW][C]-3118.87364267085[/C][/ROW]
[ROW][C]-6653.8909673415[/C][/ROW]
[ROW][C]-12172.3430680778[/C][/ROW]
[ROW][C]1308.85607902947[/C][/ROW]
[ROW][C]3886.70335197895[/C][/ROW]
[ROW][C]-296.995134388884[/C][/ROW]
[ROW][C]1185.3316058715[/C][/ROW]
[ROW][C]-3756.67652699999[/C][/ROW]
[ROW][C]-2029.93703138424[/C][/ROW]
[ROW][C]-6049.80708904876[/C][/ROW]
[ROW][C]-155.869195324281[/C][/ROW]
[ROW][C]-8288.29444857815[/C][/ROW]
[ROW][C]579.977007038197[/C][/ROW]
[ROW][C]1553.52404432216[/C][/ROW]
[ROW][C]-785.985112768088[/C][/ROW]
[ROW][C]-1164.46843095385[/C][/ROW]
[ROW][C]-3530.73252748869[/C][/ROW]
[ROW][C]3994.02389637401[/C][/ROW]
[ROW][C]5628.36174903917[/C][/ROW]
[ROW][C]-2536.24819950515[/C][/ROW]
[ROW][C]-8281.44574137424[/C][/ROW]
[ROW][C]-4045.3675548633[/C][/ROW]
[ROW][C]-3055.43106194414[/C][/ROW]
[ROW][C]-15078.6790675691[/C][/ROW]
[ROW][C]-4042.4923457908[/C][/ROW]
[ROW][C]-5639.19325606102[/C][/ROW]
[ROW][C]8410.26835938425[/C][/ROW]
[ROW][C]-5007.38028583601[/C][/ROW]
[ROW][C]-6462.30324482812[/C][/ROW]
[ROW][C]1106.39886423720[/C][/ROW]
[ROW][C]-6829.95884874971[/C][/ROW]
[ROW][C]-11713.0921878395[/C][/ROW]
[ROW][C]7497.4340368301[/C][/ROW]
[ROW][C]5293.56561524665[/C][/ROW]
[ROW][C]-16151.1360566203[/C][/ROW]
[ROW][C]6574.13330938066[/C][/ROW]
[ROW][C]4743.47649440836[/C][/ROW]
[ROW][C]9426.5615899051[/C][/ROW]
[ROW][C]-2156.25032128639[/C][/ROW]
[ROW][C]-3480.89311636835[/C][/ROW]
[ROW][C]-3670.22315983447[/C][/ROW]
[ROW][C]3783.98461069648[/C][/ROW]
[ROW][C]-8502.36327823036[/C][/ROW]
[ROW][C]12159.7792426378[/C][/ROW]
[ROW][C]-3389.0226392966[/C][/ROW]
[ROW][C]-4940.13188753005[/C][/ROW]
[ROW][C]-4001.48918672872[/C][/ROW]
[ROW][C]4676.19415638844[/C][/ROW]
[ROW][C]12887.1486085950[/C][/ROW]
[ROW][C]10532.7380857177[/C][/ROW]
[ROW][C]5992.8583735267[/C][/ROW]
[ROW][C]5855.2650302122[/C][/ROW]
[ROW][C]10655.6662177593[/C][/ROW]
[ROW][C]85.964117531585[/C][/ROW]
[ROW][C]-3652.4610889491[/C][/ROW]
[ROW][C]3167.26625859986[/C][/ROW]
[ROW][C]-3333.15438338008[/C][/ROW]
[ROW][C]353.444090633532[/C][/ROW]
[ROW][C]-6120.35884515823[/C][/ROW]
[ROW][C]-2534.37536122279[/C][/ROW]
[/TABLE]
Source: https://freestatistics.org/blog/index.php?pk=64989&T=2

Globally Unique Identifier (entire table): ba.freestatistics.org/blog/index.php?pk=64989&T=2

As an alternative you can also use a QR Code:  

The GUIDs for individual cells are displayed in the table below:

Estimated ARIMA Residuals
Value
-1683.85608706230
-6999.35087749223
3931.32652673605
1822.75271017275
1412.85831010682
341.612129794388
-9381.55507514847
649.055948328826
1377.63729026095
-7846.62135114955
5098.26277502930
4768.34811151406
10740.5901250635
-3118.87364267085
-6653.8909673415
-12172.3430680778
1308.85607902947
3886.70335197895
-296.995134388884
1185.3316058715
-3756.67652699999
-2029.93703138424
-6049.80708904876
-155.869195324281
-8288.29444857815
579.977007038197
1553.52404432216
-785.985112768088
-1164.46843095385
-3530.73252748869
3994.02389637401
5628.36174903917
-2536.24819950515
-8281.44574137424
-4045.3675548633
-3055.43106194414
-15078.6790675691
-4042.4923457908
-5639.19325606102
8410.26835938425
-5007.38028583601
-6462.30324482812
1106.39886423720
-6829.95884874971
-11713.0921878395
7497.4340368301
5293.56561524665
-16151.1360566203
6574.13330938066
4743.47649440836
9426.5615899051
-2156.25032128639
-3480.89311636835
-3670.22315983447
3783.98461069648
-8502.36327823036
12159.7792426378
-3389.0226392966
-4940.13188753005
-4001.48918672872
4676.19415638844
12887.1486085950
10532.7380857177
5992.8583735267
5855.2650302122
10655.6662177593
85.964117531585
-3652.4610889491
3167.26625859986
-3333.15438338008
353.444090633532
-6120.35884515823
-2534.37536122279


Parameters (Session):
par1 = FALSE ; par2 = 1 ; par3 = 1 ; par4 = 1 ; par5 = 12 ; par6 = 3 ; par7 = 1 ; par8 = 2 ; par9 = 1 ;
Parameters (R input):
par1 = FALSE ; par2 = 1 ; par3 = 1 ; par4 = 1 ; par5 = 12 ; par6 = 3 ; par7 = 1 ; par8 = 2 ; par9 = 1 ;
R code (references can be found in the software module):
library(lattice)
if (par1 == 'TRUE') par1 <- TRUE
if (par1 == 'FALSE') par1 <- FALSE
par2 <- as.numeric(par2) #Box-Cox lambda transformation parameter
par3 <- as.numeric(par3) #degree of non-seasonal differencing
par4 <- as.numeric(par4) #degree of seasonal differencing
par5 <- as.numeric(par5) #seasonal period
par6 <- as.numeric(par6) #degree (p) of the non-seasonal AR(p) polynomial
par7 <- as.numeric(par7) #degree (q) of the non-seasonal MA(q) polynomial
par8 <- as.numeric(par8) #degree (P) of the seasonal AR(P) polynomial
par9 <- as.numeric(par9) #degree (Q) of the seasonal MA(Q) polynomial
armaGR <- function(arima.out, names, n){
try1 <- arima.out$coef
try2 <- sqrt(diag(arima.out$var.coef))
try.data.frame <- data.frame(matrix(NA,ncol=4,nrow=length(names)))
dimnames(try.data.frame) <- list(names,c('coef','std','tstat','pv'))
try.data.frame[,1] <- try1
for(i in 1:length(try2)) try.data.frame[which(rownames(try.data.frame)==names(try2)[i]),2] <- try2[i]
try.data.frame[,3] <- try.data.frame[,1] / try.data.frame[,2]
try.data.frame[,4] <- round((1-pt(abs(try.data.frame[,3]),df=n-(length(try2)+1)))*2,5)
vector <- rep(NA,length(names))
vector[is.na(try.data.frame[,4])] <- 0
maxi <- which.max(try.data.frame[,4])
continue <- max(try.data.frame[,4],na.rm=TRUE) > .05
vector[maxi] <- 0
list(summary=try.data.frame,next.vector=vector,continue=continue)
}
arimaSelect <- function(series, order=c(13,0,0), seasonal=list(order=c(2,0,0),period=12), include.mean=F){
nrc <- order[1]+order[3]+seasonal$order[1]+seasonal$order[3]
coeff <- matrix(NA, nrow=nrc*2, ncol=nrc)
pval <- matrix(NA, nrow=nrc*2, ncol=nrc)
mylist <- rep(list(NULL), nrc)
names <- NULL
if(order[1] > 0) names <- paste('ar',1:order[1],sep='')
if(order[3] > 0) names <- c( names , paste('ma',1:order[3],sep='') )
if(seasonal$order[1] > 0) names <- c(names, paste('sar',1:seasonal$order[1],sep=''))
if(seasonal$order[3] > 0) names <- c(names, paste('sma',1:seasonal$order[3],sep=''))
arima.out <- arima(series, order=order, seasonal=seasonal, include.mean=include.mean, method='ML')
mylist[[1]] <- arima.out
last.arma <- armaGR(arima.out, names, length(series))
mystop <- FALSE
i <- 1
coeff[i,] <- last.arma[[1]][,1]
pval [i,] <- last.arma[[1]][,4]
i <- 2
aic <- arima.out$aic
while(!mystop){
mylist[[i]] <- arima.out
arima.out <- arima(series, order=order, seasonal=seasonal, include.mean=include.mean, method='ML', fixed=last.arma$next.vector)
aic <- c(aic, arima.out$aic)
last.arma <- armaGR(arima.out, names, length(series))
mystop <- !last.arma$continue
coeff[i,] <- last.arma[[1]][,1]
pval [i,] <- last.arma[[1]][,4]
i <- i+1
}
list(coeff, pval, mylist, aic=aic)
}
arimaSelectplot <- function(arimaSelect.out,noms,choix){
noms <- names(arimaSelect.out[[3]][[1]]$coef)
coeff <- arimaSelect.out[[1]]
k <- min(which(is.na(coeff[,1])))-1
coeff <- coeff[1:k,]
pval <- arimaSelect.out[[2]][1:k,]
aic <- arimaSelect.out$aic[1:k]
coeff[coeff==0] <- NA
n <- ncol(coeff)
if(missing(choix)) choix <- k
layout(matrix(c(1,1,1,2,
3,3,3,2,
3,3,3,4,
5,6,7,7),nr=4),
widths=c(10,35,45,15),
heights=c(30,30,15,15))
couleurs <- rainbow(75)[1:50]#(50)
ticks <- pretty(coeff)
par(mar=c(1,1,3,1))
plot(aic,k:1-.5,type='o',pch=21,bg='blue',cex=2,axes=F,lty=2,xpd=NA)
points(aic[choix],k-choix+.5,pch=21,cex=4,bg=2,xpd=NA)
title('aic',line=2)
par(mar=c(3,0,0,0))
plot(0,axes=F,xlab='',ylab='',xlim=range(ticks),ylim=c(.1,1))
rect(xleft = min(ticks) + (0:49)/50*(max(ticks)-min(ticks)),
xright = min(ticks) + (1:50)/50*(max(ticks)-min(ticks)),
ytop = rep(1,50),
ybottom= rep(0,50),col=couleurs,border=NA)
axis(1,ticks)
rect(xleft=min(ticks),xright=max(ticks),ytop=1,ybottom=0)
text(mean(coeff,na.rm=T),.5,'coefficients',cex=2,font=2)
par(mar=c(1,1,3,1))
image(1:n,1:k,t(coeff[k:1,]),axes=F,col=couleurs,zlim=range(ticks))
for(i in 1:n) for(j in 1:k) if(!is.na(coeff[j,i])) {
if(pval[j,i]<.01) symb = 'green'
else if( (pval[j,i]<.05) & (pval[j,i]>=.01)) symb = 'orange'
else if( (pval[j,i]<.1) & (pval[j,i]>=.05)) symb = 'red'
else symb = 'black'
polygon(c(i+.5 ,i+.2 ,i+.5 ,i+.5),
c(k-j+0.5,k-j+0.5,k-j+0.8,k-j+0.5),
col=symb)
if(j==choix) {
rect(xleft=i-.5,
xright=i+.5,
ybottom=k-j+1.5,
ytop=k-j+.5,
lwd=4)
text(i,
k-j+1,
round(coeff[j,i],2),
cex=1.2,
font=2)
}
else{
rect(xleft=i-.5,xright=i+.5,ybottom=k-j+1.5,ytop=k-j+.5)
text(i,k-j+1,round(coeff[j,i],2),cex=1.2,font=1)
}
}
axis(3,1:n,noms)
par(mar=c(0.5,0,0,0.5))
plot(0,axes=F,xlab='',ylab='',type='n',xlim=c(0,8),ylim=c(-.2,.8))
cols <- c('green','orange','red','black')
niv <- c('0','0.01','0.05','0.1')
for(i in 0:3){
polygon(c(1+2*i ,1+2*i ,1+2*i-.5 ,1+2*i),
c(.4 ,.7 , .4 , .4),
col=cols[i+1])
text(2*i,0.5,niv[i+1],cex=1.5)
}
text(8,.5,1,cex=1.5)
text(4,0,'p-value',cex=2)
box()
residus <- arimaSelect.out[[3]][[choix]]$res
par(mar=c(1,2,4,1))
acf(residus,main='')
title('acf',line=.5)
par(mar=c(1,2,4,1))
pacf(residus,main='')
title('pacf',line=.5)
par(mar=c(2,2,4,1))
qqnorm(residus,main='')
title('qq-norm',line=.5)
qqline(residus)
residus
}
if (par2 == 0) x <- log(x)
if (par2 != 0) x <- x^par2
(selection <- arimaSelect(x, order=c(par6,par3,par7), seasonal=list(order=c(par8,par4,par9), period=par5)))
bitmap(file='test1.png')
resid <- arimaSelectplot(selection)
dev.off()
resid
bitmap(file='test2.png')
acf(resid,length(resid)/2, main='Residual Autocorrelation Function')
dev.off()
bitmap(file='test3.png')
pacf(resid,length(resid)/2, main='Residual Partial Autocorrelation Function')
dev.off()
bitmap(file='test4.png')
cpgram(resid, main='Residual Cumulative Periodogram')
dev.off()
bitmap(file='test5.png')
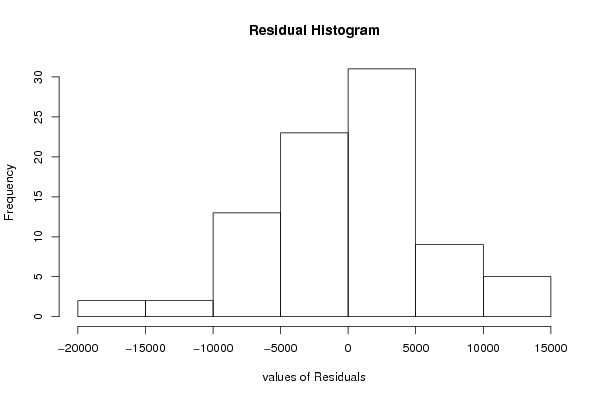
hist(resid, main='Residual Histogram', xlab='values of Residuals')
dev.off()
bitmap(file='test6.png')
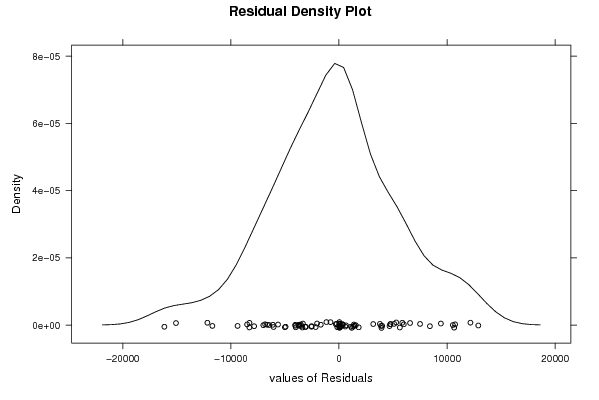
densityplot(~resid,col='black',main='Residual Density Plot', xlab='values of Residuals')
dev.off()
bitmap(file='test7.png')
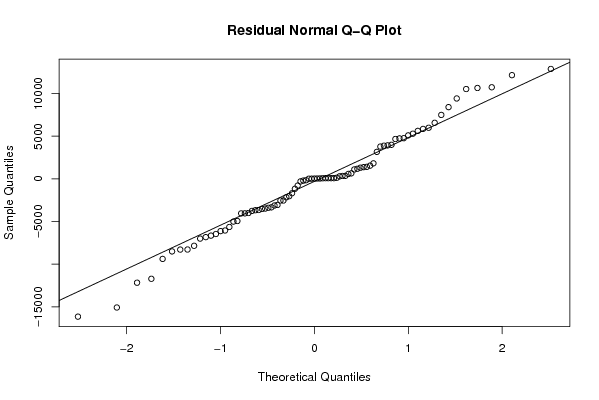
qqnorm(resid, main='Residual Normal Q-Q Plot')
qqline(resid)
dev.off()
ncols <- length(selection[[1]][1,])
nrows <- length(selection[[2]][,1])-1
load(file='createtable')
a<-table.start()
a<-table.row.start(a)
a<-table.element(a,'ARIMA Parameter Estimation and Backward Selection', ncols+1,TRUE)
a<-table.row.end(a)
a<-table.row.start(a)
a<-table.element(a,'Iteration', header=TRUE)
for (i in 1:ncols) {
a<-table.element(a,names(selection[[3]][[1]]$coef)[i],header=TRUE)
}
a<-table.row.end(a)
for (j in 1:nrows) {
a<-table.row.start(a)
mydum <- 'Estimates ('
mydum <- paste(mydum,j)
mydum <- paste(mydum,')')
a<-table.element(a,mydum, header=TRUE)
for (i in 1:ncols) {
a<-table.element(a,round(selection[[1]][j,i],4))
}
a<-table.row.end(a)
a<-table.row.start(a)
a<-table.element(a,'(p-val)', header=TRUE)
for (i in 1:ncols) {
mydum <- '('
mydum <- paste(mydum,round(selection[[2]][j,i],4),sep='')
mydum <- paste(mydum,')')
a<-table.element(a,mydum)
}
a<-table.row.end(a)
}
a<-table.end(a)
table.save(a,file='mytable.tab')
a<-table.start()
a<-table.row.start(a)
a<-table.element(a,'Estimated ARIMA Residuals', 1,TRUE)
a<-table.row.end(a)
a<-table.row.start(a)
a<-table.element(a,'Value', 1,TRUE)
a<-table.row.end(a)
for (i in (par4*par5+par3):length(resid)) {
a<-table.row.start(a)
a<-table.element(a,resid[i])
a<-table.row.end(a)
}
a<-table.end(a)
table.save(a,file='mytable1.tab')