Free Statistics

of Irreproducible Research!

Author's title

Author*The author of this computation has been verified*
R Software Modulerwasp_arimabackwardselection.wasp
Title produced by softwareARIMA Backward Selection
Date of computationWed, 09 Dec 2009 09:33:10 -0700
Cite this page as followsStatistical Computations at FreeStatistics.org, Office for Research Development and Education, URL https://freestatistics.org/blog/index.php?v=date/2009/Dec/09/t1260376895x3g7jfn1w7g45fe.htm/, Retrieved Mon, 29 Apr 2024 09:06:31 +0000
Statistical Computations at FreeStatistics.org, Office for Research Development and Education, URL https://freestatistics.org/blog/index.php?pk=65038, Retrieved Mon, 29 Apr 2024 09:06:31 +0000
QR Codes:

Original text written by user:
IsPrivate?No (this computation is public)
User-defined keywords
Estimated Impact129
Family? (F = Feedback message, R = changed R code, M = changed R Module, P = changed Parameters, D = changed Data)
-     [ARIMA Backward Selection] [] [2009-12-07 09:20:41] [b98453cac15ba1066b407e146608df68]
- R PD    [ARIMA Backward Selection] [Workshop 10: arim...] [2009-12-09 16:33:10] [3d2053c5f7c50d3c075d87ce0bd87294] [Current]
Feedback Forum

Post a new message
Dataseries X:
267413
267366
264777
258863
254844
254868
277267
285351
286602
283042
276687
277915
277128
277103
275037
270150
267140
264993
287259
291186
292300
288186
281477
282656
280190
280408
276836
275216
274352
271311
289802
290726
292300
278506
269826
265861
269034
264176
255198
253353
246057
235372
258556
260993
254663
250643
243422
247105
248541
245039
237080
237085
225554
226839
247934
248333
246969
245098
246263
255765
264319
268347
273046
273963
267430
271993
292710
295881
293299


Summary of computational transaction
Raw Inputview raw input (R code)
Raw Outputview raw output of R engine
Computing time2 seconds
R Server'Gwilym Jenkins' @ 72.249.127.135

\begin{tabular}{lllllllll}
\hline
Summary of computational transaction \tabularnewline
Raw Input & view raw input (R code)  \tabularnewline
Raw Output & view raw output of R engine  \tabularnewline
Computing time & 2 seconds \tabularnewline
R Server & 'Gwilym Jenkins' @ 72.249.127.135 \tabularnewline
\hline
\end{tabular}
%Source: https://freestatistics.org/blog/index.php?pk=65038&T=0

[TABLE]
[ROW][C]Summary of computational transaction[/C][/ROW]
[ROW][C]Raw Input[/C][C]view raw input (R code) [/C][/ROW]
[ROW][C]Raw Output[/C][C]view raw output of R engine [/C][/ROW]
[ROW][C]Computing time[/C][C]2 seconds[/C][/ROW]
[ROW][C]R Server[/C][C]'Gwilym Jenkins' @ 72.249.127.135[/C][/ROW]
[/TABLE]
Source: https://freestatistics.org/blog/index.php?pk=65038&T=0

Globally Unique Identifier (entire table): ba.freestatistics.org/blog/index.php?pk=65038&T=0

As an alternative you can also use a QR Code:  

The GUIDs for individual cells are displayed in the table below:

Summary of computational transaction
Raw Inputview raw input (R code)
Raw Outputview raw output of R engine
Computing time2 seconds
R Server'Gwilym Jenkins' @ 72.249.127.135


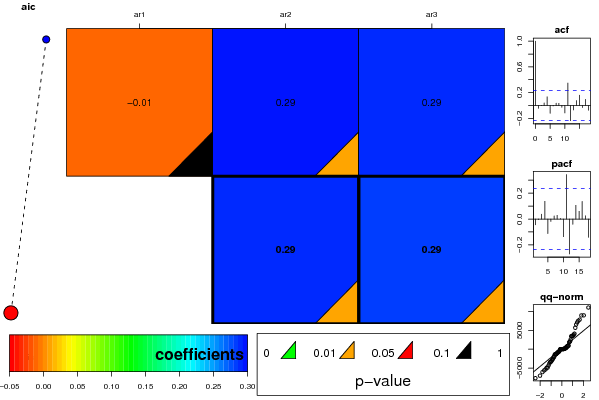
ARIMA Parameter Estimation and Backward Selection
Iterationar1ar2ar3
Estimates ( 1 )-0.01440.29340.2907
(p-val)(0.909 )(0.0159 )(0.0222 )
Estimates ( 2 )00.29180.2859
(p-val)(NA )(0.0158 )(0.0171 )
Estimates ( 3 )NANANA
(p-val)(NA )(NA )(NA )
Estimates ( 4 )NANANA
(p-val)(NA )(NA )(NA )
Estimates ( 5 )NANANA
(p-val)(NA )(NA )(NA )

\begin{tabular}{lllllllll}
\hline
ARIMA Parameter Estimation and Backward Selection \tabularnewline
Iteration & ar1 & ar2 & ar3 \tabularnewline
Estimates ( 1 ) & -0.0144 & 0.2934 & 0.2907 \tabularnewline
(p-val) & (0.909 ) & (0.0159 ) & (0.0222 ) \tabularnewline
Estimates ( 2 ) & 0 & 0.2918 & 0.2859 \tabularnewline
(p-val) & (NA ) & (0.0158 ) & (0.0171 ) \tabularnewline
Estimates ( 3 ) & NA & NA & NA \tabularnewline
(p-val) & (NA ) & (NA ) & (NA ) \tabularnewline
Estimates ( 4 ) & NA & NA & NA \tabularnewline
(p-val) & (NA ) & (NA ) & (NA ) \tabularnewline
Estimates ( 5 ) & NA & NA & NA \tabularnewline
(p-val) & (NA ) & (NA ) & (NA ) \tabularnewline
\hline
\end{tabular}
%Source: https://freestatistics.org/blog/index.php?pk=65038&T=1

[TABLE]
[ROW][C]ARIMA Parameter Estimation and Backward Selection[/C][/ROW]
[ROW][C]Iteration[/C][C]ar1[/C][C]ar2[/C][C]ar3[/C][/ROW]
[ROW][C]Estimates ( 1 )[/C][C]-0.0144[/C][C]0.2934[/C][C]0.2907[/C][/ROW]
[ROW][C](p-val)[/C][C](0.909 )[/C][C](0.0159 )[/C][C](0.0222 )[/C][/ROW]
[ROW][C]Estimates ( 2 )[/C][C]0[/C][C]0.2918[/C][C]0.2859[/C][/ROW]
[ROW][C](p-val)[/C][C](NA )[/C][C](0.0158 )[/C][C](0.0171 )[/C][/ROW]
[ROW][C]Estimates ( 3 )[/C][C]NA[/C][C]NA[/C][C]NA[/C][/ROW]
[ROW][C](p-val)[/C][C](NA )[/C][C](NA )[/C][C](NA )[/C][/ROW]
[ROW][C]Estimates ( 4 )[/C][C]NA[/C][C]NA[/C][C]NA[/C][/ROW]
[ROW][C](p-val)[/C][C](NA )[/C][C](NA )[/C][C](NA )[/C][/ROW]
[ROW][C]Estimates ( 5 )[/C][C]NA[/C][C]NA[/C][C]NA[/C][/ROW]
[ROW][C](p-val)[/C][C](NA )[/C][C](NA )[/C][C](NA )[/C][/ROW]
[/TABLE]
Source: https://freestatistics.org/blog/index.php?pk=65038&T=1

Globally Unique Identifier (entire table): ba.freestatistics.org/blog/index.php?pk=65038&T=1

As an alternative you can also use a QR Code:  

The GUIDs for individual cells are displayed in the table below:

ARIMA Parameter Estimation and Backward Selection
Iterationar1ar2ar3
Estimates ( 1 )-0.01440.29340.2907
(p-val)(0.909 )(0.0159 )(0.0222 )
Estimates ( 2 )00.29180.2859
(p-val)(NA )(0.0158 )(0.0171 )
Estimates ( 3 )NANANA
(p-val)(NA )(NA )(NA )
Estimates ( 4 )NANANA
(p-val)(NA )(NA )(NA )
Estimates ( 5 )NANANA
(p-val)(NA )(NA )(NA )


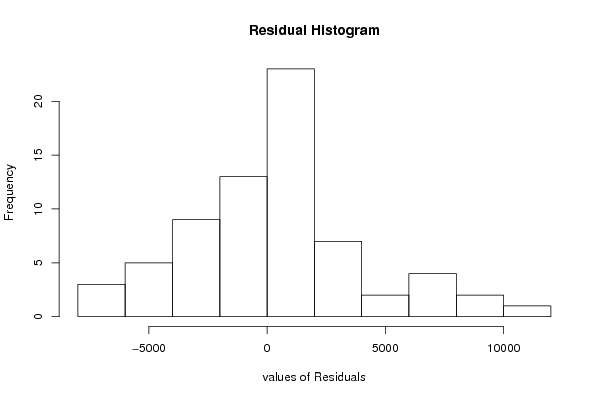
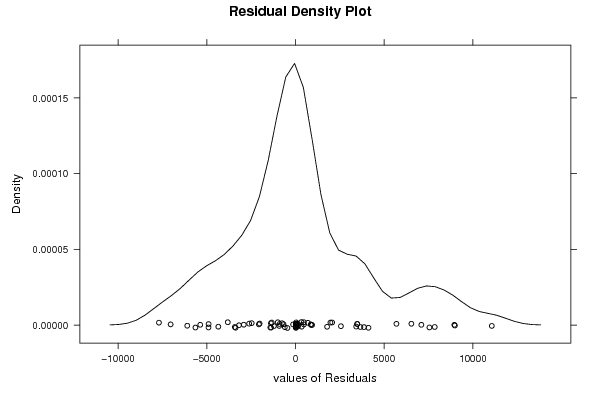
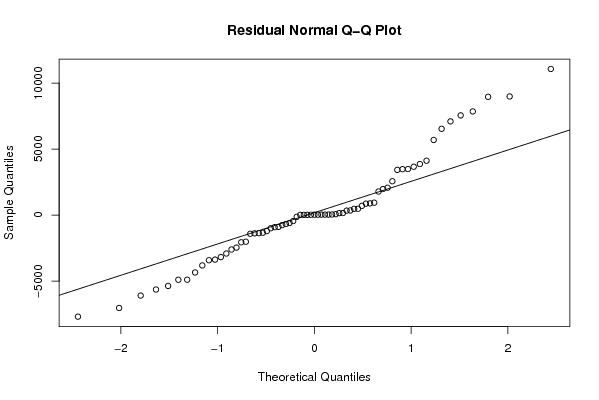
Estimated ARIMA Residuals
Value
-913.746172584862
24.0928811357686
476.40191413765
939.132223528336
863.944974771187
-2609.82092926532
-758.812922344295
-3815.31348580556
473.330593969639
702.265571108666
886.6915361082
148.264734535818
-1414.79737477571
336.127131504766
-995.677036757255
3662.13711872217
2564.19371305485
-1383.78277681675
-5367.1936311716
-3418.89544087497
1784.18511279358
-7694.94677503693
-1372.24342785065
-2466.18561653996
8957.27870714543
-2912.74066056346
-5637.99838569807
-452.896823327814
-3373.60535595147
-6098.97508574376
6535.42921565637
5692.93793580151
-7036.88682488539
7852.10076025135
3478.65639356541
7099.26593755901
-4896.36608623027
-1336.89094596042
-675.220249362464
1971.79999437058
-4901.53209260447
11070.0833015178
-1212.11843999874
-4348.64875540789
2069.77648546605
3425.6467622589
7552.46726297801
3865.54250239767
4116.72965431529
3487.38102685416
8986.45661517814
-3184.25821985433
-891.483182174591
-597.418311240733
-2062.26234599733
351.912685872521
-2020.15579911374

\begin{tabular}{lllllllll}
\hline
Estimated ARIMA Residuals \tabularnewline
Value \tabularnewline
-913.746172584862 \tabularnewline
24.0928811357686 \tabularnewline
476.40191413765 \tabularnewline
939.132223528336 \tabularnewline
863.944974771187 \tabularnewline
-2609.82092926532 \tabularnewline
-758.812922344295 \tabularnewline
-3815.31348580556 \tabularnewline
473.330593969639 \tabularnewline
702.265571108666 \tabularnewline
886.6915361082 \tabularnewline
148.264734535818 \tabularnewline
-1414.79737477571 \tabularnewline
336.127131504766 \tabularnewline
-995.677036757255 \tabularnewline
3662.13711872217 \tabularnewline
2564.19371305485 \tabularnewline
-1383.78277681675 \tabularnewline
-5367.1936311716 \tabularnewline
-3418.89544087497 \tabularnewline
1784.18511279358 \tabularnewline
-7694.94677503693 \tabularnewline
-1372.24342785065 \tabularnewline
-2466.18561653996 \tabularnewline
8957.27870714543 \tabularnewline
-2912.74066056346 \tabularnewline
-5637.99838569807 \tabularnewline
-452.896823327814 \tabularnewline
-3373.60535595147 \tabularnewline
-6098.97508574376 \tabularnewline
6535.42921565637 \tabularnewline
5692.93793580151 \tabularnewline
-7036.88682488539 \tabularnewline
7852.10076025135 \tabularnewline
3478.65639356541 \tabularnewline
7099.26593755901 \tabularnewline
-4896.36608623027 \tabularnewline
-1336.89094596042 \tabularnewline
-675.220249362464 \tabularnewline
1971.79999437058 \tabularnewline
-4901.53209260447 \tabularnewline
11070.0833015178 \tabularnewline
-1212.11843999874 \tabularnewline
-4348.64875540789 \tabularnewline
2069.77648546605 \tabularnewline
3425.6467622589 \tabularnewline
7552.46726297801 \tabularnewline
3865.54250239767 \tabularnewline
4116.72965431529 \tabularnewline
3487.38102685416 \tabularnewline
8986.45661517814 \tabularnewline
-3184.25821985433 \tabularnewline
-891.483182174591 \tabularnewline
-597.418311240733 \tabularnewline
-2062.26234599733 \tabularnewline
351.912685872521 \tabularnewline
-2020.15579911374 \tabularnewline
\hline
\end{tabular}
%Source: https://freestatistics.org/blog/index.php?pk=65038&T=2

[TABLE]
[ROW][C]Estimated ARIMA Residuals[/C][/ROW]
[ROW][C]Value[/C][/ROW]
[ROW][C]-913.746172584862[/C][/ROW]
[ROW][C]24.0928811357686[/C][/ROW]
[ROW][C]476.40191413765[/C][/ROW]
[ROW][C]939.132223528336[/C][/ROW]
[ROW][C]863.944974771187[/C][/ROW]
[ROW][C]-2609.82092926532[/C][/ROW]
[ROW][C]-758.812922344295[/C][/ROW]
[ROW][C]-3815.31348580556[/C][/ROW]
[ROW][C]473.330593969639[/C][/ROW]
[ROW][C]702.265571108666[/C][/ROW]
[ROW][C]886.6915361082[/C][/ROW]
[ROW][C]148.264734535818[/C][/ROW]
[ROW][C]-1414.79737477571[/C][/ROW]
[ROW][C]336.127131504766[/C][/ROW]
[ROW][C]-995.677036757255[/C][/ROW]
[ROW][C]3662.13711872217[/C][/ROW]
[ROW][C]2564.19371305485[/C][/ROW]
[ROW][C]-1383.78277681675[/C][/ROW]
[ROW][C]-5367.1936311716[/C][/ROW]
[ROW][C]-3418.89544087497[/C][/ROW]
[ROW][C]1784.18511279358[/C][/ROW]
[ROW][C]-7694.94677503693[/C][/ROW]
[ROW][C]-1372.24342785065[/C][/ROW]
[ROW][C]-2466.18561653996[/C][/ROW]
[ROW][C]8957.27870714543[/C][/ROW]
[ROW][C]-2912.74066056346[/C][/ROW]
[ROW][C]-5637.99838569807[/C][/ROW]
[ROW][C]-452.896823327814[/C][/ROW]
[ROW][C]-3373.60535595147[/C][/ROW]
[ROW][C]-6098.97508574376[/C][/ROW]
[ROW][C]6535.42921565637[/C][/ROW]
[ROW][C]5692.93793580151[/C][/ROW]
[ROW][C]-7036.88682488539[/C][/ROW]
[ROW][C]7852.10076025135[/C][/ROW]
[ROW][C]3478.65639356541[/C][/ROW]
[ROW][C]7099.26593755901[/C][/ROW]
[ROW][C]-4896.36608623027[/C][/ROW]
[ROW][C]-1336.89094596042[/C][/ROW]
[ROW][C]-675.220249362464[/C][/ROW]
[ROW][C]1971.79999437058[/C][/ROW]
[ROW][C]-4901.53209260447[/C][/ROW]
[ROW][C]11070.0833015178[/C][/ROW]
[ROW][C]-1212.11843999874[/C][/ROW]
[ROW][C]-4348.64875540789[/C][/ROW]
[ROW][C]2069.77648546605[/C][/ROW]
[ROW][C]3425.6467622589[/C][/ROW]
[ROW][C]7552.46726297801[/C][/ROW]
[ROW][C]3865.54250239767[/C][/ROW]
[ROW][C]4116.72965431529[/C][/ROW]
[ROW][C]3487.38102685416[/C][/ROW]
[ROW][C]8986.45661517814[/C][/ROW]
[ROW][C]-3184.25821985433[/C][/ROW]
[ROW][C]-891.483182174591[/C][/ROW]
[ROW][C]-597.418311240733[/C][/ROW]
[ROW][C]-2062.26234599733[/C][/ROW]
[ROW][C]351.912685872521[/C][/ROW]
[ROW][C]-2020.15579911374[/C][/ROW]
[/TABLE]
Source: https://freestatistics.org/blog/index.php?pk=65038&T=2

Globally Unique Identifier (entire table): ba.freestatistics.org/blog/index.php?pk=65038&T=2

As an alternative you can also use a QR Code:  

The GUIDs for individual cells are displayed in the table below:

Estimated ARIMA Residuals
Value
-913.746172584862
24.0928811357686
476.40191413765
939.132223528336
863.944974771187
-2609.82092926532
-758.812922344295
-3815.31348580556
473.330593969639
702.265571108666
886.6915361082
148.264734535818
-1414.79737477571
336.127131504766
-995.677036757255
3662.13711872217
2564.19371305485
-1383.78277681675
-5367.1936311716
-3418.89544087497
1784.18511279358
-7694.94677503693
-1372.24342785065
-2466.18561653996
8957.27870714543
-2912.74066056346
-5637.99838569807
-452.896823327814
-3373.60535595147
-6098.97508574376
6535.42921565637
5692.93793580151
-7036.88682488539
7852.10076025135
3478.65639356541
7099.26593755901
-4896.36608623027
-1336.89094596042
-675.220249362464
1971.79999437058
-4901.53209260447
11070.0833015178
-1212.11843999874
-4348.64875540789
2069.77648546605
3425.6467622589
7552.46726297801
3865.54250239767
4116.72965431529
3487.38102685416
8986.45661517814
-3184.25821985433
-891.483182174591
-597.418311240733
-2062.26234599733
351.912685872521
-2020.15579911374


Parameters (Session):
par1 = FALSE ; par2 = 1 ; par3 = 1 ; par4 = 1 ; par5 = 12 ; par6 = 3 ; par7 = 0 ; par8 = 0 ; par9 = 0 ;
Parameters (R input):
par1 = FALSE ; par2 = 1 ; par3 = 1 ; par4 = 1 ; par5 = 12 ; par6 = 3 ; par7 = 0 ; par8 = 0 ; par9 = 0 ;
R code (references can be found in the software module):
library(lattice)
if (par1 == 'TRUE') par1 <- TRUE
if (par1 == 'FALSE') par1 <- FALSE
par2 <- as.numeric(par2) #Box-Cox lambda transformation parameter
par3 <- as.numeric(par3) #degree of non-seasonal differencing
par4 <- as.numeric(par4) #degree of seasonal differencing
par5 <- as.numeric(par5) #seasonal period
par6 <- as.numeric(par6) #degree (p) of the non-seasonal AR(p) polynomial
par7 <- as.numeric(par7) #degree (q) of the non-seasonal MA(q) polynomial
par8 <- as.numeric(par8) #degree (P) of the seasonal AR(P) polynomial
par9 <- as.numeric(par9) #degree (Q) of the seasonal MA(Q) polynomial
armaGR <- function(arima.out, names, n){
try1 <- arima.out$coef
try2 <- sqrt(diag(arima.out$var.coef))
try.data.frame <- data.frame(matrix(NA,ncol=4,nrow=length(names)))
dimnames(try.data.frame) <- list(names,c('coef','std','tstat','pv'))
try.data.frame[,1] <- try1
for(i in 1:length(try2)) try.data.frame[which(rownames(try.data.frame)==names(try2)[i]),2] <- try2[i]
try.data.frame[,3] <- try.data.frame[,1] / try.data.frame[,2]
try.data.frame[,4] <- round((1-pt(abs(try.data.frame[,3]),df=n-(length(try2)+1)))*2,5)
vector <- rep(NA,length(names))
vector[is.na(try.data.frame[,4])] <- 0
maxi <- which.max(try.data.frame[,4])
continue <- max(try.data.frame[,4],na.rm=TRUE) > .05
vector[maxi] <- 0
list(summary=try.data.frame,next.vector=vector,continue=continue)
}
arimaSelect <- function(series, order=c(13,0,0), seasonal=list(order=c(2,0,0),period=12), include.mean=F){
nrc <- order[1]+order[3]+seasonal$order[1]+seasonal$order[3]
coeff <- matrix(NA, nrow=nrc*2, ncol=nrc)
pval <- matrix(NA, nrow=nrc*2, ncol=nrc)
mylist <- rep(list(NULL), nrc)
names <- NULL
if(order[1] > 0) names <- paste('ar',1:order[1],sep='')
if(order[3] > 0) names <- c( names , paste('ma',1:order[3],sep='') )
if(seasonal$order[1] > 0) names <- c(names, paste('sar',1:seasonal$order[1],sep=''))
if(seasonal$order[3] > 0) names <- c(names, paste('sma',1:seasonal$order[3],sep=''))
arima.out <- arima(series, order=order, seasonal=seasonal, include.mean=include.mean, method='ML')
mylist[[1]] <- arima.out
last.arma <- armaGR(arima.out, names, length(series))
mystop <- FALSE
i <- 1
coeff[i,] <- last.arma[[1]][,1]
pval [i,] <- last.arma[[1]][,4]
i <- 2
aic <- arima.out$aic
while(!mystop){
mylist[[i]] <- arima.out
arima.out <- arima(series, order=order, seasonal=seasonal, include.mean=include.mean, method='ML', fixed=last.arma$next.vector)
aic <- c(aic, arima.out$aic)
last.arma <- armaGR(arima.out, names, length(series))
mystop <- !last.arma$continue
coeff[i,] <- last.arma[[1]][,1]
pval [i,] <- last.arma[[1]][,4]
i <- i+1
}
list(coeff, pval, mylist, aic=aic)
}
arimaSelectplot <- function(arimaSelect.out,noms,choix){
noms <- names(arimaSelect.out[[3]][[1]]$coef)
coeff <- arimaSelect.out[[1]]
k <- min(which(is.na(coeff[,1])))-1
coeff <- coeff[1:k,]
pval <- arimaSelect.out[[2]][1:k,]
aic <- arimaSelect.out$aic[1:k]
coeff[coeff==0] <- NA
n <- ncol(coeff)
if(missing(choix)) choix <- k
layout(matrix(c(1,1,1,2,
3,3,3,2,
3,3,3,4,
5,6,7,7),nr=4),
widths=c(10,35,45,15),
heights=c(30,30,15,15))
couleurs <- rainbow(75)[1:50]#(50)
ticks <- pretty(coeff)
par(mar=c(1,1,3,1))
plot(aic,k:1-.5,type='o',pch=21,bg='blue',cex=2,axes=F,lty=2,xpd=NA)
points(aic[choix],k-choix+.5,pch=21,cex=4,bg=2,xpd=NA)
title('aic',line=2)
par(mar=c(3,0,0,0))
plot(0,axes=F,xlab='',ylab='',xlim=range(ticks),ylim=c(.1,1))
rect(xleft = min(ticks) + (0:49)/50*(max(ticks)-min(ticks)),
xright = min(ticks) + (1:50)/50*(max(ticks)-min(ticks)),
ytop = rep(1,50),
ybottom= rep(0,50),col=couleurs,border=NA)
axis(1,ticks)
rect(xleft=min(ticks),xright=max(ticks),ytop=1,ybottom=0)
text(mean(coeff,na.rm=T),.5,'coefficients',cex=2,font=2)
par(mar=c(1,1,3,1))
image(1:n,1:k,t(coeff[k:1,]),axes=F,col=couleurs,zlim=range(ticks))
for(i in 1:n) for(j in 1:k) if(!is.na(coeff[j,i])) {
if(pval[j,i]<.01) symb = 'green'
else if( (pval[j,i]<.05) & (pval[j,i]>=.01)) symb = 'orange'
else if( (pval[j,i]<.1) & (pval[j,i]>=.05)) symb = 'red'
else symb = 'black'
polygon(c(i+.5 ,i+.2 ,i+.5 ,i+.5),
c(k-j+0.5,k-j+0.5,k-j+0.8,k-j+0.5),
col=symb)
if(j==choix) {
rect(xleft=i-.5,
xright=i+.5,
ybottom=k-j+1.5,
ytop=k-j+.5,
lwd=4)
text(i,
k-j+1,
round(coeff[j,i],2),
cex=1.2,
font=2)
}
else{
rect(xleft=i-.5,xright=i+.5,ybottom=k-j+1.5,ytop=k-j+.5)
text(i,k-j+1,round(coeff[j,i],2),cex=1.2,font=1)
}
}
axis(3,1:n,noms)
par(mar=c(0.5,0,0,0.5))
plot(0,axes=F,xlab='',ylab='',type='n',xlim=c(0,8),ylim=c(-.2,.8))
cols <- c('green','orange','red','black')
niv <- c('0','0.01','0.05','0.1')
for(i in 0:3){
polygon(c(1+2*i ,1+2*i ,1+2*i-.5 ,1+2*i),
c(.4 ,.7 , .4 , .4),
col=cols[i+1])
text(2*i,0.5,niv[i+1],cex=1.5)
}
text(8,.5,1,cex=1.5)
text(4,0,'p-value',cex=2)
box()
residus <- arimaSelect.out[[3]][[choix]]$res
par(mar=c(1,2,4,1))
acf(residus,main='')
title('acf',line=.5)
par(mar=c(1,2,4,1))
pacf(residus,main='')
title('pacf',line=.5)
par(mar=c(2,2,4,1))
qqnorm(residus,main='')
title('qq-norm',line=.5)
qqline(residus)
residus
}
if (par2 == 0) x <- log(x)
if (par2 != 0) x <- x^par2
(selection <- arimaSelect(x, order=c(par6,par3,par7), seasonal=list(order=c(par8,par4,par9), period=par5)))
bitmap(file='test1.png')
resid <- arimaSelectplot(selection)
dev.off()
resid
bitmap(file='test2.png')
acf(resid,length(resid)/2, main='Residual Autocorrelation Function')
dev.off()
bitmap(file='test3.png')
pacf(resid,length(resid)/2, main='Residual Partial Autocorrelation Function')
dev.off()
bitmap(file='test4.png')
cpgram(resid, main='Residual Cumulative Periodogram')
dev.off()
bitmap(file='test5.png')
hist(resid, main='Residual Histogram', xlab='values of Residuals')
dev.off()
bitmap(file='test6.png')
densityplot(~resid,col='black',main='Residual Density Plot', xlab='values of Residuals')
dev.off()
bitmap(file='test7.png')
qqnorm(resid, main='Residual Normal Q-Q Plot')
qqline(resid)
dev.off()
ncols <- length(selection[[1]][1,])
nrows <- length(selection[[2]][,1])-1
load(file='createtable')
a<-table.start()
a<-table.row.start(a)
a<-table.element(a,'ARIMA Parameter Estimation and Backward Selection', ncols+1,TRUE)
a<-table.row.end(a)
a<-table.row.start(a)
a<-table.element(a,'Iteration', header=TRUE)
for (i in 1:ncols) {
a<-table.element(a,names(selection[[3]][[1]]$coef)[i],header=TRUE)
}
a<-table.row.end(a)
for (j in 1:nrows) {
a<-table.row.start(a)
mydum <- 'Estimates ('
mydum <- paste(mydum,j)
mydum <- paste(mydum,')')
a<-table.element(a,mydum, header=TRUE)
for (i in 1:ncols) {
a<-table.element(a,round(selection[[1]][j,i],4))
}
a<-table.row.end(a)
a<-table.row.start(a)
a<-table.element(a,'(p-val)', header=TRUE)
for (i in 1:ncols) {
mydum <- '('
mydum <- paste(mydum,round(selection[[2]][j,i],4),sep='')
mydum <- paste(mydum,')')
a<-table.element(a,mydum)
}
a<-table.row.end(a)
}
a<-table.end(a)
table.save(a,file='mytable.tab')
a<-table.start()
a<-table.row.start(a)
a<-table.element(a,'Estimated ARIMA Residuals', 1,TRUE)
a<-table.row.end(a)
a<-table.row.start(a)
a<-table.element(a,'Value', 1,TRUE)
a<-table.row.end(a)
for (i in (par4*par5+par3):length(resid)) {
a<-table.row.start(a)
a<-table.element(a,resid[i])
a<-table.row.end(a)
}
a<-table.end(a)
table.save(a,file='mytable1.tab')