Free Statistics

of Irreproducible Research!

Author's title

Author*The author of this computation has been verified*
R Software Modulerwasp_arimabackwardselection.wasp
Title produced by softwareARIMA Backward Selection
Date of computationWed, 09 Dec 2009 09:48:56 -0700
Cite this page as followsStatistical Computations at FreeStatistics.org, Office for Research Development and Education, URL https://freestatistics.org/blog/index.php?v=date/2009/Dec/09/t12603774730sqo5547etjcy5d.htm/, Retrieved Mon, 29 Apr 2024 09:50:25 +0000
Statistical Computations at FreeStatistics.org, Office for Research Development and Education, URL https://freestatistics.org/blog/index.php?pk=65044, Retrieved Mon, 29 Apr 2024 09:50:25 +0000
QR Codes:

Original text written by user:
IsPrivate?No (this computation is public)
User-defined keywordsWs 9 Controle
Estimated Impact106
Family? (F = Feedback message, R = changed R code, M = changed R Module, P = changed Parameters, D = changed Data)
-     [Univariate Data Series] [data set] [2008-12-01 19:54:57] [b98453cac15ba1066b407e146608df68]
- RMP   [ARIMA Backward Selection] [] [2009-11-27 14:53:14] [b98453cac15ba1066b407e146608df68]
-   PD    [ARIMA Backward Selection] [workshop 9 - 5] [2009-12-04 09:56:44] [f1a50df816abcbb519e7637ff6b72fa0]
-    D      [ARIMA Backward Selection] [WS9] [2009-12-06 14:52:58] [9f35ad889e41dd0c9322ca60d75b9f47]
-   PD          [ARIMA Backward Selection] [WS 9 Controle] [2009-12-09 16:48:56] [a53416c107f5e7e1e12bb9940270d09d] [Current]
Feedback Forum

Post a new message
Dataseries X:
10414.9
12476.8
12384.6
12266.7
12919.9
11497.3
12142
13919.4
12656.8
12034.1
13199.7
10881.3
11301.2
13643.9
12517
13981.1
14275.7
13435
13565.7
16216.3
12970
14079.9
14235
12213.4
12581
14130.4
14210.8
14378.5
13142.8
13714.7
13621.9
15379.8
13306.3
14391.2
14909.9
14025.4
12951.2
14344.3
16093.4
15413.6
14705.7
15972.8
16241.4
16626.4
17136.2
15622.9
18003.9
16136.1
14423.7
16789.4
16782.2
14133.8
12607
12004.5
12175.4
13268
12299.3
11800.6
13873.3
12269.6


Summary of computational transaction
Raw Inputview raw input (R code)
Raw Outputview raw output of R engine
Computing time21 seconds
R Server'Gwilym Jenkins' @ 72.249.127.135

\begin{tabular}{lllllllll}
\hline
Summary of computational transaction \tabularnewline
Raw Input & view raw input (R code)  \tabularnewline
Raw Output & view raw output of R engine  \tabularnewline
Computing time & 21 seconds \tabularnewline
R Server & 'Gwilym Jenkins' @ 72.249.127.135 \tabularnewline
\hline
\end{tabular}
%Source: https://freestatistics.org/blog/index.php?pk=65044&T=0

[TABLE]
[ROW][C]Summary of computational transaction[/C][/ROW]
[ROW][C]Raw Input[/C][C]view raw input (R code) [/C][/ROW]
[ROW][C]Raw Output[/C][C]view raw output of R engine [/C][/ROW]
[ROW][C]Computing time[/C][C]21 seconds[/C][/ROW]
[ROW][C]R Server[/C][C]'Gwilym Jenkins' @ 72.249.127.135[/C][/ROW]
[/TABLE]
Source: https://freestatistics.org/blog/index.php?pk=65044&T=0

Globally Unique Identifier (entire table): ba.freestatistics.org/blog/index.php?pk=65044&T=0

As an alternative you can also use a QR Code:  

The GUIDs for individual cells are displayed in the table below:

Summary of computational transaction
Raw Inputview raw input (R code)
Raw Outputview raw output of R engine
Computing time21 seconds
R Server'Gwilym Jenkins' @ 72.249.127.135


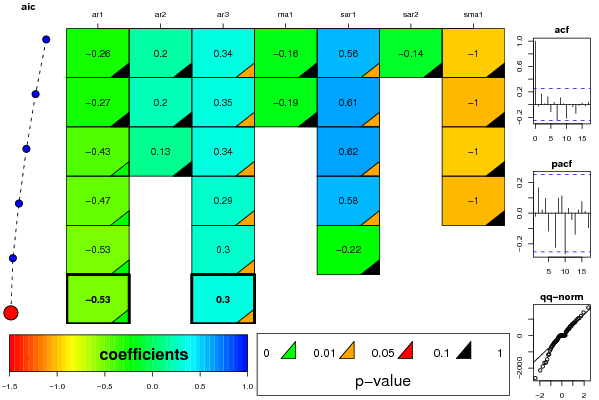
ARIMA Parameter Estimation and Backward Selection
Iterationar1ar2ar3ma1sar1sar2sma1
Estimates ( 1 )-0.25870.19910.336-0.15610.5631-0.1403-0.9977
(p-val)(0.3838 )(0.2445 )(0.0187 )(0.6121 )(0.0402 )(0.6978 )(0.3864 )
Estimates ( 2 )-0.27020.20080.3486-0.18810.61460-1
(p-val)(0.3384 )(0.2462 )(0.0109 )(0.5066 )(0.0127 )(NA )(0.1546 )
Estimates ( 3 )-0.4340.12740.338800.62370-0.9999
(p-val)(0.0023 )(0.4022 )(0.0138 )(NA )(0.0109 )(NA )(0.1187 )
Estimates ( 4 )-0.473100.289500.57510-1.0018
(p-val)(5e-04 )(NA )(0.0193 )(NA )(0.0181 )(NA )(0.2103 )
Estimates ( 5 )-0.534200.29890-0.220400
(p-val)(0 )(NA )(0.013 )(NA )(0.1913 )(NA )(NA )
Estimates ( 6 )-0.533800.30020000
(p-val)(0 )(NA )(0.0164 )(NA )(NA )(NA )(NA )
Estimates ( 7 )NANANANANANANA
(p-val)(NA )(NA )(NA )(NA )(NA )(NA )(NA )
Estimates ( 8 )NANANANANANANA
(p-val)(NA )(NA )(NA )(NA )(NA )(NA )(NA )
Estimates ( 9 )NANANANANANANA
(p-val)(NA )(NA )(NA )(NA )(NA )(NA )(NA )
Estimates ( 10 )NANANANANANANA
(p-val)(NA )(NA )(NA )(NA )(NA )(NA )(NA )
Estimates ( 11 )NANANANANANANA
(p-val)(NA )(NA )(NA )(NA )(NA )(NA )(NA )
Estimates ( 12 )NANANANANANANA
(p-val)(NA )(NA )(NA )(NA )(NA )(NA )(NA )
Estimates ( 13 )NANANANANANANA
(p-val)(NA )(NA )(NA )(NA )(NA )(NA )(NA )

\begin{tabular}{lllllllll}
\hline
ARIMA Parameter Estimation and Backward Selection \tabularnewline
Iteration & ar1 & ar2 & ar3 & ma1 & sar1 & sar2 & sma1 \tabularnewline
Estimates ( 1 ) & -0.2587 & 0.1991 & 0.336 & -0.1561 & 0.5631 & -0.1403 & -0.9977 \tabularnewline
(p-val) & (0.3838 ) & (0.2445 ) & (0.0187 ) & (0.6121 ) & (0.0402 ) & (0.6978 ) & (0.3864 ) \tabularnewline
Estimates ( 2 ) & -0.2702 & 0.2008 & 0.3486 & -0.1881 & 0.6146 & 0 & -1 \tabularnewline
(p-val) & (0.3384 ) & (0.2462 ) & (0.0109 ) & (0.5066 ) & (0.0127 ) & (NA ) & (0.1546 ) \tabularnewline
Estimates ( 3 ) & -0.434 & 0.1274 & 0.3388 & 0 & 0.6237 & 0 & -0.9999 \tabularnewline
(p-val) & (0.0023 ) & (0.4022 ) & (0.0138 ) & (NA ) & (0.0109 ) & (NA ) & (0.1187 ) \tabularnewline
Estimates ( 4 ) & -0.4731 & 0 & 0.2895 & 0 & 0.5751 & 0 & -1.0018 \tabularnewline
(p-val) & (5e-04 ) & (NA ) & (0.0193 ) & (NA ) & (0.0181 ) & (NA ) & (0.2103 ) \tabularnewline
Estimates ( 5 ) & -0.5342 & 0 & 0.2989 & 0 & -0.2204 & 0 & 0 \tabularnewline
(p-val) & (0 ) & (NA ) & (0.013 ) & (NA ) & (0.1913 ) & (NA ) & (NA ) \tabularnewline
Estimates ( 6 ) & -0.5338 & 0 & 0.3002 & 0 & 0 & 0 & 0 \tabularnewline
(p-val) & (0 ) & (NA ) & (0.0164 ) & (NA ) & (NA ) & (NA ) & (NA ) \tabularnewline
Estimates ( 7 ) & NA & NA & NA & NA & NA & NA & NA \tabularnewline
(p-val) & (NA ) & (NA ) & (NA ) & (NA ) & (NA ) & (NA ) & (NA ) \tabularnewline
Estimates ( 8 ) & NA & NA & NA & NA & NA & NA & NA \tabularnewline
(p-val) & (NA ) & (NA ) & (NA ) & (NA ) & (NA ) & (NA ) & (NA ) \tabularnewline
Estimates ( 9 ) & NA & NA & NA & NA & NA & NA & NA \tabularnewline
(p-val) & (NA ) & (NA ) & (NA ) & (NA ) & (NA ) & (NA ) & (NA ) \tabularnewline
Estimates ( 10 ) & NA & NA & NA & NA & NA & NA & NA \tabularnewline
(p-val) & (NA ) & (NA ) & (NA ) & (NA ) & (NA ) & (NA ) & (NA ) \tabularnewline
Estimates ( 11 ) & NA & NA & NA & NA & NA & NA & NA \tabularnewline
(p-val) & (NA ) & (NA ) & (NA ) & (NA ) & (NA ) & (NA ) & (NA ) \tabularnewline
Estimates ( 12 ) & NA & NA & NA & NA & NA & NA & NA \tabularnewline
(p-val) & (NA ) & (NA ) & (NA ) & (NA ) & (NA ) & (NA ) & (NA ) \tabularnewline
Estimates ( 13 ) & NA & NA & NA & NA & NA & NA & NA \tabularnewline
(p-val) & (NA ) & (NA ) & (NA ) & (NA ) & (NA ) & (NA ) & (NA ) \tabularnewline
\hline
\end{tabular}
%Source: https://freestatistics.org/blog/index.php?pk=65044&T=1

[TABLE]
[ROW][C]ARIMA Parameter Estimation and Backward Selection[/C][/ROW]
[ROW][C]Iteration[/C][C]ar1[/C][C]ar2[/C][C]ar3[/C][C]ma1[/C][C]sar1[/C][C]sar2[/C][C]sma1[/C][/ROW]
[ROW][C]Estimates ( 1 )[/C][C]-0.2587[/C][C]0.1991[/C][C]0.336[/C][C]-0.1561[/C][C]0.5631[/C][C]-0.1403[/C][C]-0.9977[/C][/ROW]
[ROW][C](p-val)[/C][C](0.3838 )[/C][C](0.2445 )[/C][C](0.0187 )[/C][C](0.6121 )[/C][C](0.0402 )[/C][C](0.6978 )[/C][C](0.3864 )[/C][/ROW]
[ROW][C]Estimates ( 2 )[/C][C]-0.2702[/C][C]0.2008[/C][C]0.3486[/C][C]-0.1881[/C][C]0.6146[/C][C]0[/C][C]-1[/C][/ROW]
[ROW][C](p-val)[/C][C](0.3384 )[/C][C](0.2462 )[/C][C](0.0109 )[/C][C](0.5066 )[/C][C](0.0127 )[/C][C](NA )[/C][C](0.1546 )[/C][/ROW]
[ROW][C]Estimates ( 3 )[/C][C]-0.434[/C][C]0.1274[/C][C]0.3388[/C][C]0[/C][C]0.6237[/C][C]0[/C][C]-0.9999[/C][/ROW]
[ROW][C](p-val)[/C][C](0.0023 )[/C][C](0.4022 )[/C][C](0.0138 )[/C][C](NA )[/C][C](0.0109 )[/C][C](NA )[/C][C](0.1187 )[/C][/ROW]
[ROW][C]Estimates ( 4 )[/C][C]-0.4731[/C][C]0[/C][C]0.2895[/C][C]0[/C][C]0.5751[/C][C]0[/C][C]-1.0018[/C][/ROW]
[ROW][C](p-val)[/C][C](5e-04 )[/C][C](NA )[/C][C](0.0193 )[/C][C](NA )[/C][C](0.0181 )[/C][C](NA )[/C][C](0.2103 )[/C][/ROW]
[ROW][C]Estimates ( 5 )[/C][C]-0.5342[/C][C]0[/C][C]0.2989[/C][C]0[/C][C]-0.2204[/C][C]0[/C][C]0[/C][/ROW]
[ROW][C](p-val)[/C][C](0 )[/C][C](NA )[/C][C](0.013 )[/C][C](NA )[/C][C](0.1913 )[/C][C](NA )[/C][C](NA )[/C][/ROW]
[ROW][C]Estimates ( 6 )[/C][C]-0.5338[/C][C]0[/C][C]0.3002[/C][C]0[/C][C]0[/C][C]0[/C][C]0[/C][/ROW]
[ROW][C](p-val)[/C][C](0 )[/C][C](NA )[/C][C](0.0164 )[/C][C](NA )[/C][C](NA )[/C][C](NA )[/C][C](NA )[/C][/ROW]
[ROW][C]Estimates ( 7 )[/C][C]NA[/C][C]NA[/C][C]NA[/C][C]NA[/C][C]NA[/C][C]NA[/C][C]NA[/C][/ROW]
[ROW][C](p-val)[/C][C](NA )[/C][C](NA )[/C][C](NA )[/C][C](NA )[/C][C](NA )[/C][C](NA )[/C][C](NA )[/C][/ROW]
[ROW][C]Estimates ( 8 )[/C][C]NA[/C][C]NA[/C][C]NA[/C][C]NA[/C][C]NA[/C][C]NA[/C][C]NA[/C][/ROW]
[ROW][C](p-val)[/C][C](NA )[/C][C](NA )[/C][C](NA )[/C][C](NA )[/C][C](NA )[/C][C](NA )[/C][C](NA )[/C][/ROW]
[ROW][C]Estimates ( 9 )[/C][C]NA[/C][C]NA[/C][C]NA[/C][C]NA[/C][C]NA[/C][C]NA[/C][C]NA[/C][/ROW]
[ROW][C](p-val)[/C][C](NA )[/C][C](NA )[/C][C](NA )[/C][C](NA )[/C][C](NA )[/C][C](NA )[/C][C](NA )[/C][/ROW]
[ROW][C]Estimates ( 10 )[/C][C]NA[/C][C]NA[/C][C]NA[/C][C]NA[/C][C]NA[/C][C]NA[/C][C]NA[/C][/ROW]
[ROW][C](p-val)[/C][C](NA )[/C][C](NA )[/C][C](NA )[/C][C](NA )[/C][C](NA )[/C][C](NA )[/C][C](NA )[/C][/ROW]
[ROW][C]Estimates ( 11 )[/C][C]NA[/C][C]NA[/C][C]NA[/C][C]NA[/C][C]NA[/C][C]NA[/C][C]NA[/C][/ROW]
[ROW][C](p-val)[/C][C](NA )[/C][C](NA )[/C][C](NA )[/C][C](NA )[/C][C](NA )[/C][C](NA )[/C][C](NA )[/C][/ROW]
[ROW][C]Estimates ( 12 )[/C][C]NA[/C][C]NA[/C][C]NA[/C][C]NA[/C][C]NA[/C][C]NA[/C][C]NA[/C][/ROW]
[ROW][C](p-val)[/C][C](NA )[/C][C](NA )[/C][C](NA )[/C][C](NA )[/C][C](NA )[/C][C](NA )[/C][C](NA )[/C][/ROW]
[ROW][C]Estimates ( 13 )[/C][C]NA[/C][C]NA[/C][C]NA[/C][C]NA[/C][C]NA[/C][C]NA[/C][C]NA[/C][/ROW]
[ROW][C](p-val)[/C][C](NA )[/C][C](NA )[/C][C](NA )[/C][C](NA )[/C][C](NA )[/C][C](NA )[/C][C](NA )[/C][/ROW]
[/TABLE]
Source: https://freestatistics.org/blog/index.php?pk=65044&T=1

Globally Unique Identifier (entire table): ba.freestatistics.org/blog/index.php?pk=65044&T=1

As an alternative you can also use a QR Code:  

The GUIDs for individual cells are displayed in the table below:

ARIMA Parameter Estimation and Backward Selection
Iterationar1ar2ar3ma1sar1sar2sma1
Estimates ( 1 )-0.25870.19910.336-0.15610.5631-0.1403-0.9977
(p-val)(0.3838 )(0.2445 )(0.0187 )(0.6121 )(0.0402 )(0.6978 )(0.3864 )
Estimates ( 2 )-0.27020.20080.3486-0.18810.61460-1
(p-val)(0.3384 )(0.2462 )(0.0109 )(0.5066 )(0.0127 )(NA )(0.1546 )
Estimates ( 3 )-0.4340.12740.338800.62370-0.9999
(p-val)(0.0023 )(0.4022 )(0.0138 )(NA )(0.0109 )(NA )(0.1187 )
Estimates ( 4 )-0.473100.289500.57510-1.0018
(p-val)(5e-04 )(NA )(0.0193 )(NA )(0.0181 )(NA )(0.2103 )
Estimates ( 5 )-0.534200.29890-0.220400
(p-val)(0 )(NA )(0.013 )(NA )(0.1913 )(NA )(NA )
Estimates ( 6 )-0.533800.30020000
(p-val)(0 )(NA )(0.0164 )(NA )(NA )(NA )(NA )
Estimates ( 7 )NANANANANANANA
(p-val)(NA )(NA )(NA )(NA )(NA )(NA )(NA )
Estimates ( 8 )NANANANANANANA
(p-val)(NA )(NA )(NA )(NA )(NA )(NA )(NA )
Estimates ( 9 )NANANANANANANA
(p-val)(NA )(NA )(NA )(NA )(NA )(NA )(NA )
Estimates ( 10 )NANANANANANANA
(p-val)(NA )(NA )(NA )(NA )(NA )(NA )(NA )
Estimates ( 11 )NANANANANANANA
(p-val)(NA )(NA )(NA )(NA )(NA )(NA )(NA )
Estimates ( 12 )NANANANANANANA
(p-val)(NA )(NA )(NA )(NA )(NA )(NA )(NA )
Estimates ( 13 )NANANANANANANA
(p-val)(NA )(NA )(NA )(NA )(NA )(NA )(NA )


Estimated ARIMA Residuals
Value
-38.5929024816321
221.514259292002
-815.320153921666
945.828837792503
394.230339491175
689.882024643655
-676.373412635638
707.347655993792
-1656.21513560062
786.506051230295
-285.888988946751
278.549443441271
-375.157963245351
-448.02464733581
533.387859032131
-432.455975225448
-1896.91382959658
388.480021018126
769.579468272319
-399.012895283124
-99.166699650498
850.516010402921
540.831933428872
1057.88655639722
-917.680019521656
-1149.60998143002
1398.44835439880
334.717217796313
-315.913590476373
529.924228259399
1188.6184596957
-1459.89570304208
1702.43622988924
-1178.99174115307
1020.87771731640
-544.580116084435
-569.023905108121
-153.231102069238
-668.295492346659
-2611.29078125239
-2134.36969423147
-1676.55975945970
-290.499461013625
605.340981114765
-179.616283964151
-38.3463537857824
217.196015901627
373.694392183203

\begin{tabular}{lllllllll}
\hline
Estimated ARIMA Residuals \tabularnewline
Value \tabularnewline
-38.5929024816321 \tabularnewline
221.514259292002 \tabularnewline
-815.320153921666 \tabularnewline
945.828837792503 \tabularnewline
394.230339491175 \tabularnewline
689.882024643655 \tabularnewline
-676.373412635638 \tabularnewline
707.347655993792 \tabularnewline
-1656.21513560062 \tabularnewline
786.506051230295 \tabularnewline
-285.888988946751 \tabularnewline
278.549443441271 \tabularnewline
-375.157963245351 \tabularnewline
-448.02464733581 \tabularnewline
533.387859032131 \tabularnewline
-432.455975225448 \tabularnewline
-1896.91382959658 \tabularnewline
388.480021018126 \tabularnewline
769.579468272319 \tabularnewline
-399.012895283124 \tabularnewline
-99.166699650498 \tabularnewline
850.516010402921 \tabularnewline
540.831933428872 \tabularnewline
1057.88655639722 \tabularnewline
-917.680019521656 \tabularnewline
-1149.60998143002 \tabularnewline
1398.44835439880 \tabularnewline
334.717217796313 \tabularnewline
-315.913590476373 \tabularnewline
529.924228259399 \tabularnewline
1188.6184596957 \tabularnewline
-1459.89570304208 \tabularnewline
1702.43622988924 \tabularnewline
-1178.99174115307 \tabularnewline
1020.87771731640 \tabularnewline
-544.580116084435 \tabularnewline
-569.023905108121 \tabularnewline
-153.231102069238 \tabularnewline
-668.295492346659 \tabularnewline
-2611.29078125239 \tabularnewline
-2134.36969423147 \tabularnewline
-1676.55975945970 \tabularnewline
-290.499461013625 \tabularnewline
605.340981114765 \tabularnewline
-179.616283964151 \tabularnewline
-38.3463537857824 \tabularnewline
217.196015901627 \tabularnewline
373.694392183203 \tabularnewline
\hline
\end{tabular}
%Source: https://freestatistics.org/blog/index.php?pk=65044&T=2

[TABLE]
[ROW][C]Estimated ARIMA Residuals[/C][/ROW]
[ROW][C]Value[/C][/ROW]
[ROW][C]-38.5929024816321[/C][/ROW]
[ROW][C]221.514259292002[/C][/ROW]
[ROW][C]-815.320153921666[/C][/ROW]
[ROW][C]945.828837792503[/C][/ROW]
[ROW][C]394.230339491175[/C][/ROW]
[ROW][C]689.882024643655[/C][/ROW]
[ROW][C]-676.373412635638[/C][/ROW]
[ROW][C]707.347655993792[/C][/ROW]
[ROW][C]-1656.21513560062[/C][/ROW]
[ROW][C]786.506051230295[/C][/ROW]
[ROW][C]-285.888988946751[/C][/ROW]
[ROW][C]278.549443441271[/C][/ROW]
[ROW][C]-375.157963245351[/C][/ROW]
[ROW][C]-448.02464733581[/C][/ROW]
[ROW][C]533.387859032131[/C][/ROW]
[ROW][C]-432.455975225448[/C][/ROW]
[ROW][C]-1896.91382959658[/C][/ROW]
[ROW][C]388.480021018126[/C][/ROW]
[ROW][C]769.579468272319[/C][/ROW]
[ROW][C]-399.012895283124[/C][/ROW]
[ROW][C]-99.166699650498[/C][/ROW]
[ROW][C]850.516010402921[/C][/ROW]
[ROW][C]540.831933428872[/C][/ROW]
[ROW][C]1057.88655639722[/C][/ROW]
[ROW][C]-917.680019521656[/C][/ROW]
[ROW][C]-1149.60998143002[/C][/ROW]
[ROW][C]1398.44835439880[/C][/ROW]
[ROW][C]334.717217796313[/C][/ROW]
[ROW][C]-315.913590476373[/C][/ROW]
[ROW][C]529.924228259399[/C][/ROW]
[ROW][C]1188.6184596957[/C][/ROW]
[ROW][C]-1459.89570304208[/C][/ROW]
[ROW][C]1702.43622988924[/C][/ROW]
[ROW][C]-1178.99174115307[/C][/ROW]
[ROW][C]1020.87771731640[/C][/ROW]
[ROW][C]-544.580116084435[/C][/ROW]
[ROW][C]-569.023905108121[/C][/ROW]
[ROW][C]-153.231102069238[/C][/ROW]
[ROW][C]-668.295492346659[/C][/ROW]
[ROW][C]-2611.29078125239[/C][/ROW]
[ROW][C]-2134.36969423147[/C][/ROW]
[ROW][C]-1676.55975945970[/C][/ROW]
[ROW][C]-290.499461013625[/C][/ROW]
[ROW][C]605.340981114765[/C][/ROW]
[ROW][C]-179.616283964151[/C][/ROW]
[ROW][C]-38.3463537857824[/C][/ROW]
[ROW][C]217.196015901627[/C][/ROW]
[ROW][C]373.694392183203[/C][/ROW]
[/TABLE]
Source: https://freestatistics.org/blog/index.php?pk=65044&T=2

Globally Unique Identifier (entire table): ba.freestatistics.org/blog/index.php?pk=65044&T=2

As an alternative you can also use a QR Code:  

The GUIDs for individual cells are displayed in the table below:

Estimated ARIMA Residuals
Value
-38.5929024816321
221.514259292002
-815.320153921666
945.828837792503
394.230339491175
689.882024643655
-676.373412635638
707.347655993792
-1656.21513560062
786.506051230295
-285.888988946751
278.549443441271
-375.157963245351
-448.02464733581
533.387859032131
-432.455975225448
-1896.91382959658
388.480021018126
769.579468272319
-399.012895283124
-99.166699650498
850.516010402921
540.831933428872
1057.88655639722
-917.680019521656
-1149.60998143002
1398.44835439880
334.717217796313
-315.913590476373
529.924228259399
1188.6184596957
-1459.89570304208
1702.43622988924
-1178.99174115307
1020.87771731640
-544.580116084435
-569.023905108121
-153.231102069238
-668.295492346659
-2611.29078125239
-2134.36969423147
-1676.55975945970
-290.499461013625
605.340981114765
-179.616283964151
-38.3463537857824
217.196015901627
373.694392183203


Parameters (Session):
par1 = FALSE ; par2 = 1 ; par3 = 1 ; par4 = 1 ; par5 = 12 ; par6 = 3 ; par7 = 1 ; par8 = 2 ; par9 = 1 ;
Parameters (R input):
par1 = FALSE ; par2 = 1 ; par3 = 1 ; par4 = 1 ; par5 = 12 ; par6 = 3 ; par7 = 1 ; par8 = 2 ; par9 = 1 ;
R code (references can be found in the software module):
library(lattice)
if (par1 == 'TRUE') par1 <- TRUE
if (par1 == 'FALSE') par1 <- FALSE
par2 <- as.numeric(par2) #Box-Cox lambda transformation parameter
par3 <- as.numeric(par3) #degree of non-seasonal differencing
par4 <- as.numeric(par4) #degree of seasonal differencing
par5 <- as.numeric(par5) #seasonal period
par6 <- as.numeric(par6) #degree (p) of the non-seasonal AR(p) polynomial
par7 <- as.numeric(par7) #degree (q) of the non-seasonal MA(q) polynomial
par8 <- as.numeric(par8) #degree (P) of the seasonal AR(P) polynomial
par9 <- as.numeric(par9) #degree (Q) of the seasonal MA(Q) polynomial
armaGR <- function(arima.out, names, n){
try1 <- arima.out$coef
try2 <- sqrt(diag(arima.out$var.coef))
try.data.frame <- data.frame(matrix(NA,ncol=4,nrow=length(names)))
dimnames(try.data.frame) <- list(names,c('coef','std','tstat','pv'))
try.data.frame[,1] <- try1
for(i in 1:length(try2)) try.data.frame[which(rownames(try.data.frame)==names(try2)[i]),2] <- try2[i]
try.data.frame[,3] <- try.data.frame[,1] / try.data.frame[,2]
try.data.frame[,4] <- round((1-pt(abs(try.data.frame[,3]),df=n-(length(try2)+1)))*2,5)
vector <- rep(NA,length(names))
vector[is.na(try.data.frame[,4])] <- 0
maxi <- which.max(try.data.frame[,4])
continue <- max(try.data.frame[,4],na.rm=TRUE) > .05
vector[maxi] <- 0
list(summary=try.data.frame,next.vector=vector,continue=continue)
}
arimaSelect <- function(series, order=c(13,0,0), seasonal=list(order=c(2,0,0),period=12), include.mean=F){
nrc <- order[1]+order[3]+seasonal$order[1]+seasonal$order[3]
coeff <- matrix(NA, nrow=nrc*2, ncol=nrc)
pval <- matrix(NA, nrow=nrc*2, ncol=nrc)
mylist <- rep(list(NULL), nrc)
names <- NULL
if(order[1] > 0) names <- paste('ar',1:order[1],sep='')
if(order[3] > 0) names <- c( names , paste('ma',1:order[3],sep='') )
if(seasonal$order[1] > 0) names <- c(names, paste('sar',1:seasonal$order[1],sep=''))
if(seasonal$order[3] > 0) names <- c(names, paste('sma',1:seasonal$order[3],sep=''))
arima.out <- arima(series, order=order, seasonal=seasonal, include.mean=include.mean, method='ML')
mylist[[1]] <- arima.out
last.arma <- armaGR(arima.out, names, length(series))
mystop <- FALSE
i <- 1
coeff[i,] <- last.arma[[1]][,1]
pval [i,] <- last.arma[[1]][,4]
i <- 2
aic <- arima.out$aic
while(!mystop){
mylist[[i]] <- arima.out
arima.out <- arima(series, order=order, seasonal=seasonal, include.mean=include.mean, method='ML', fixed=last.arma$next.vector)
aic <- c(aic, arima.out$aic)
last.arma <- armaGR(arima.out, names, length(series))
mystop <- !last.arma$continue
coeff[i,] <- last.arma[[1]][,1]
pval [i,] <- last.arma[[1]][,4]
i <- i+1
}
list(coeff, pval, mylist, aic=aic)
}
arimaSelectplot <- function(arimaSelect.out,noms,choix){
noms <- names(arimaSelect.out[[3]][[1]]$coef)
coeff <- arimaSelect.out[[1]]
k <- min(which(is.na(coeff[,1])))-1
coeff <- coeff[1:k,]
pval <- arimaSelect.out[[2]][1:k,]
aic <- arimaSelect.out$aic[1:k]
coeff[coeff==0] <- NA
n <- ncol(coeff)
if(missing(choix)) choix <- k
layout(matrix(c(1,1,1,2,
3,3,3,2,
3,3,3,4,
5,6,7,7),nr=4),
widths=c(10,35,45,15),
heights=c(30,30,15,15))
couleurs <- rainbow(75)[1:50]#(50)
ticks <- pretty(coeff)
par(mar=c(1,1,3,1))
plot(aic,k:1-.5,type='o',pch=21,bg='blue',cex=2,axes=F,lty=2,xpd=NA)
points(aic[choix],k-choix+.5,pch=21,cex=4,bg=2,xpd=NA)
title('aic',line=2)
par(mar=c(3,0,0,0))
plot(0,axes=F,xlab='',ylab='',xlim=range(ticks),ylim=c(.1,1))
rect(xleft = min(ticks) + (0:49)/50*(max(ticks)-min(ticks)),
xright = min(ticks) + (1:50)/50*(max(ticks)-min(ticks)),
ytop = rep(1,50),
ybottom= rep(0,50),col=couleurs,border=NA)
axis(1,ticks)
rect(xleft=min(ticks),xright=max(ticks),ytop=1,ybottom=0)
text(mean(coeff,na.rm=T),.5,'coefficients',cex=2,font=2)
par(mar=c(1,1,3,1))
image(1:n,1:k,t(coeff[k:1,]),axes=F,col=couleurs,zlim=range(ticks))
for(i in 1:n) for(j in 1:k) if(!is.na(coeff[j,i])) {
if(pval[j,i]<.01) symb = 'green'
else if( (pval[j,i]<.05) & (pval[j,i]>=.01)) symb = 'orange'
else if( (pval[j,i]<.1) & (pval[j,i]>=.05)) symb = 'red'
else symb = 'black'
polygon(c(i+.5 ,i+.2 ,i+.5 ,i+.5),
c(k-j+0.5,k-j+0.5,k-j+0.8,k-j+0.5),
col=symb)
if(j==choix) {
rect(xleft=i-.5,
xright=i+.5,
ybottom=k-j+1.5,
ytop=k-j+.5,
lwd=4)
text(i,
k-j+1,
round(coeff[j,i],2),
cex=1.2,
font=2)
}
else{
rect(xleft=i-.5,xright=i+.5,ybottom=k-j+1.5,ytop=k-j+.5)
text(i,k-j+1,round(coeff[j,i],2),cex=1.2,font=1)
}
}
axis(3,1:n,noms)
par(mar=c(0.5,0,0,0.5))
plot(0,axes=F,xlab='',ylab='',type='n',xlim=c(0,8),ylim=c(-.2,.8))
cols <- c('green','orange','red','black')
niv <- c('0','0.01','0.05','0.1')
for(i in 0:3){
polygon(c(1+2*i ,1+2*i ,1+2*i-.5 ,1+2*i),
c(.4 ,.7 , .4 , .4),
col=cols[i+1])
text(2*i,0.5,niv[i+1],cex=1.5)
}
text(8,.5,1,cex=1.5)
text(4,0,'p-value',cex=2)
box()
residus <- arimaSelect.out[[3]][[choix]]$res
par(mar=c(1,2,4,1))
acf(residus,main='')
title('acf',line=.5)
par(mar=c(1,2,4,1))
pacf(residus,main='')
title('pacf',line=.5)
par(mar=c(2,2,4,1))
qqnorm(residus,main='')
title('qq-norm',line=.5)
qqline(residus)
residus
}
if (par2 == 0) x <- log(x)
if (par2 != 0) x <- x^par2
(selection <- arimaSelect(x, order=c(par6,par3,par7), seasonal=list(order=c(par8,par4,par9), period=par5)))
bitmap(file='test1.png')
resid <- arimaSelectplot(selection)
dev.off()
resid
bitmap(file='test2.png')
acf(resid,length(resid)/2, main='Residual Autocorrelation Function')
dev.off()
bitmap(file='test3.png')
pacf(resid,length(resid)/2, main='Residual Partial Autocorrelation Function')
dev.off()
bitmap(file='test4.png')
cpgram(resid, main='Residual Cumulative Periodogram')
dev.off()
bitmap(file='test5.png')
hist(resid, main='Residual Histogram', xlab='values of Residuals')
dev.off()
bitmap(file='test6.png')
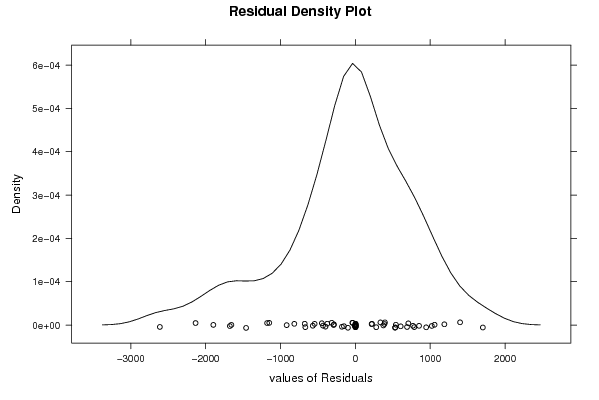
densityplot(~resid,col='black',main='Residual Density Plot', xlab='values of Residuals')
dev.off()
bitmap(file='test7.png')
qqnorm(resid, main='Residual Normal Q-Q Plot')
qqline(resid)
dev.off()
ncols <- length(selection[[1]][1,])
nrows <- length(selection[[2]][,1])-1
load(file='createtable')
a<-table.start()
a<-table.row.start(a)
a<-table.element(a,'ARIMA Parameter Estimation and Backward Selection', ncols+1,TRUE)
a<-table.row.end(a)
a<-table.row.start(a)
a<-table.element(a,'Iteration', header=TRUE)
for (i in 1:ncols) {
a<-table.element(a,names(selection[[3]][[1]]$coef)[i],header=TRUE)
}
a<-table.row.end(a)
for (j in 1:nrows) {
a<-table.row.start(a)
mydum <- 'Estimates ('
mydum <- paste(mydum,j)
mydum <- paste(mydum,')')
a<-table.element(a,mydum, header=TRUE)
for (i in 1:ncols) {
a<-table.element(a,round(selection[[1]][j,i],4))
}
a<-table.row.end(a)
a<-table.row.start(a)
a<-table.element(a,'(p-val)', header=TRUE)
for (i in 1:ncols) {
mydum <- '('
mydum <- paste(mydum,round(selection[[2]][j,i],4),sep='')
mydum <- paste(mydum,')')
a<-table.element(a,mydum)
}
a<-table.row.end(a)
}
a<-table.end(a)
table.save(a,file='mytable.tab')
a<-table.start()
a<-table.row.start(a)
a<-table.element(a,'Estimated ARIMA Residuals', 1,TRUE)
a<-table.row.end(a)
a<-table.row.start(a)
a<-table.element(a,'Value', 1,TRUE)
a<-table.row.end(a)
for (i in (par4*par5+par3):length(resid)) {
a<-table.row.start(a)
a<-table.element(a,resid[i])
a<-table.row.end(a)
}
a<-table.end(a)
table.save(a,file='mytable1.tab')