Free Statistics

of Irreproducible Research!

Author's title

Author*The author of this computation has been verified*
R Software Modulerwasp_autocorrelation.wasp
Title produced by software(Partial) Autocorrelation Function
Date of computationWed, 09 Dec 2009 11:50:44 -0700
Cite this page as followsStatistical Computations at FreeStatistics.org, Office for Research Development and Education, URL https://freestatistics.org/blog/index.php?v=date/2009/Dec/09/t12603847005j97z4s8mmcpx38.htm/, Retrieved Mon, 29 Apr 2024 14:00:32 +0000
Statistical Computations at FreeStatistics.org, Office for Research Development and Education, URL https://freestatistics.org/blog/index.php?pk=65142, Retrieved Mon, 29 Apr 2024 14:00:32 +0000
QR Codes:

Original text written by user:
IsPrivate?No (this computation is public)
User-defined keywords
Estimated Impact131
Family? (F = Feedback message, R = changed R code, M = changed R Module, P = changed Parameters, D = changed Data)
-     [Univariate Data Series] [data set] [2008-12-01 19:54:57] [b98453cac15ba1066b407e146608df68]
- RMP   [(Partial) Autocorrelation Function] [] [2009-11-27 14:46:03] [b98453cac15ba1066b407e146608df68]
- R PD    [(Partial) Autocorrelation Function] [ws9-3] [2009-12-04 20:43:56] [74be16979710d4c4e7c6647856088456]
-   P       [(Partial) Autocorrelation Function] [ws9-4] [2009-12-04 20:46:30] [74be16979710d4c4e7c6647856088456]
-   P           [(Partial) Autocorrelation Function] [WS9 acf] [2009-12-09 18:50:44] [dd4f17965cad1d38de7a1c062d32d75d] [Current]
Feedback Forum

Post a new message
Dataseries X:
2360
2214
2825
2355
2333
3016
2155
2172
2150
2533
2058
2160
2260
2498
2695
2799
2947
2930
2318
2540
2570
2669
2450
2842
3440
2678
2981
2260
2844
2546
2456
2295
2379
2479
2057
2280
2351
2276
2548
2311
2201
2725
2408
2139
1898
2537
2069
2063
2524
2437
2189
2793
2074
2622
2278
2144
2427
2139
1828
2072
1800
1758
2246
1987
1868
2514
2121


Summary of computational transaction
Raw Inputview raw input (R code)
Raw Outputview raw output of R engine
Computing time1 seconds
R Server'Gwilym Jenkins' @ 72.249.127.135

\begin{tabular}{lllllllll}
\hline
Summary of computational transaction \tabularnewline
Raw Input & view raw input (R code)  \tabularnewline
Raw Output & view raw output of R engine  \tabularnewline
Computing time & 1 seconds \tabularnewline
R Server & 'Gwilym Jenkins' @ 72.249.127.135 \tabularnewline
\hline
\end{tabular}
%Source: https://freestatistics.org/blog/index.php?pk=65142&T=0

[TABLE]
[ROW][C]Summary of computational transaction[/C][/ROW]
[ROW][C]Raw Input[/C][C]view raw input (R code) [/C][/ROW]
[ROW][C]Raw Output[/C][C]view raw output of R engine [/C][/ROW]
[ROW][C]Computing time[/C][C]1 seconds[/C][/ROW]
[ROW][C]R Server[/C][C]'Gwilym Jenkins' @ 72.249.127.135[/C][/ROW]
[/TABLE]
Source: https://freestatistics.org/blog/index.php?pk=65142&T=0

Globally Unique Identifier (entire table): ba.freestatistics.org/blog/index.php?pk=65142&T=0

As an alternative you can also use a QR Code:  

The GUIDs for individual cells are displayed in the table below:

Summary of computational transaction
Raw Inputview raw input (R code)
Raw Outputview raw output of R engine
Computing time1 seconds
R Server'Gwilym Jenkins' @ 72.249.127.135


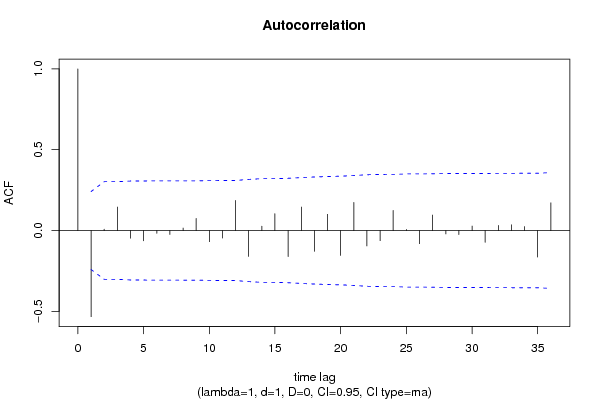
Autocorrelation Function
Time lag kACF(k)T-STATP-value
1-0.533196-4.33172.6e-05
20.0084220.06840.472829
30.1449221.17740.121641
4-0.047619-0.38690.350051
5-0.063677-0.51730.303334
6-0.017728-0.1440.442962
7-0.02459-0.19980.421137
80.0150240.12210.451614
90.0745830.60590.273325
10-0.069548-0.5650.286991
11-0.046818-0.38030.352454
120.1861041.51190.067664
13-0.160624-1.30490.098227
140.0265280.21550.415014
150.1044070.84820.199693
16-0.16107-1.30850.097615
170.1450911.17870.12137
18-0.128848-1.04680.149513
190.1005190.81660.208541
20-0.154648-1.25640.106705
210.173981.41340.081116
22-0.0959-0.77910.219355
23-0.062954-0.51140.305376
240.1241131.00830.158497
250.0064730.05260.479109
26-0.081965-0.66590.253902
270.0957170.77760.21979
28-0.021152-0.17180.432043
29-0.025402-0.20640.418569
300.0276920.2250.411347
31-0.073112-0.5940.277283
320.0311380.2530.400542
330.0350870.28510.388249
340.0242010.19660.422367
35-0.164625-1.33740.092839
360.1715211.39340.08408

\begin{tabular}{lllllllll}
\hline
Autocorrelation Function \tabularnewline
Time lag k & ACF(k) & T-STAT & P-value \tabularnewline
1 & -0.533196 & -4.3317 & 2.6e-05 \tabularnewline
2 & 0.008422 & 0.0684 & 0.472829 \tabularnewline
3 & 0.144922 & 1.1774 & 0.121641 \tabularnewline
4 & -0.047619 & -0.3869 & 0.350051 \tabularnewline
5 & -0.063677 & -0.5173 & 0.303334 \tabularnewline
6 & -0.017728 & -0.144 & 0.442962 \tabularnewline
7 & -0.02459 & -0.1998 & 0.421137 \tabularnewline
8 & 0.015024 & 0.1221 & 0.451614 \tabularnewline
9 & 0.074583 & 0.6059 & 0.273325 \tabularnewline
10 & -0.069548 & -0.565 & 0.286991 \tabularnewline
11 & -0.046818 & -0.3803 & 0.352454 \tabularnewline
12 & 0.186104 & 1.5119 & 0.067664 \tabularnewline
13 & -0.160624 & -1.3049 & 0.098227 \tabularnewline
14 & 0.026528 & 0.2155 & 0.415014 \tabularnewline
15 & 0.104407 & 0.8482 & 0.199693 \tabularnewline
16 & -0.16107 & -1.3085 & 0.097615 \tabularnewline
17 & 0.145091 & 1.1787 & 0.12137 \tabularnewline
18 & -0.128848 & -1.0468 & 0.149513 \tabularnewline
19 & 0.100519 & 0.8166 & 0.208541 \tabularnewline
20 & -0.154648 & -1.2564 & 0.106705 \tabularnewline
21 & 0.17398 & 1.4134 & 0.081116 \tabularnewline
22 & -0.0959 & -0.7791 & 0.219355 \tabularnewline
23 & -0.062954 & -0.5114 & 0.305376 \tabularnewline
24 & 0.124113 & 1.0083 & 0.158497 \tabularnewline
25 & 0.006473 & 0.0526 & 0.479109 \tabularnewline
26 & -0.081965 & -0.6659 & 0.253902 \tabularnewline
27 & 0.095717 & 0.7776 & 0.21979 \tabularnewline
28 & -0.021152 & -0.1718 & 0.432043 \tabularnewline
29 & -0.025402 & -0.2064 & 0.418569 \tabularnewline
30 & 0.027692 & 0.225 & 0.411347 \tabularnewline
31 & -0.073112 & -0.594 & 0.277283 \tabularnewline
32 & 0.031138 & 0.253 & 0.400542 \tabularnewline
33 & 0.035087 & 0.2851 & 0.388249 \tabularnewline
34 & 0.024201 & 0.1966 & 0.422367 \tabularnewline
35 & -0.164625 & -1.3374 & 0.092839 \tabularnewline
36 & 0.171521 & 1.3934 & 0.08408 \tabularnewline
\hline
\end{tabular}
%Source: https://freestatistics.org/blog/index.php?pk=65142&T=1

[TABLE]
[ROW][C]Autocorrelation Function[/C][/ROW]
[ROW][C]Time lag k[/C][C]ACF(k)[/C][C]T-STAT[/C][C]P-value[/C][/ROW]
[ROW][C]1[/C][C]-0.533196[/C][C]-4.3317[/C][C]2.6e-05[/C][/ROW]
[ROW][C]2[/C][C]0.008422[/C][C]0.0684[/C][C]0.472829[/C][/ROW]
[ROW][C]3[/C][C]0.144922[/C][C]1.1774[/C][C]0.121641[/C][/ROW]
[ROW][C]4[/C][C]-0.047619[/C][C]-0.3869[/C][C]0.350051[/C][/ROW]
[ROW][C]5[/C][C]-0.063677[/C][C]-0.5173[/C][C]0.303334[/C][/ROW]
[ROW][C]6[/C][C]-0.017728[/C][C]-0.144[/C][C]0.442962[/C][/ROW]
[ROW][C]7[/C][C]-0.02459[/C][C]-0.1998[/C][C]0.421137[/C][/ROW]
[ROW][C]8[/C][C]0.015024[/C][C]0.1221[/C][C]0.451614[/C][/ROW]
[ROW][C]9[/C][C]0.074583[/C][C]0.6059[/C][C]0.273325[/C][/ROW]
[ROW][C]10[/C][C]-0.069548[/C][C]-0.565[/C][C]0.286991[/C][/ROW]
[ROW][C]11[/C][C]-0.046818[/C][C]-0.3803[/C][C]0.352454[/C][/ROW]
[ROW][C]12[/C][C]0.186104[/C][C]1.5119[/C][C]0.067664[/C][/ROW]
[ROW][C]13[/C][C]-0.160624[/C][C]-1.3049[/C][C]0.098227[/C][/ROW]
[ROW][C]14[/C][C]0.026528[/C][C]0.2155[/C][C]0.415014[/C][/ROW]
[ROW][C]15[/C][C]0.104407[/C][C]0.8482[/C][C]0.199693[/C][/ROW]
[ROW][C]16[/C][C]-0.16107[/C][C]-1.3085[/C][C]0.097615[/C][/ROW]
[ROW][C]17[/C][C]0.145091[/C][C]1.1787[/C][C]0.12137[/C][/ROW]
[ROW][C]18[/C][C]-0.128848[/C][C]-1.0468[/C][C]0.149513[/C][/ROW]
[ROW][C]19[/C][C]0.100519[/C][C]0.8166[/C][C]0.208541[/C][/ROW]
[ROW][C]20[/C][C]-0.154648[/C][C]-1.2564[/C][C]0.106705[/C][/ROW]
[ROW][C]21[/C][C]0.17398[/C][C]1.4134[/C][C]0.081116[/C][/ROW]
[ROW][C]22[/C][C]-0.0959[/C][C]-0.7791[/C][C]0.219355[/C][/ROW]
[ROW][C]23[/C][C]-0.062954[/C][C]-0.5114[/C][C]0.305376[/C][/ROW]
[ROW][C]24[/C][C]0.124113[/C][C]1.0083[/C][C]0.158497[/C][/ROW]
[ROW][C]25[/C][C]0.006473[/C][C]0.0526[/C][C]0.479109[/C][/ROW]
[ROW][C]26[/C][C]-0.081965[/C][C]-0.6659[/C][C]0.253902[/C][/ROW]
[ROW][C]27[/C][C]0.095717[/C][C]0.7776[/C][C]0.21979[/C][/ROW]
[ROW][C]28[/C][C]-0.021152[/C][C]-0.1718[/C][C]0.432043[/C][/ROW]
[ROW][C]29[/C][C]-0.025402[/C][C]-0.2064[/C][C]0.418569[/C][/ROW]
[ROW][C]30[/C][C]0.027692[/C][C]0.225[/C][C]0.411347[/C][/ROW]
[ROW][C]31[/C][C]-0.073112[/C][C]-0.594[/C][C]0.277283[/C][/ROW]
[ROW][C]32[/C][C]0.031138[/C][C]0.253[/C][C]0.400542[/C][/ROW]
[ROW][C]33[/C][C]0.035087[/C][C]0.2851[/C][C]0.388249[/C][/ROW]
[ROW][C]34[/C][C]0.024201[/C][C]0.1966[/C][C]0.422367[/C][/ROW]
[ROW][C]35[/C][C]-0.164625[/C][C]-1.3374[/C][C]0.092839[/C][/ROW]
[ROW][C]36[/C][C]0.171521[/C][C]1.3934[/C][C]0.08408[/C][/ROW]
[/TABLE]
Source: https://freestatistics.org/blog/index.php?pk=65142&T=1

Globally Unique Identifier (entire table): ba.freestatistics.org/blog/index.php?pk=65142&T=1

As an alternative you can also use a QR Code:  

The GUIDs for individual cells are displayed in the table below:

Autocorrelation Function
Time lag kACF(k)T-STATP-value
1-0.533196-4.33172.6e-05
20.0084220.06840.472829
30.1449221.17740.121641
4-0.047619-0.38690.350051
5-0.063677-0.51730.303334
6-0.017728-0.1440.442962
7-0.02459-0.19980.421137
80.0150240.12210.451614
90.0745830.60590.273325
10-0.069548-0.5650.286991
11-0.046818-0.38030.352454
120.1861041.51190.067664
13-0.160624-1.30490.098227
140.0265280.21550.415014
150.1044070.84820.199693
16-0.16107-1.30850.097615
170.1450911.17870.12137
18-0.128848-1.04680.149513
190.1005190.81660.208541
20-0.154648-1.25640.106705
210.173981.41340.081116
22-0.0959-0.77910.219355
23-0.062954-0.51140.305376
240.1241131.00830.158497
250.0064730.05260.479109
26-0.081965-0.66590.253902
270.0957170.77760.21979
28-0.021152-0.17180.432043
29-0.025402-0.20640.418569
300.0276920.2250.411347
31-0.073112-0.5940.277283
320.0311380.2530.400542
330.0350870.28510.388249
340.0242010.19660.422367
35-0.164625-1.33740.092839
360.1715211.39340.08408


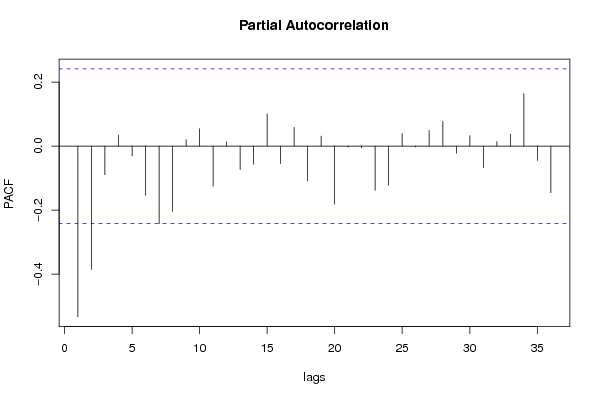
Partial Autocorrelation Function
Time lag kPACF(k)T-STATP-value
1-0.533196-4.33172.6e-05
2-0.385462-3.13150.001296
3-0.089246-0.7250.235496
40.0341420.27740.39118
5-0.030524-0.2480.402461
6-0.153964-1.25080.10771
7-0.242605-1.97090.026464
8-0.20395-1.65690.051144
90.0198070.16090.436328
100.0542270.44050.330492
11-0.125439-1.01910.155945
120.0131020.10640.457776
13-0.073028-0.59330.277509
14-0.056588-0.45970.323612
150.1011390.82170.207115
16-0.054131-0.43980.330774
170.058210.47290.318923
18-0.108909-0.88480.189743
190.0312490.25390.400194
20-0.181037-1.47070.073055
21-0.003053-0.02480.490143
22-0.006125-0.04980.480233
23-0.138224-1.12290.132766
24-0.122711-0.99690.161225
250.0394820.32080.374706
26-0.002566-0.02080.491716
270.0486960.39560.346836
280.0771390.62670.266516
29-0.022615-0.18370.427396
300.032660.26530.395792
31-0.066543-0.54060.295303
320.014380.11680.453677
330.0368730.29960.382727
340.163911.33160.093785
35-0.044918-0.36490.35817
36-0.145543-1.18240.120645

\begin{tabular}{lllllllll}
\hline
Partial Autocorrelation Function \tabularnewline
Time lag k & PACF(k) & T-STAT & P-value \tabularnewline
1 & -0.533196 & -4.3317 & 2.6e-05 \tabularnewline
2 & -0.385462 & -3.1315 & 0.001296 \tabularnewline
3 & -0.089246 & -0.725 & 0.235496 \tabularnewline
4 & 0.034142 & 0.2774 & 0.39118 \tabularnewline
5 & -0.030524 & -0.248 & 0.402461 \tabularnewline
6 & -0.153964 & -1.2508 & 0.10771 \tabularnewline
7 & -0.242605 & -1.9709 & 0.026464 \tabularnewline
8 & -0.20395 & -1.6569 & 0.051144 \tabularnewline
9 & 0.019807 & 0.1609 & 0.436328 \tabularnewline
10 & 0.054227 & 0.4405 & 0.330492 \tabularnewline
11 & -0.125439 & -1.0191 & 0.155945 \tabularnewline
12 & 0.013102 & 0.1064 & 0.457776 \tabularnewline
13 & -0.073028 & -0.5933 & 0.277509 \tabularnewline
14 & -0.056588 & -0.4597 & 0.323612 \tabularnewline
15 & 0.101139 & 0.8217 & 0.207115 \tabularnewline
16 & -0.054131 & -0.4398 & 0.330774 \tabularnewline
17 & 0.05821 & 0.4729 & 0.318923 \tabularnewline
18 & -0.108909 & -0.8848 & 0.189743 \tabularnewline
19 & 0.031249 & 0.2539 & 0.400194 \tabularnewline
20 & -0.181037 & -1.4707 & 0.073055 \tabularnewline
21 & -0.003053 & -0.0248 & 0.490143 \tabularnewline
22 & -0.006125 & -0.0498 & 0.480233 \tabularnewline
23 & -0.138224 & -1.1229 & 0.132766 \tabularnewline
24 & -0.122711 & -0.9969 & 0.161225 \tabularnewline
25 & 0.039482 & 0.3208 & 0.374706 \tabularnewline
26 & -0.002566 & -0.0208 & 0.491716 \tabularnewline
27 & 0.048696 & 0.3956 & 0.346836 \tabularnewline
28 & 0.077139 & 0.6267 & 0.266516 \tabularnewline
29 & -0.022615 & -0.1837 & 0.427396 \tabularnewline
30 & 0.03266 & 0.2653 & 0.395792 \tabularnewline
31 & -0.066543 & -0.5406 & 0.295303 \tabularnewline
32 & 0.01438 & 0.1168 & 0.453677 \tabularnewline
33 & 0.036873 & 0.2996 & 0.382727 \tabularnewline
34 & 0.16391 & 1.3316 & 0.093785 \tabularnewline
35 & -0.044918 & -0.3649 & 0.35817 \tabularnewline
36 & -0.145543 & -1.1824 & 0.120645 \tabularnewline
\hline
\end{tabular}
%Source: https://freestatistics.org/blog/index.php?pk=65142&T=2

[TABLE]
[ROW][C]Partial Autocorrelation Function[/C][/ROW]
[ROW][C]Time lag k[/C][C]PACF(k)[/C][C]T-STAT[/C][C]P-value[/C][/ROW]
[ROW][C]1[/C][C]-0.533196[/C][C]-4.3317[/C][C]2.6e-05[/C][/ROW]
[ROW][C]2[/C][C]-0.385462[/C][C]-3.1315[/C][C]0.001296[/C][/ROW]
[ROW][C]3[/C][C]-0.089246[/C][C]-0.725[/C][C]0.235496[/C][/ROW]
[ROW][C]4[/C][C]0.034142[/C][C]0.2774[/C][C]0.39118[/C][/ROW]
[ROW][C]5[/C][C]-0.030524[/C][C]-0.248[/C][C]0.402461[/C][/ROW]
[ROW][C]6[/C][C]-0.153964[/C][C]-1.2508[/C][C]0.10771[/C][/ROW]
[ROW][C]7[/C][C]-0.242605[/C][C]-1.9709[/C][C]0.026464[/C][/ROW]
[ROW][C]8[/C][C]-0.20395[/C][C]-1.6569[/C][C]0.051144[/C][/ROW]
[ROW][C]9[/C][C]0.019807[/C][C]0.1609[/C][C]0.436328[/C][/ROW]
[ROW][C]10[/C][C]0.054227[/C][C]0.4405[/C][C]0.330492[/C][/ROW]
[ROW][C]11[/C][C]-0.125439[/C][C]-1.0191[/C][C]0.155945[/C][/ROW]
[ROW][C]12[/C][C]0.013102[/C][C]0.1064[/C][C]0.457776[/C][/ROW]
[ROW][C]13[/C][C]-0.073028[/C][C]-0.5933[/C][C]0.277509[/C][/ROW]
[ROW][C]14[/C][C]-0.056588[/C][C]-0.4597[/C][C]0.323612[/C][/ROW]
[ROW][C]15[/C][C]0.101139[/C][C]0.8217[/C][C]0.207115[/C][/ROW]
[ROW][C]16[/C][C]-0.054131[/C][C]-0.4398[/C][C]0.330774[/C][/ROW]
[ROW][C]17[/C][C]0.05821[/C][C]0.4729[/C][C]0.318923[/C][/ROW]
[ROW][C]18[/C][C]-0.108909[/C][C]-0.8848[/C][C]0.189743[/C][/ROW]
[ROW][C]19[/C][C]0.031249[/C][C]0.2539[/C][C]0.400194[/C][/ROW]
[ROW][C]20[/C][C]-0.181037[/C][C]-1.4707[/C][C]0.073055[/C][/ROW]
[ROW][C]21[/C][C]-0.003053[/C][C]-0.0248[/C][C]0.490143[/C][/ROW]
[ROW][C]22[/C][C]-0.006125[/C][C]-0.0498[/C][C]0.480233[/C][/ROW]
[ROW][C]23[/C][C]-0.138224[/C][C]-1.1229[/C][C]0.132766[/C][/ROW]
[ROW][C]24[/C][C]-0.122711[/C][C]-0.9969[/C][C]0.161225[/C][/ROW]
[ROW][C]25[/C][C]0.039482[/C][C]0.3208[/C][C]0.374706[/C][/ROW]
[ROW][C]26[/C][C]-0.002566[/C][C]-0.0208[/C][C]0.491716[/C][/ROW]
[ROW][C]27[/C][C]0.048696[/C][C]0.3956[/C][C]0.346836[/C][/ROW]
[ROW][C]28[/C][C]0.077139[/C][C]0.6267[/C][C]0.266516[/C][/ROW]
[ROW][C]29[/C][C]-0.022615[/C][C]-0.1837[/C][C]0.427396[/C][/ROW]
[ROW][C]30[/C][C]0.03266[/C][C]0.2653[/C][C]0.395792[/C][/ROW]
[ROW][C]31[/C][C]-0.066543[/C][C]-0.5406[/C][C]0.295303[/C][/ROW]
[ROW][C]32[/C][C]0.01438[/C][C]0.1168[/C][C]0.453677[/C][/ROW]
[ROW][C]33[/C][C]0.036873[/C][C]0.2996[/C][C]0.382727[/C][/ROW]
[ROW][C]34[/C][C]0.16391[/C][C]1.3316[/C][C]0.093785[/C][/ROW]
[ROW][C]35[/C][C]-0.044918[/C][C]-0.3649[/C][C]0.35817[/C][/ROW]
[ROW][C]36[/C][C]-0.145543[/C][C]-1.1824[/C][C]0.120645[/C][/ROW]
[/TABLE]
Source: https://freestatistics.org/blog/index.php?pk=65142&T=2

Globally Unique Identifier (entire table): ba.freestatistics.org/blog/index.php?pk=65142&T=2

As an alternative you can also use a QR Code:  

The GUIDs for individual cells are displayed in the table below:

Partial Autocorrelation Function
Time lag kPACF(k)T-STATP-value
1-0.533196-4.33172.6e-05
2-0.385462-3.13150.001296
3-0.089246-0.7250.235496
40.0341420.27740.39118
5-0.030524-0.2480.402461
6-0.153964-1.25080.10771
7-0.242605-1.97090.026464
8-0.20395-1.65690.051144
90.0198070.16090.436328
100.0542270.44050.330492
11-0.125439-1.01910.155945
120.0131020.10640.457776
13-0.073028-0.59330.277509
14-0.056588-0.45970.323612
150.1011390.82170.207115
16-0.054131-0.43980.330774
170.058210.47290.318923
18-0.108909-0.88480.189743
190.0312490.25390.400194
20-0.181037-1.47070.073055
21-0.003053-0.02480.490143
22-0.006125-0.04980.480233
23-0.138224-1.12290.132766
24-0.122711-0.99690.161225
250.0394820.32080.374706
26-0.002566-0.02080.491716
270.0486960.39560.346836
280.0771390.62670.266516
29-0.022615-0.18370.427396
300.032660.26530.395792
31-0.066543-0.54060.295303
320.014380.11680.453677
330.0368730.29960.382727
340.163911.33160.093785
35-0.044918-0.36490.35817
36-0.145543-1.18240.120645


Parameters (Session):
par1 = 36 ; par2 = 1 ; par3 = 1 ; par4 = 0 ; par5 = 12 ; par6 = MA ; par7 = 0.95 ;
Parameters (R input):
par1 = 36 ; par2 = 1 ; par3 = 1 ; par4 = 0 ; par5 = 12 ; par6 = MA ; par7 = 0.95 ;
R code (references can be found in the software module):
if (par1 == 'Default') {
par1 = 10*log10(length(x))
} else {
par1 <- as.numeric(par1)
}
par2 <- as.numeric(par2)
par3 <- as.numeric(par3)
par4 <- as.numeric(par4)
par5 <- as.numeric(par5)
if (par6 == 'White Noise') par6 <- 'white' else par6 <- 'ma'
par7 <- as.numeric(par7)
if (par2 == 0) {
x <- log(x)
} else {
x <- (x ^ par2 - 1) / par2
}
if (par3 > 0) x <- diff(x,lag=1,difference=par3)
if (par4 > 0) x <- diff(x,lag=par5,difference=par4)
bitmap(file='pic1.png')
racf <- acf(x, par1, main='Autocorrelation', xlab='time lag', ylab='ACF', ci.type=par6, ci=par7, sub=paste('(lambda=',par2,', d=',par3,', D=',par4,', CI=', par7, ', CI type=',par6,')',sep=''))
dev.off()
bitmap(file='pic2.png')
rpacf <- pacf(x,par1,main='Partial Autocorrelation',xlab='lags',ylab='PACF')
dev.off()
(myacf <- c(racf$acf))
(mypacf <- c(rpacf$acf))
lengthx <- length(x)
sqrtn <- sqrt(lengthx)
load(file='createtable')
a<-table.start()
a<-table.row.start(a)
a<-table.element(a,'Autocorrelation Function',4,TRUE)
a<-table.row.end(a)
a<-table.row.start(a)
a<-table.element(a,'Time lag k',header=TRUE)
a<-table.element(a,hyperlink('basics.htm','ACF(k)','click here for more information about the Autocorrelation Function'),header=TRUE)
a<-table.element(a,'T-STAT',header=TRUE)
a<-table.element(a,'P-value',header=TRUE)
a<-table.row.end(a)
for (i in 2:(par1+1)) {
a<-table.row.start(a)
a<-table.element(a,i-1,header=TRUE)
a<-table.element(a,round(myacf[i],6))
mytstat <- myacf[i]*sqrtn
a<-table.element(a,round(mytstat,4))
a<-table.element(a,round(1-pt(abs(mytstat),lengthx),6))
a<-table.row.end(a)
}
a<-table.end(a)
table.save(a,file='mytable.tab')
a<-table.start()
a<-table.row.start(a)
a<-table.element(a,'Partial Autocorrelation Function',4,TRUE)
a<-table.row.end(a)
a<-table.row.start(a)
a<-table.element(a,'Time lag k',header=TRUE)
a<-table.element(a,hyperlink('basics.htm','PACF(k)','click here for more information about the Partial Autocorrelation Function'),header=TRUE)
a<-table.element(a,'T-STAT',header=TRUE)
a<-table.element(a,'P-value',header=TRUE)
a<-table.row.end(a)
for (i in 1:par1) {
a<-table.row.start(a)
a<-table.element(a,i,header=TRUE)
a<-table.element(a,round(mypacf[i],6))
mytstat <- mypacf[i]*sqrtn
a<-table.element(a,round(mytstat,4))
a<-table.element(a,round(1-pt(abs(mytstat),lengthx),6))
a<-table.row.end(a)
}
a<-table.end(a)
table.save(a,file='mytable1.tab')