Free Statistics

of Irreproducible Research!

Author's title

Author*The author of this computation has been verified*
R Software Modulerwasp_arimabackwardselection.wasp
Title produced by softwareARIMA Backward Selection
Date of computationWed, 09 Dec 2009 11:56:11 -0700
Cite this page as followsStatistical Computations at FreeStatistics.org, Office for Research Development and Education, URL https://freestatistics.org/blog/index.php?v=date/2009/Dec/09/t12603850455sc3t5y8e9q4815.htm/, Retrieved Mon, 29 Apr 2024 14:36:39 +0000
Statistical Computations at FreeStatistics.org, Office for Research Development and Education, URL https://freestatistics.org/blog/index.php?pk=65145, Retrieved Mon, 29 Apr 2024 14:36:39 +0000
QR Codes:

Original text written by user:
IsPrivate?No (this computation is public)
User-defined keywords
Estimated Impact90
Family? (F = Feedback message, R = changed R code, M = changed R Module, P = changed Parameters, D = changed Data)
-     [Univariate Data Series] [data set] [2008-12-01 19:54:57] [b98453cac15ba1066b407e146608df68]
- RMP   [ARIMA Backward Selection] [] [2009-11-27 14:53:14] [b98453cac15ba1066b407e146608df68]
- R PD    [ARIMA Backward Selection] [ws9-5] [2009-12-04 21:12:53] [74be16979710d4c4e7c6647856088456]
-   P         [ARIMA Backward Selection] [WS 9 mendel] [2009-12-09 18:56:11] [dd4f17965cad1d38de7a1c062d32d75d] [Current]
Feedback Forum

Post a new message
Dataseries X:
2360
2214
2825
2355
2333
3016
2155
2172
2150
2533
2058
2160
2260
2498
2695
2799
2947
2930
2318
2540
2570
2669
2450
2842
3440
2678
2981
2260
2844
2546
2456
2295
2379
2479
2057
2280
2351
2276
2548
2311
2201
2725
2408
2139
1898
2537
2069
2063
2524
2437
2189
2793
2074
2622
2278
2144
2427
2139
1828
2072
1800
1758
2246
1987
1868
2514
2121


Summary of computational transaction
Raw Inputview raw input (R code)
Raw Outputview raw output of R engine
Computing time11 seconds
R Server'Gwilym Jenkins' @ 72.249.127.135

\begin{tabular}{lllllllll}
\hline
Summary of computational transaction \tabularnewline
Raw Input & view raw input (R code)  \tabularnewline
Raw Output & view raw output of R engine  \tabularnewline
Computing time & 11 seconds \tabularnewline
R Server & 'Gwilym Jenkins' @ 72.249.127.135 \tabularnewline
\hline
\end{tabular}
%Source: https://freestatistics.org/blog/index.php?pk=65145&T=0

[TABLE]
[ROW][C]Summary of computational transaction[/C][/ROW]
[ROW][C]Raw Input[/C][C]view raw input (R code) [/C][/ROW]
[ROW][C]Raw Output[/C][C]view raw output of R engine [/C][/ROW]
[ROW][C]Computing time[/C][C]11 seconds[/C][/ROW]
[ROW][C]R Server[/C][C]'Gwilym Jenkins' @ 72.249.127.135[/C][/ROW]
[/TABLE]
Source: https://freestatistics.org/blog/index.php?pk=65145&T=0

Globally Unique Identifier (entire table): ba.freestatistics.org/blog/index.php?pk=65145&T=0

As an alternative you can also use a QR Code:  

The GUIDs for individual cells are displayed in the table below:

Summary of computational transaction
Raw Inputview raw input (R code)
Raw Outputview raw output of R engine
Computing time11 seconds
R Server'Gwilym Jenkins' @ 72.249.127.135


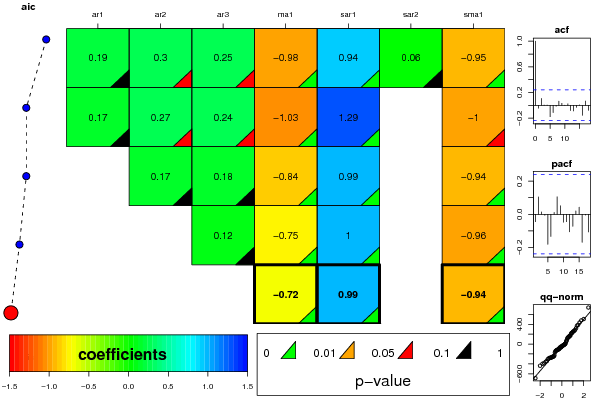
ARIMA Parameter Estimation and Backward Selection
Iterationar1ar2ar3ma1sar1sar2sma1
Estimates ( 1 )0.19420.29940.2483-0.98460.93850.0586-0.9527
(p-val)(0.1965 )(0.0554 )(0.0813 )(0 )(0 )(0.7128 )(2e-04 )
Estimates ( 2 )0.17280.26670.2411-1.0351.28860-0.9998
(p-val)(0.2255 )(0.0604 )(0.0821 )(0 )(0 )(NA )(0.0744 )
Estimates ( 3 )00.17250.1766-0.84430.99350-0.9366
(p-val)(NA )(0.3116 )(0.2572 )(0 )(0 )(NA )(0 )
Estimates ( 4 )000.1185-0.74840.99750-0.9603
(p-val)(NA )(NA )(0.389 )(0 )(0 )(NA )(0 )
Estimates ( 5 )000-0.71630.9940-0.9356
(p-val)(NA )(NA )(NA )(0 )(0 )(NA )(0 )
Estimates ( 6 )NANANANANANANA
(p-val)(NA )(NA )(NA )(NA )(NA )(NA )(NA )
Estimates ( 7 )NANANANANANANA
(p-val)(NA )(NA )(NA )(NA )(NA )(NA )(NA )
Estimates ( 8 )NANANANANANANA
(p-val)(NA )(NA )(NA )(NA )(NA )(NA )(NA )
Estimates ( 9 )NANANANANANANA
(p-val)(NA )(NA )(NA )(NA )(NA )(NA )(NA )
Estimates ( 10 )NANANANANANANA
(p-val)(NA )(NA )(NA )(NA )(NA )(NA )(NA )
Estimates ( 11 )NANANANANANANA
(p-val)(NA )(NA )(NA )(NA )(NA )(NA )(NA )
Estimates ( 12 )NANANANANANANA
(p-val)(NA )(NA )(NA )(NA )(NA )(NA )(NA )
Estimates ( 13 )NANANANANANANA
(p-val)(NA )(NA )(NA )(NA )(NA )(NA )(NA )

\begin{tabular}{lllllllll}
\hline
ARIMA Parameter Estimation and Backward Selection \tabularnewline
Iteration & ar1 & ar2 & ar3 & ma1 & sar1 & sar2 & sma1 \tabularnewline
Estimates ( 1 ) & 0.1942 & 0.2994 & 0.2483 & -0.9846 & 0.9385 & 0.0586 & -0.9527 \tabularnewline
(p-val) & (0.1965 ) & (0.0554 ) & (0.0813 ) & (0 ) & (0 ) & (0.7128 ) & (2e-04 ) \tabularnewline
Estimates ( 2 ) & 0.1728 & 0.2667 & 0.2411 & -1.035 & 1.2886 & 0 & -0.9998 \tabularnewline
(p-val) & (0.2255 ) & (0.0604 ) & (0.0821 ) & (0 ) & (0 ) & (NA ) & (0.0744 ) \tabularnewline
Estimates ( 3 ) & 0 & 0.1725 & 0.1766 & -0.8443 & 0.9935 & 0 & -0.9366 \tabularnewline
(p-val) & (NA ) & (0.3116 ) & (0.2572 ) & (0 ) & (0 ) & (NA ) & (0 ) \tabularnewline
Estimates ( 4 ) & 0 & 0 & 0.1185 & -0.7484 & 0.9975 & 0 & -0.9603 \tabularnewline
(p-val) & (NA ) & (NA ) & (0.389 ) & (0 ) & (0 ) & (NA ) & (0 ) \tabularnewline
Estimates ( 5 ) & 0 & 0 & 0 & -0.7163 & 0.994 & 0 & -0.9356 \tabularnewline
(p-val) & (NA ) & (NA ) & (NA ) & (0 ) & (0 ) & (NA ) & (0 ) \tabularnewline
Estimates ( 6 ) & NA & NA & NA & NA & NA & NA & NA \tabularnewline
(p-val) & (NA ) & (NA ) & (NA ) & (NA ) & (NA ) & (NA ) & (NA ) \tabularnewline
Estimates ( 7 ) & NA & NA & NA & NA & NA & NA & NA \tabularnewline
(p-val) & (NA ) & (NA ) & (NA ) & (NA ) & (NA ) & (NA ) & (NA ) \tabularnewline
Estimates ( 8 ) & NA & NA & NA & NA & NA & NA & NA \tabularnewline
(p-val) & (NA ) & (NA ) & (NA ) & (NA ) & (NA ) & (NA ) & (NA ) \tabularnewline
Estimates ( 9 ) & NA & NA & NA & NA & NA & NA & NA \tabularnewline
(p-val) & (NA ) & (NA ) & (NA ) & (NA ) & (NA ) & (NA ) & (NA ) \tabularnewline
Estimates ( 10 ) & NA & NA & NA & NA & NA & NA & NA \tabularnewline
(p-val) & (NA ) & (NA ) & (NA ) & (NA ) & (NA ) & (NA ) & (NA ) \tabularnewline
Estimates ( 11 ) & NA & NA & NA & NA & NA & NA & NA \tabularnewline
(p-val) & (NA ) & (NA ) & (NA ) & (NA ) & (NA ) & (NA ) & (NA ) \tabularnewline
Estimates ( 12 ) & NA & NA & NA & NA & NA & NA & NA \tabularnewline
(p-val) & (NA ) & (NA ) & (NA ) & (NA ) & (NA ) & (NA ) & (NA ) \tabularnewline
Estimates ( 13 ) & NA & NA & NA & NA & NA & NA & NA \tabularnewline
(p-val) & (NA ) & (NA ) & (NA ) & (NA ) & (NA ) & (NA ) & (NA ) \tabularnewline
\hline
\end{tabular}
%Source: https://freestatistics.org/blog/index.php?pk=65145&T=1

[TABLE]
[ROW][C]ARIMA Parameter Estimation and Backward Selection[/C][/ROW]
[ROW][C]Iteration[/C][C]ar1[/C][C]ar2[/C][C]ar3[/C][C]ma1[/C][C]sar1[/C][C]sar2[/C][C]sma1[/C][/ROW]
[ROW][C]Estimates ( 1 )[/C][C]0.1942[/C][C]0.2994[/C][C]0.2483[/C][C]-0.9846[/C][C]0.9385[/C][C]0.0586[/C][C]-0.9527[/C][/ROW]
[ROW][C](p-val)[/C][C](0.1965 )[/C][C](0.0554 )[/C][C](0.0813 )[/C][C](0 )[/C][C](0 )[/C][C](0.7128 )[/C][C](2e-04 )[/C][/ROW]
[ROW][C]Estimates ( 2 )[/C][C]0.1728[/C][C]0.2667[/C][C]0.2411[/C][C]-1.035[/C][C]1.2886[/C][C]0[/C][C]-0.9998[/C][/ROW]
[ROW][C](p-val)[/C][C](0.2255 )[/C][C](0.0604 )[/C][C](0.0821 )[/C][C](0 )[/C][C](0 )[/C][C](NA )[/C][C](0.0744 )[/C][/ROW]
[ROW][C]Estimates ( 3 )[/C][C]0[/C][C]0.1725[/C][C]0.1766[/C][C]-0.8443[/C][C]0.9935[/C][C]0[/C][C]-0.9366[/C][/ROW]
[ROW][C](p-val)[/C][C](NA )[/C][C](0.3116 )[/C][C](0.2572 )[/C][C](0 )[/C][C](0 )[/C][C](NA )[/C][C](0 )[/C][/ROW]
[ROW][C]Estimates ( 4 )[/C][C]0[/C][C]0[/C][C]0.1185[/C][C]-0.7484[/C][C]0.9975[/C][C]0[/C][C]-0.9603[/C][/ROW]
[ROW][C](p-val)[/C][C](NA )[/C][C](NA )[/C][C](0.389 )[/C][C](0 )[/C][C](0 )[/C][C](NA )[/C][C](0 )[/C][/ROW]
[ROW][C]Estimates ( 5 )[/C][C]0[/C][C]0[/C][C]0[/C][C]-0.7163[/C][C]0.994[/C][C]0[/C][C]-0.9356[/C][/ROW]
[ROW][C](p-val)[/C][C](NA )[/C][C](NA )[/C][C](NA )[/C][C](0 )[/C][C](0 )[/C][C](NA )[/C][C](0 )[/C][/ROW]
[ROW][C]Estimates ( 6 )[/C][C]NA[/C][C]NA[/C][C]NA[/C][C]NA[/C][C]NA[/C][C]NA[/C][C]NA[/C][/ROW]
[ROW][C](p-val)[/C][C](NA )[/C][C](NA )[/C][C](NA )[/C][C](NA )[/C][C](NA )[/C][C](NA )[/C][C](NA )[/C][/ROW]
[ROW][C]Estimates ( 7 )[/C][C]NA[/C][C]NA[/C][C]NA[/C][C]NA[/C][C]NA[/C][C]NA[/C][C]NA[/C][/ROW]
[ROW][C](p-val)[/C][C](NA )[/C][C](NA )[/C][C](NA )[/C][C](NA )[/C][C](NA )[/C][C](NA )[/C][C](NA )[/C][/ROW]
[ROW][C]Estimates ( 8 )[/C][C]NA[/C][C]NA[/C][C]NA[/C][C]NA[/C][C]NA[/C][C]NA[/C][C]NA[/C][/ROW]
[ROW][C](p-val)[/C][C](NA )[/C][C](NA )[/C][C](NA )[/C][C](NA )[/C][C](NA )[/C][C](NA )[/C][C](NA )[/C][/ROW]
[ROW][C]Estimates ( 9 )[/C][C]NA[/C][C]NA[/C][C]NA[/C][C]NA[/C][C]NA[/C][C]NA[/C][C]NA[/C][/ROW]
[ROW][C](p-val)[/C][C](NA )[/C][C](NA )[/C][C](NA )[/C][C](NA )[/C][C](NA )[/C][C](NA )[/C][C](NA )[/C][/ROW]
[ROW][C]Estimates ( 10 )[/C][C]NA[/C][C]NA[/C][C]NA[/C][C]NA[/C][C]NA[/C][C]NA[/C][C]NA[/C][/ROW]
[ROW][C](p-val)[/C][C](NA )[/C][C](NA )[/C][C](NA )[/C][C](NA )[/C][C](NA )[/C][C](NA )[/C][C](NA )[/C][/ROW]
[ROW][C]Estimates ( 11 )[/C][C]NA[/C][C]NA[/C][C]NA[/C][C]NA[/C][C]NA[/C][C]NA[/C][C]NA[/C][/ROW]
[ROW][C](p-val)[/C][C](NA )[/C][C](NA )[/C][C](NA )[/C][C](NA )[/C][C](NA )[/C][C](NA )[/C][C](NA )[/C][/ROW]
[ROW][C]Estimates ( 12 )[/C][C]NA[/C][C]NA[/C][C]NA[/C][C]NA[/C][C]NA[/C][C]NA[/C][C]NA[/C][/ROW]
[ROW][C](p-val)[/C][C](NA )[/C][C](NA )[/C][C](NA )[/C][C](NA )[/C][C](NA )[/C][C](NA )[/C][C](NA )[/C][/ROW]
[ROW][C]Estimates ( 13 )[/C][C]NA[/C][C]NA[/C][C]NA[/C][C]NA[/C][C]NA[/C][C]NA[/C][C]NA[/C][/ROW]
[ROW][C](p-val)[/C][C](NA )[/C][C](NA )[/C][C](NA )[/C][C](NA )[/C][C](NA )[/C][C](NA )[/C][C](NA )[/C][/ROW]
[/TABLE]
Source: https://freestatistics.org/blog/index.php?pk=65145&T=1

Globally Unique Identifier (entire table): ba.freestatistics.org/blog/index.php?pk=65145&T=1

As an alternative you can also use a QR Code:  

The GUIDs for individual cells are displayed in the table below:

ARIMA Parameter Estimation and Backward Selection
Iterationar1ar2ar3ma1sar1sar2sma1
Estimates ( 1 )0.19420.29940.2483-0.98460.93850.0586-0.9527
(p-val)(0.1965 )(0.0554 )(0.0813 )(0 )(0 )(0.7128 )(2e-04 )
Estimates ( 2 )0.17280.26670.2411-1.0351.28860-0.9998
(p-val)(0.2255 )(0.0604 )(0.0821 )(0 )(0 )(NA )(0.0744 )
Estimates ( 3 )00.17250.1766-0.84430.99350-0.9366
(p-val)(NA )(0.3116 )(0.2572 )(0 )(0 )(NA )(0 )
Estimates ( 4 )000.1185-0.74840.99750-0.9603
(p-val)(NA )(NA )(0.389 )(0 )(0 )(NA )(0 )
Estimates ( 5 )000-0.71630.9940-0.9356
(p-val)(NA )(NA )(NA )(0 )(0 )(NA )(0 )
Estimates ( 6 )NANANANANANANA
(p-val)(NA )(NA )(NA )(NA )(NA )(NA )(NA )
Estimates ( 7 )NANANANANANANA
(p-val)(NA )(NA )(NA )(NA )(NA )(NA )(NA )
Estimates ( 8 )NANANANANANANA
(p-val)(NA )(NA )(NA )(NA )(NA )(NA )(NA )
Estimates ( 9 )NANANANANANANA
(p-val)(NA )(NA )(NA )(NA )(NA )(NA )(NA )
Estimates ( 10 )NANANANANANANA
(p-val)(NA )(NA )(NA )(NA )(NA )(NA )(NA )
Estimates ( 11 )NANANANANANANA
(p-val)(NA )(NA )(NA )(NA )(NA )(NA )(NA )
Estimates ( 12 )NANANANANANANA
(p-val)(NA )(NA )(NA )(NA )(NA )(NA )(NA )
Estimates ( 13 )NANANANANANANA
(p-val)(NA )(NA )(NA )(NA )(NA )(NA )(NA )


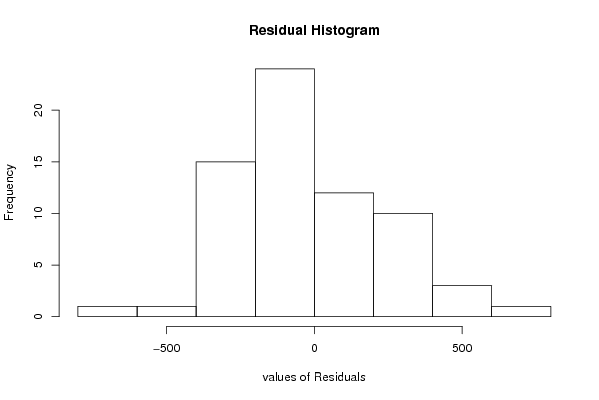
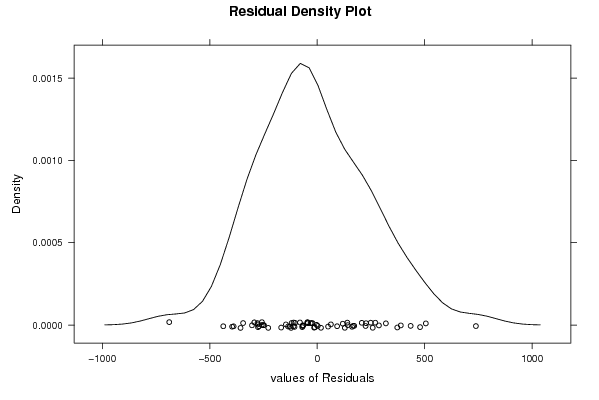
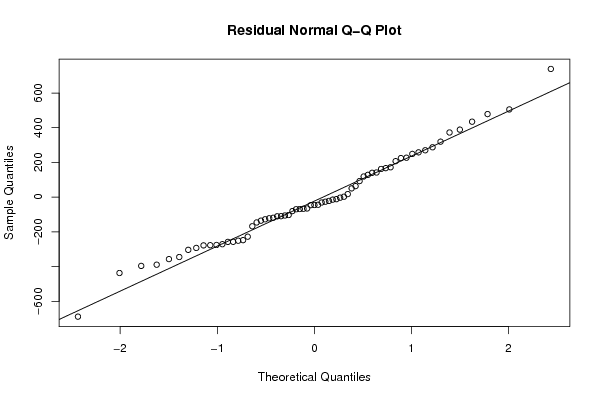
Estimated ARIMA Residuals
Value
2.35999762703014
-102.953413107638
434.762735637688
-105.69450052968
-80.3127263736128
478.685306168552
-356.865320772084
-247.749489379575
-277.865213928461
225.148550312184
-251.163905163229
-110.442922984887
-11.6917995190954
287.270530130985
249.083039965015
372.631954941768
388.989435488883
118.930905487092
-303.674092123892
-44.1376475572617
17.6081990422433
63.5161143827358
-67.1111577429642
270.160474009718
738.644296450201
-167.755638899967
-26.4199711392063
-688.591821835653
92.5874489092449
-345.027998130228
-3.09052192232945
-257.413681889713
-69.6969862374071
-65.1589181691357
-292.676410931825
-118.952438837744
-127.51379379645
-30.8958435298273
50.5730603440914
-14.3464571562641
-227.869052336806
258.187034193416
140.168511812747
-135.567452484576
-396.162817484801
227.130989715825
-68.4422041237749
-145.825018361764
167.102398472714
172.216341473257
-276.902834612537
505.457877256947
-389.237780401336
162.335304493584
-45.8402943802613
-45.3031147837439
207.336642898410
-271.075552868674
-275.560262147078
-109.609820565844
-437.132079223325
-257.875903183819
128.412464134691
-21.6896411409332
-121.797754537884
319.595244343519
142.114284326532

\begin{tabular}{lllllllll}
\hline
Estimated ARIMA Residuals \tabularnewline
Value \tabularnewline
2.35999762703014 \tabularnewline
-102.953413107638 \tabularnewline
434.762735637688 \tabularnewline
-105.69450052968 \tabularnewline
-80.3127263736128 \tabularnewline
478.685306168552 \tabularnewline
-356.865320772084 \tabularnewline
-247.749489379575 \tabularnewline
-277.865213928461 \tabularnewline
225.148550312184 \tabularnewline
-251.163905163229 \tabularnewline
-110.442922984887 \tabularnewline
-11.6917995190954 \tabularnewline
287.270530130985 \tabularnewline
249.083039965015 \tabularnewline
372.631954941768 \tabularnewline
388.989435488883 \tabularnewline
118.930905487092 \tabularnewline
-303.674092123892 \tabularnewline
-44.1376475572617 \tabularnewline
17.6081990422433 \tabularnewline
63.5161143827358 \tabularnewline
-67.1111577429642 \tabularnewline
270.160474009718 \tabularnewline
738.644296450201 \tabularnewline
-167.755638899967 \tabularnewline
-26.4199711392063 \tabularnewline
-688.591821835653 \tabularnewline
92.5874489092449 \tabularnewline
-345.027998130228 \tabularnewline
-3.09052192232945 \tabularnewline
-257.413681889713 \tabularnewline
-69.6969862374071 \tabularnewline
-65.1589181691357 \tabularnewline
-292.676410931825 \tabularnewline
-118.952438837744 \tabularnewline
-127.51379379645 \tabularnewline
-30.8958435298273 \tabularnewline
50.5730603440914 \tabularnewline
-14.3464571562641 \tabularnewline
-227.869052336806 \tabularnewline
258.187034193416 \tabularnewline
140.168511812747 \tabularnewline
-135.567452484576 \tabularnewline
-396.162817484801 \tabularnewline
227.130989715825 \tabularnewline
-68.4422041237749 \tabularnewline
-145.825018361764 \tabularnewline
167.102398472714 \tabularnewline
172.216341473257 \tabularnewline
-276.902834612537 \tabularnewline
505.457877256947 \tabularnewline
-389.237780401336 \tabularnewline
162.335304493584 \tabularnewline
-45.8402943802613 \tabularnewline
-45.3031147837439 \tabularnewline
207.336642898410 \tabularnewline
-271.075552868674 \tabularnewline
-275.560262147078 \tabularnewline
-109.609820565844 \tabularnewline
-437.132079223325 \tabularnewline
-257.875903183819 \tabularnewline
128.412464134691 \tabularnewline
-21.6896411409332 \tabularnewline
-121.797754537884 \tabularnewline
319.595244343519 \tabularnewline
142.114284326532 \tabularnewline
\hline
\end{tabular}
%Source: https://freestatistics.org/blog/index.php?pk=65145&T=2

[TABLE]
[ROW][C]Estimated ARIMA Residuals[/C][/ROW]
[ROW][C]Value[/C][/ROW]
[ROW][C]2.35999762703014[/C][/ROW]
[ROW][C]-102.953413107638[/C][/ROW]
[ROW][C]434.762735637688[/C][/ROW]
[ROW][C]-105.69450052968[/C][/ROW]
[ROW][C]-80.3127263736128[/C][/ROW]
[ROW][C]478.685306168552[/C][/ROW]
[ROW][C]-356.865320772084[/C][/ROW]
[ROW][C]-247.749489379575[/C][/ROW]
[ROW][C]-277.865213928461[/C][/ROW]
[ROW][C]225.148550312184[/C][/ROW]
[ROW][C]-251.163905163229[/C][/ROW]
[ROW][C]-110.442922984887[/C][/ROW]
[ROW][C]-11.6917995190954[/C][/ROW]
[ROW][C]287.270530130985[/C][/ROW]
[ROW][C]249.083039965015[/C][/ROW]
[ROW][C]372.631954941768[/C][/ROW]
[ROW][C]388.989435488883[/C][/ROW]
[ROW][C]118.930905487092[/C][/ROW]
[ROW][C]-303.674092123892[/C][/ROW]
[ROW][C]-44.1376475572617[/C][/ROW]
[ROW][C]17.6081990422433[/C][/ROW]
[ROW][C]63.5161143827358[/C][/ROW]
[ROW][C]-67.1111577429642[/C][/ROW]
[ROW][C]270.160474009718[/C][/ROW]
[ROW][C]738.644296450201[/C][/ROW]
[ROW][C]-167.755638899967[/C][/ROW]
[ROW][C]-26.4199711392063[/C][/ROW]
[ROW][C]-688.591821835653[/C][/ROW]
[ROW][C]92.5874489092449[/C][/ROW]
[ROW][C]-345.027998130228[/C][/ROW]
[ROW][C]-3.09052192232945[/C][/ROW]
[ROW][C]-257.413681889713[/C][/ROW]
[ROW][C]-69.6969862374071[/C][/ROW]
[ROW][C]-65.1589181691357[/C][/ROW]
[ROW][C]-292.676410931825[/C][/ROW]
[ROW][C]-118.952438837744[/C][/ROW]
[ROW][C]-127.51379379645[/C][/ROW]
[ROW][C]-30.8958435298273[/C][/ROW]
[ROW][C]50.5730603440914[/C][/ROW]
[ROW][C]-14.3464571562641[/C][/ROW]
[ROW][C]-227.869052336806[/C][/ROW]
[ROW][C]258.187034193416[/C][/ROW]
[ROW][C]140.168511812747[/C][/ROW]
[ROW][C]-135.567452484576[/C][/ROW]
[ROW][C]-396.162817484801[/C][/ROW]
[ROW][C]227.130989715825[/C][/ROW]
[ROW][C]-68.4422041237749[/C][/ROW]
[ROW][C]-145.825018361764[/C][/ROW]
[ROW][C]167.102398472714[/C][/ROW]
[ROW][C]172.216341473257[/C][/ROW]
[ROW][C]-276.902834612537[/C][/ROW]
[ROW][C]505.457877256947[/C][/ROW]
[ROW][C]-389.237780401336[/C][/ROW]
[ROW][C]162.335304493584[/C][/ROW]
[ROW][C]-45.8402943802613[/C][/ROW]
[ROW][C]-45.3031147837439[/C][/ROW]
[ROW][C]207.336642898410[/C][/ROW]
[ROW][C]-271.075552868674[/C][/ROW]
[ROW][C]-275.560262147078[/C][/ROW]
[ROW][C]-109.609820565844[/C][/ROW]
[ROW][C]-437.132079223325[/C][/ROW]
[ROW][C]-257.875903183819[/C][/ROW]
[ROW][C]128.412464134691[/C][/ROW]
[ROW][C]-21.6896411409332[/C][/ROW]
[ROW][C]-121.797754537884[/C][/ROW]
[ROW][C]319.595244343519[/C][/ROW]
[ROW][C]142.114284326532[/C][/ROW]
[/TABLE]
Source: https://freestatistics.org/blog/index.php?pk=65145&T=2

Globally Unique Identifier (entire table): ba.freestatistics.org/blog/index.php?pk=65145&T=2

As an alternative you can also use a QR Code:  

The GUIDs for individual cells are displayed in the table below:

Estimated ARIMA Residuals
Value
2.35999762703014
-102.953413107638
434.762735637688
-105.69450052968
-80.3127263736128
478.685306168552
-356.865320772084
-247.749489379575
-277.865213928461
225.148550312184
-251.163905163229
-110.442922984887
-11.6917995190954
287.270530130985
249.083039965015
372.631954941768
388.989435488883
118.930905487092
-303.674092123892
-44.1376475572617
17.6081990422433
63.5161143827358
-67.1111577429642
270.160474009718
738.644296450201
-167.755638899967
-26.4199711392063
-688.591821835653
92.5874489092449
-345.027998130228
-3.09052192232945
-257.413681889713
-69.6969862374071
-65.1589181691357
-292.676410931825
-118.952438837744
-127.51379379645
-30.8958435298273
50.5730603440914
-14.3464571562641
-227.869052336806
258.187034193416
140.168511812747
-135.567452484576
-396.162817484801
227.130989715825
-68.4422041237749
-145.825018361764
167.102398472714
172.216341473257
-276.902834612537
505.457877256947
-389.237780401336
162.335304493584
-45.8402943802613
-45.3031147837439
207.336642898410
-271.075552868674
-275.560262147078
-109.609820565844
-437.132079223325
-257.875903183819
128.412464134691
-21.6896411409332
-121.797754537884
319.595244343519
142.114284326532


Parameters (Session):
par1 = FALSE ; par2 = 1 ; par3 = 1 ; par4 = 0 ; par5 = 12 ; par6 = 3 ; par7 = 1 ; par8 = 2 ; par9 = 1 ;
Parameters (R input):
par1 = FALSE ; par2 = 1 ; par3 = 1 ; par4 = 0 ; par5 = 12 ; par6 = 3 ; par7 = 1 ; par8 = 2 ; par9 = 1 ;
R code (references can be found in the software module):
library(lattice)
if (par1 == 'TRUE') par1 <- TRUE
if (par1 == 'FALSE') par1 <- FALSE
par2 <- as.numeric(par2) #Box-Cox lambda transformation parameter
par3 <- as.numeric(par3) #degree of non-seasonal differencing
par4 <- as.numeric(par4) #degree of seasonal differencing
par5 <- as.numeric(par5) #seasonal period
par6 <- as.numeric(par6) #degree (p) of the non-seasonal AR(p) polynomial
par7 <- as.numeric(par7) #degree (q) of the non-seasonal MA(q) polynomial
par8 <- as.numeric(par8) #degree (P) of the seasonal AR(P) polynomial
par9 <- as.numeric(par9) #degree (Q) of the seasonal MA(Q) polynomial
armaGR <- function(arima.out, names, n){
try1 <- arima.out$coef
try2 <- sqrt(diag(arima.out$var.coef))
try.data.frame <- data.frame(matrix(NA,ncol=4,nrow=length(names)))
dimnames(try.data.frame) <- list(names,c('coef','std','tstat','pv'))
try.data.frame[,1] <- try1
for(i in 1:length(try2)) try.data.frame[which(rownames(try.data.frame)==names(try2)[i]),2] <- try2[i]
try.data.frame[,3] <- try.data.frame[,1] / try.data.frame[,2]
try.data.frame[,4] <- round((1-pt(abs(try.data.frame[,3]),df=n-(length(try2)+1)))*2,5)
vector <- rep(NA,length(names))
vector[is.na(try.data.frame[,4])] <- 0
maxi <- which.max(try.data.frame[,4])
continue <- max(try.data.frame[,4],na.rm=TRUE) > .05
vector[maxi] <- 0
list(summary=try.data.frame,next.vector=vector,continue=continue)
}
arimaSelect <- function(series, order=c(13,0,0), seasonal=list(order=c(2,0,0),period=12), include.mean=F){
nrc <- order[1]+order[3]+seasonal$order[1]+seasonal$order[3]
coeff <- matrix(NA, nrow=nrc*2, ncol=nrc)
pval <- matrix(NA, nrow=nrc*2, ncol=nrc)
mylist <- rep(list(NULL), nrc)
names <- NULL
if(order[1] > 0) names <- paste('ar',1:order[1],sep='')
if(order[3] > 0) names <- c( names , paste('ma',1:order[3],sep='') )
if(seasonal$order[1] > 0) names <- c(names, paste('sar',1:seasonal$order[1],sep=''))
if(seasonal$order[3] > 0) names <- c(names, paste('sma',1:seasonal$order[3],sep=''))
arima.out <- arima(series, order=order, seasonal=seasonal, include.mean=include.mean, method='ML')
mylist[[1]] <- arima.out
last.arma <- armaGR(arima.out, names, length(series))
mystop <- FALSE
i <- 1
coeff[i,] <- last.arma[[1]][,1]
pval [i,] <- last.arma[[1]][,4]
i <- 2
aic <- arima.out$aic
while(!mystop){
mylist[[i]] <- arima.out
arima.out <- arima(series, order=order, seasonal=seasonal, include.mean=include.mean, method='ML', fixed=last.arma$next.vector)
aic <- c(aic, arima.out$aic)
last.arma <- armaGR(arima.out, names, length(series))
mystop <- !last.arma$continue
coeff[i,] <- last.arma[[1]][,1]
pval [i,] <- last.arma[[1]][,4]
i <- i+1
}
list(coeff, pval, mylist, aic=aic)
}
arimaSelectplot <- function(arimaSelect.out,noms,choix){
noms <- names(arimaSelect.out[[3]][[1]]$coef)
coeff <- arimaSelect.out[[1]]
k <- min(which(is.na(coeff[,1])))-1
coeff <- coeff[1:k,]
pval <- arimaSelect.out[[2]][1:k,]
aic <- arimaSelect.out$aic[1:k]
coeff[coeff==0] <- NA
n <- ncol(coeff)
if(missing(choix)) choix <- k
layout(matrix(c(1,1,1,2,
3,3,3,2,
3,3,3,4,
5,6,7,7),nr=4),
widths=c(10,35,45,15),
heights=c(30,30,15,15))
couleurs <- rainbow(75)[1:50]#(50)
ticks <- pretty(coeff)
par(mar=c(1,1,3,1))
plot(aic,k:1-.5,type='o',pch=21,bg='blue',cex=2,axes=F,lty=2,xpd=NA)
points(aic[choix],k-choix+.5,pch=21,cex=4,bg=2,xpd=NA)
title('aic',line=2)
par(mar=c(3,0,0,0))
plot(0,axes=F,xlab='',ylab='',xlim=range(ticks),ylim=c(.1,1))
rect(xleft = min(ticks) + (0:49)/50*(max(ticks)-min(ticks)),
xright = min(ticks) + (1:50)/50*(max(ticks)-min(ticks)),
ytop = rep(1,50),
ybottom= rep(0,50),col=couleurs,border=NA)
axis(1,ticks)
rect(xleft=min(ticks),xright=max(ticks),ytop=1,ybottom=0)
text(mean(coeff,na.rm=T),.5,'coefficients',cex=2,font=2)
par(mar=c(1,1,3,1))
image(1:n,1:k,t(coeff[k:1,]),axes=F,col=couleurs,zlim=range(ticks))
for(i in 1:n) for(j in 1:k) if(!is.na(coeff[j,i])) {
if(pval[j,i]<.01) symb = 'green'
else if( (pval[j,i]<.05) & (pval[j,i]>=.01)) symb = 'orange'
else if( (pval[j,i]<.1) & (pval[j,i]>=.05)) symb = 'red'
else symb = 'black'
polygon(c(i+.5 ,i+.2 ,i+.5 ,i+.5),
c(k-j+0.5,k-j+0.5,k-j+0.8,k-j+0.5),
col=symb)
if(j==choix) {
rect(xleft=i-.5,
xright=i+.5,
ybottom=k-j+1.5,
ytop=k-j+.5,
lwd=4)
text(i,
k-j+1,
round(coeff[j,i],2),
cex=1.2,
font=2)
}
else{
rect(xleft=i-.5,xright=i+.5,ybottom=k-j+1.5,ytop=k-j+.5)
text(i,k-j+1,round(coeff[j,i],2),cex=1.2,font=1)
}
}
axis(3,1:n,noms)
par(mar=c(0.5,0,0,0.5))
plot(0,axes=F,xlab='',ylab='',type='n',xlim=c(0,8),ylim=c(-.2,.8))
cols <- c('green','orange','red','black')
niv <- c('0','0.01','0.05','0.1')
for(i in 0:3){
polygon(c(1+2*i ,1+2*i ,1+2*i-.5 ,1+2*i),
c(.4 ,.7 , .4 , .4),
col=cols[i+1])
text(2*i,0.5,niv[i+1],cex=1.5)
}
text(8,.5,1,cex=1.5)
text(4,0,'p-value',cex=2)
box()
residus <- arimaSelect.out[[3]][[choix]]$res
par(mar=c(1,2,4,1))
acf(residus,main='')
title('acf',line=.5)
par(mar=c(1,2,4,1))
pacf(residus,main='')
title('pacf',line=.5)
par(mar=c(2,2,4,1))
qqnorm(residus,main='')
title('qq-norm',line=.5)
qqline(residus)
residus
}
if (par2 == 0) x <- log(x)
if (par2 != 0) x <- x^par2
(selection <- arimaSelect(x, order=c(par6,par3,par7), seasonal=list(order=c(par8,par4,par9), period=par5)))
bitmap(file='test1.png')
resid <- arimaSelectplot(selection)
dev.off()
resid
bitmap(file='test2.png')
acf(resid,length(resid)/2, main='Residual Autocorrelation Function')
dev.off()
bitmap(file='test3.png')
pacf(resid,length(resid)/2, main='Residual Partial Autocorrelation Function')
dev.off()
bitmap(file='test4.png')
cpgram(resid, main='Residual Cumulative Periodogram')
dev.off()
bitmap(file='test5.png')
hist(resid, main='Residual Histogram', xlab='values of Residuals')
dev.off()
bitmap(file='test6.png')
densityplot(~resid,col='black',main='Residual Density Plot', xlab='values of Residuals')
dev.off()
bitmap(file='test7.png')
qqnorm(resid, main='Residual Normal Q-Q Plot')
qqline(resid)
dev.off()
ncols <- length(selection[[1]][1,])
nrows <- length(selection[[2]][,1])-1
load(file='createtable')
a<-table.start()
a<-table.row.start(a)
a<-table.element(a,'ARIMA Parameter Estimation and Backward Selection', ncols+1,TRUE)
a<-table.row.end(a)
a<-table.row.start(a)
a<-table.element(a,'Iteration', header=TRUE)
for (i in 1:ncols) {
a<-table.element(a,names(selection[[3]][[1]]$coef)[i],header=TRUE)
}
a<-table.row.end(a)
for (j in 1:nrows) {
a<-table.row.start(a)
mydum <- 'Estimates ('
mydum <- paste(mydum,j)
mydum <- paste(mydum,')')
a<-table.element(a,mydum, header=TRUE)
for (i in 1:ncols) {
a<-table.element(a,round(selection[[1]][j,i],4))
}
a<-table.row.end(a)
a<-table.row.start(a)
a<-table.element(a,'(p-val)', header=TRUE)
for (i in 1:ncols) {
mydum <- '('
mydum <- paste(mydum,round(selection[[2]][j,i],4),sep='')
mydum <- paste(mydum,')')
a<-table.element(a,mydum)
}
a<-table.row.end(a)
}
a<-table.end(a)
table.save(a,file='mytable.tab')
a<-table.start()
a<-table.row.start(a)
a<-table.element(a,'Estimated ARIMA Residuals', 1,TRUE)
a<-table.row.end(a)
a<-table.row.start(a)
a<-table.element(a,'Value', 1,TRUE)
a<-table.row.end(a)
for (i in (par4*par5+par3):length(resid)) {
a<-table.row.start(a)
a<-table.element(a,resid[i])
a<-table.row.end(a)
}
a<-table.end(a)
table.save(a,file='mytable1.tab')