Free Statistics

of Irreproducible Research!

Author's title

Author*The author of this computation has been verified*
R Software Modulerwasp_exponentialsmoothing.wasp
Title produced by softwareExponential Smoothing
Date of computationWed, 09 Dec 2009 12:00:27 -0700
Cite this page as followsStatistical Computations at FreeStatistics.org, Office for Research Development and Education, URL https://freestatistics.org/blog/index.php?v=date/2009/Dec/09/t1260385327zvmvyow2v2sjwj8.htm/, Retrieved Mon, 29 Apr 2024 09:26:12 +0000
Statistical Computations at FreeStatistics.org, Office for Research Development and Education, URL https://freestatistics.org/blog/index.php?pk=65147, Retrieved Mon, 29 Apr 2024 09:26:12 +0000
QR Codes:

Original text written by user:
IsPrivate?No (this computation is public)
User-defined keywords
Estimated Impact97
Family? (F = Feedback message, R = changed R code, M = changed R Module, P = changed Parameters, D = changed Data)
-     [Univariate Data Series] [data set] [2008-12-01 19:54:57] [b98453cac15ba1066b407e146608df68]
- RMP   [Exponential Smoothing] [] [2009-11-27 15:04:36] [b98453cac15ba1066b407e146608df68]
-    D    [Exponential Smoothing] [ws 9] [2009-12-04 15:14:43] [626f1d98f4a7f05bcb9f17666b672c60]
-    D        [Exponential Smoothing] [ws9 exp] [2009-12-09 19:00:27] [dd4f17965cad1d38de7a1c062d32d75d] [Current]
Feedback Forum

Post a new message
Dataseries X:
2360
2214
2825
2355
2333
3016
2155
2172
2150
2533
2058
2160
2260
2498
2695
2799
2947
2930
2318
2540
2570
2669
2450
2842
3440
2678
2981
2260
2844
2546
2456
2295
2379
2479
2057
2280
2351
2276
2548
2311
2201
2725
2408
2139
1898
2537
2069
2063
2524
2437
2189
2793
2074
2622
2278
2144
2427
2139
1828
2072
1800
1758
2246
1987
1868
2514
2121


Summary of computational transaction
Raw Inputview raw input (R code)
Raw Outputview raw output of R engine
Computing time2 seconds
R Server'Gwilym Jenkins' @ 72.249.127.135

\begin{tabular}{lllllllll}
\hline
Summary of computational transaction \tabularnewline
Raw Input & view raw input (R code)  \tabularnewline
Raw Output & view raw output of R engine  \tabularnewline
Computing time & 2 seconds \tabularnewline
R Server & 'Gwilym Jenkins' @ 72.249.127.135 \tabularnewline
\hline
\end{tabular}
%Source: https://freestatistics.org/blog/index.php?pk=65147&T=0

[TABLE]
[ROW][C]Summary of computational transaction[/C][/ROW]
[ROW][C]Raw Input[/C][C]view raw input (R code) [/C][/ROW]
[ROW][C]Raw Output[/C][C]view raw output of R engine [/C][/ROW]
[ROW][C]Computing time[/C][C]2 seconds[/C][/ROW]
[ROW][C]R Server[/C][C]'Gwilym Jenkins' @ 72.249.127.135[/C][/ROW]
[/TABLE]
Source: https://freestatistics.org/blog/index.php?pk=65147&T=0

Globally Unique Identifier (entire table): ba.freestatistics.org/blog/index.php?pk=65147&T=0

As an alternative you can also use a QR Code:  

The GUIDs for individual cells are displayed in the table below:

Summary of computational transaction
Raw Inputview raw input (R code)
Raw Outputview raw output of R engine
Computing time2 seconds
R Server'Gwilym Jenkins' @ 72.249.127.135


Estimated Parameters of Exponential Smoothing
ParameterValue
alpha0.347167391002761
beta0.0325187100821525
gamma0.393036024342864

\begin{tabular}{lllllllll}
\hline
Estimated Parameters of Exponential Smoothing \tabularnewline
Parameter & Value \tabularnewline
alpha & 0.347167391002761 \tabularnewline
beta & 0.0325187100821525 \tabularnewline
gamma & 0.393036024342864 \tabularnewline
\hline
\end{tabular}
%Source: https://freestatistics.org/blog/index.php?pk=65147&T=1

[TABLE]
[ROW][C]Estimated Parameters of Exponential Smoothing[/C][/ROW]
[ROW][C]Parameter[/C][C]Value[/C][/ROW]
[ROW][C]alpha[/C][C]0.347167391002761[/C][/ROW]
[ROW][C]beta[/C][C]0.0325187100821525[/C][/ROW]
[ROW][C]gamma[/C][C]0.393036024342864[/C][/ROW]
[/TABLE]
Source: https://freestatistics.org/blog/index.php?pk=65147&T=1

Globally Unique Identifier (entire table): ba.freestatistics.org/blog/index.php?pk=65147&T=1

As an alternative you can also use a QR Code:  

The GUIDs for individual cells are displayed in the table below:

Estimated Parameters of Exponential Smoothing
ParameterValue
alpha0.347167391002761
beta0.0325187100821525
gamma0.393036024342864


Interpolation Forecasts of Exponential Smoothing
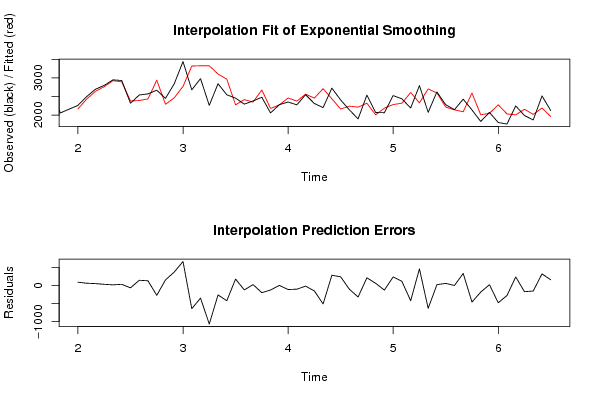
tObservedFittedResiduals
1322602165.7197168107194.2802831892864
1424982431.5906643154266.4093356845774
1526952639.2105146002655.7894853997418
1627992762.9478895386136.052110461389
1729472925.6953664964721.3046335035256
1829302894.1762987615735.8237012384334
1923182379.93135935169-61.9313593516904
2025402391.95263488983148.047365110167
2125702436.04022753511133.959772464894
2226692938.60901177949-269.609011779486
2324502290.93533203163159.064667968373
2428422464.45787164299377.542128357005
2534402771.97809928578668.021900714218
2626783318.28871966593-640.288719665934
2729813327.19077198552-346.190771985524
2822603326.35191724600-1066.35191724600
2928443102.7683529705-258.768352970502
3025462966.09141466652-420.091414666524
3124562275.01908045422180.980919545777
3222952414.64068780833-119.640687808334
3323792350.5562582082128.4437417917884
3424792675.19009901314-196.190099013143
3520572178.13929213336-121.139292133362
3622802273.96207168086.03792831920009
3723512459.59702725275-108.597027252746
3822762375.02088656453-99.020886564529
3925482562.43586993791-14.4358699379077
4023112458.22504011548-147.225040115482
4122012709.82987514301-508.829875143014
4227252437.61449401645287.385505983555
4324082163.01083964412244.989160355882
4421392240.54876701044-101.548767010440
4518982213.24299379638-315.242993796379
4625372320.30445896899216.695541031008
4720692005.2963166627663.7036833372424
4820632187.28515469447-124.285154694467
4925242282.83423077301241.165769226993
5024372319.83412911981117.165870880190
5121892608.49296364284-419.492963642839
5227932329.36548710150463.634512898496
5320742703.75440279794-629.75440279794
5426222595.6001228952226.39987710478
5522782216.3650064600961.6349935399085
5621442140.462436743903.53756325610357
5724272089.09653730266337.903462697335
5821392595.01466406412-456.014664064122
5918282007.89160094113-179.891600941129
6020722046.6086938547225.3913061452845
6118002276.25230583301-476.252305833008
6217582031.79577134451-273.795771344512
6322462006.10271408423239.897285915774
6419872156.21535900778-169.215359007781
6518682017.54965846487-149.549658464873
6625142189.25953005690324.740469943095
6721211959.88673775854161.113262241463

\begin{tabular}{lllllllll}
\hline
Interpolation Forecasts of Exponential Smoothing \tabularnewline
t & Observed & Fitted & Residuals \tabularnewline
13 & 2260 & 2165.71971681071 & 94.2802831892864 \tabularnewline
14 & 2498 & 2431.59066431542 & 66.4093356845774 \tabularnewline
15 & 2695 & 2639.21051460026 & 55.7894853997418 \tabularnewline
16 & 2799 & 2762.94788953861 & 36.052110461389 \tabularnewline
17 & 2947 & 2925.69536649647 & 21.3046335035256 \tabularnewline
18 & 2930 & 2894.17629876157 & 35.8237012384334 \tabularnewline
19 & 2318 & 2379.93135935169 & -61.9313593516904 \tabularnewline
20 & 2540 & 2391.95263488983 & 148.047365110167 \tabularnewline
21 & 2570 & 2436.04022753511 & 133.959772464894 \tabularnewline
22 & 2669 & 2938.60901177949 & -269.609011779486 \tabularnewline
23 & 2450 & 2290.93533203163 & 159.064667968373 \tabularnewline
24 & 2842 & 2464.45787164299 & 377.542128357005 \tabularnewline
25 & 3440 & 2771.97809928578 & 668.021900714218 \tabularnewline
26 & 2678 & 3318.28871966593 & -640.288719665934 \tabularnewline
27 & 2981 & 3327.19077198552 & -346.190771985524 \tabularnewline
28 & 2260 & 3326.35191724600 & -1066.35191724600 \tabularnewline
29 & 2844 & 3102.7683529705 & -258.768352970502 \tabularnewline
30 & 2546 & 2966.09141466652 & -420.091414666524 \tabularnewline
31 & 2456 & 2275.01908045422 & 180.980919545777 \tabularnewline
32 & 2295 & 2414.64068780833 & -119.640687808334 \tabularnewline
33 & 2379 & 2350.55625820821 & 28.4437417917884 \tabularnewline
34 & 2479 & 2675.19009901314 & -196.190099013143 \tabularnewline
35 & 2057 & 2178.13929213336 & -121.139292133362 \tabularnewline
36 & 2280 & 2273.9620716808 & 6.03792831920009 \tabularnewline
37 & 2351 & 2459.59702725275 & -108.597027252746 \tabularnewline
38 & 2276 & 2375.02088656453 & -99.020886564529 \tabularnewline
39 & 2548 & 2562.43586993791 & -14.4358699379077 \tabularnewline
40 & 2311 & 2458.22504011548 & -147.225040115482 \tabularnewline
41 & 2201 & 2709.82987514301 & -508.829875143014 \tabularnewline
42 & 2725 & 2437.61449401645 & 287.385505983555 \tabularnewline
43 & 2408 & 2163.01083964412 & 244.989160355882 \tabularnewline
44 & 2139 & 2240.54876701044 & -101.548767010440 \tabularnewline
45 & 1898 & 2213.24299379638 & -315.242993796379 \tabularnewline
46 & 2537 & 2320.30445896899 & 216.695541031008 \tabularnewline
47 & 2069 & 2005.29631666276 & 63.7036833372424 \tabularnewline
48 & 2063 & 2187.28515469447 & -124.285154694467 \tabularnewline
49 & 2524 & 2282.83423077301 & 241.165769226993 \tabularnewline
50 & 2437 & 2319.83412911981 & 117.165870880190 \tabularnewline
51 & 2189 & 2608.49296364284 & -419.492963642839 \tabularnewline
52 & 2793 & 2329.36548710150 & 463.634512898496 \tabularnewline
53 & 2074 & 2703.75440279794 & -629.75440279794 \tabularnewline
54 & 2622 & 2595.60012289522 & 26.39987710478 \tabularnewline
55 & 2278 & 2216.36500646009 & 61.6349935399085 \tabularnewline
56 & 2144 & 2140.46243674390 & 3.53756325610357 \tabularnewline
57 & 2427 & 2089.09653730266 & 337.903462697335 \tabularnewline
58 & 2139 & 2595.01466406412 & -456.014664064122 \tabularnewline
59 & 1828 & 2007.89160094113 & -179.891600941129 \tabularnewline
60 & 2072 & 2046.60869385472 & 25.3913061452845 \tabularnewline
61 & 1800 & 2276.25230583301 & -476.252305833008 \tabularnewline
62 & 1758 & 2031.79577134451 & -273.795771344512 \tabularnewline
63 & 2246 & 2006.10271408423 & 239.897285915774 \tabularnewline
64 & 1987 & 2156.21535900778 & -169.215359007781 \tabularnewline
65 & 1868 & 2017.54965846487 & -149.549658464873 \tabularnewline
66 & 2514 & 2189.25953005690 & 324.740469943095 \tabularnewline
67 & 2121 & 1959.88673775854 & 161.113262241463 \tabularnewline
\hline
\end{tabular}
%Source: https://freestatistics.org/blog/index.php?pk=65147&T=2

[TABLE]
[ROW][C]Interpolation Forecasts of Exponential Smoothing[/C][/ROW]
[ROW][C]t[/C][C]Observed[/C][C]Fitted[/C][C]Residuals[/C][/ROW]
[ROW][C]13[/C][C]2260[/C][C]2165.71971681071[/C][C]94.2802831892864[/C][/ROW]
[ROW][C]14[/C][C]2498[/C][C]2431.59066431542[/C][C]66.4093356845774[/C][/ROW]
[ROW][C]15[/C][C]2695[/C][C]2639.21051460026[/C][C]55.7894853997418[/C][/ROW]
[ROW][C]16[/C][C]2799[/C][C]2762.94788953861[/C][C]36.052110461389[/C][/ROW]
[ROW][C]17[/C][C]2947[/C][C]2925.69536649647[/C][C]21.3046335035256[/C][/ROW]
[ROW][C]18[/C][C]2930[/C][C]2894.17629876157[/C][C]35.8237012384334[/C][/ROW]
[ROW][C]19[/C][C]2318[/C][C]2379.93135935169[/C][C]-61.9313593516904[/C][/ROW]
[ROW][C]20[/C][C]2540[/C][C]2391.95263488983[/C][C]148.047365110167[/C][/ROW]
[ROW][C]21[/C][C]2570[/C][C]2436.04022753511[/C][C]133.959772464894[/C][/ROW]
[ROW][C]22[/C][C]2669[/C][C]2938.60901177949[/C][C]-269.609011779486[/C][/ROW]
[ROW][C]23[/C][C]2450[/C][C]2290.93533203163[/C][C]159.064667968373[/C][/ROW]
[ROW][C]24[/C][C]2842[/C][C]2464.45787164299[/C][C]377.542128357005[/C][/ROW]
[ROW][C]25[/C][C]3440[/C][C]2771.97809928578[/C][C]668.021900714218[/C][/ROW]
[ROW][C]26[/C][C]2678[/C][C]3318.28871966593[/C][C]-640.288719665934[/C][/ROW]
[ROW][C]27[/C][C]2981[/C][C]3327.19077198552[/C][C]-346.190771985524[/C][/ROW]
[ROW][C]28[/C][C]2260[/C][C]3326.35191724600[/C][C]-1066.35191724600[/C][/ROW]
[ROW][C]29[/C][C]2844[/C][C]3102.7683529705[/C][C]-258.768352970502[/C][/ROW]
[ROW][C]30[/C][C]2546[/C][C]2966.09141466652[/C][C]-420.091414666524[/C][/ROW]
[ROW][C]31[/C][C]2456[/C][C]2275.01908045422[/C][C]180.980919545777[/C][/ROW]
[ROW][C]32[/C][C]2295[/C][C]2414.64068780833[/C][C]-119.640687808334[/C][/ROW]
[ROW][C]33[/C][C]2379[/C][C]2350.55625820821[/C][C]28.4437417917884[/C][/ROW]
[ROW][C]34[/C][C]2479[/C][C]2675.19009901314[/C][C]-196.190099013143[/C][/ROW]
[ROW][C]35[/C][C]2057[/C][C]2178.13929213336[/C][C]-121.139292133362[/C][/ROW]
[ROW][C]36[/C][C]2280[/C][C]2273.9620716808[/C][C]6.03792831920009[/C][/ROW]
[ROW][C]37[/C][C]2351[/C][C]2459.59702725275[/C][C]-108.597027252746[/C][/ROW]
[ROW][C]38[/C][C]2276[/C][C]2375.02088656453[/C][C]-99.020886564529[/C][/ROW]
[ROW][C]39[/C][C]2548[/C][C]2562.43586993791[/C][C]-14.4358699379077[/C][/ROW]
[ROW][C]40[/C][C]2311[/C][C]2458.22504011548[/C][C]-147.225040115482[/C][/ROW]
[ROW][C]41[/C][C]2201[/C][C]2709.82987514301[/C][C]-508.829875143014[/C][/ROW]
[ROW][C]42[/C][C]2725[/C][C]2437.61449401645[/C][C]287.385505983555[/C][/ROW]
[ROW][C]43[/C][C]2408[/C][C]2163.01083964412[/C][C]244.989160355882[/C][/ROW]
[ROW][C]44[/C][C]2139[/C][C]2240.54876701044[/C][C]-101.548767010440[/C][/ROW]
[ROW][C]45[/C][C]1898[/C][C]2213.24299379638[/C][C]-315.242993796379[/C][/ROW]
[ROW][C]46[/C][C]2537[/C][C]2320.30445896899[/C][C]216.695541031008[/C][/ROW]
[ROW][C]47[/C][C]2069[/C][C]2005.29631666276[/C][C]63.7036833372424[/C][/ROW]
[ROW][C]48[/C][C]2063[/C][C]2187.28515469447[/C][C]-124.285154694467[/C][/ROW]
[ROW][C]49[/C][C]2524[/C][C]2282.83423077301[/C][C]241.165769226993[/C][/ROW]
[ROW][C]50[/C][C]2437[/C][C]2319.83412911981[/C][C]117.165870880190[/C][/ROW]
[ROW][C]51[/C][C]2189[/C][C]2608.49296364284[/C][C]-419.492963642839[/C][/ROW]
[ROW][C]52[/C][C]2793[/C][C]2329.36548710150[/C][C]463.634512898496[/C][/ROW]
[ROW][C]53[/C][C]2074[/C][C]2703.75440279794[/C][C]-629.75440279794[/C][/ROW]
[ROW][C]54[/C][C]2622[/C][C]2595.60012289522[/C][C]26.39987710478[/C][/ROW]
[ROW][C]55[/C][C]2278[/C][C]2216.36500646009[/C][C]61.6349935399085[/C][/ROW]
[ROW][C]56[/C][C]2144[/C][C]2140.46243674390[/C][C]3.53756325610357[/C][/ROW]
[ROW][C]57[/C][C]2427[/C][C]2089.09653730266[/C][C]337.903462697335[/C][/ROW]
[ROW][C]58[/C][C]2139[/C][C]2595.01466406412[/C][C]-456.014664064122[/C][/ROW]
[ROW][C]59[/C][C]1828[/C][C]2007.89160094113[/C][C]-179.891600941129[/C][/ROW]
[ROW][C]60[/C][C]2072[/C][C]2046.60869385472[/C][C]25.3913061452845[/C][/ROW]
[ROW][C]61[/C][C]1800[/C][C]2276.25230583301[/C][C]-476.252305833008[/C][/ROW]
[ROW][C]62[/C][C]1758[/C][C]2031.79577134451[/C][C]-273.795771344512[/C][/ROW]
[ROW][C]63[/C][C]2246[/C][C]2006.10271408423[/C][C]239.897285915774[/C][/ROW]
[ROW][C]64[/C][C]1987[/C][C]2156.21535900778[/C][C]-169.215359007781[/C][/ROW]
[ROW][C]65[/C][C]1868[/C][C]2017.54965846487[/C][C]-149.549658464873[/C][/ROW]
[ROW][C]66[/C][C]2514[/C][C]2189.25953005690[/C][C]324.740469943095[/C][/ROW]
[ROW][C]67[/C][C]2121[/C][C]1959.88673775854[/C][C]161.113262241463[/C][/ROW]
[/TABLE]
Source: https://freestatistics.org/blog/index.php?pk=65147&T=2

Globally Unique Identifier (entire table): ba.freestatistics.org/blog/index.php?pk=65147&T=2

As an alternative you can also use a QR Code:  

The GUIDs for individual cells are displayed in the table below:

Interpolation Forecasts of Exponential Smoothing
tObservedFittedResiduals
1322602165.7197168107194.2802831892864
1424982431.5906643154266.4093356845774
1526952639.2105146002655.7894853997418
1627992762.9478895386136.052110461389
1729472925.6953664964721.3046335035256
1829302894.1762987615735.8237012384334
1923182379.93135935169-61.9313593516904
2025402391.95263488983148.047365110167
2125702436.04022753511133.959772464894
2226692938.60901177949-269.609011779486
2324502290.93533203163159.064667968373
2428422464.45787164299377.542128357005
2534402771.97809928578668.021900714218
2626783318.28871966593-640.288719665934
2729813327.19077198552-346.190771985524
2822603326.35191724600-1066.35191724600
2928443102.7683529705-258.768352970502
3025462966.09141466652-420.091414666524
3124562275.01908045422180.980919545777
3222952414.64068780833-119.640687808334
3323792350.5562582082128.4437417917884
3424792675.19009901314-196.190099013143
3520572178.13929213336-121.139292133362
3622802273.96207168086.03792831920009
3723512459.59702725275-108.597027252746
3822762375.02088656453-99.020886564529
3925482562.43586993791-14.4358699379077
4023112458.22504011548-147.225040115482
4122012709.82987514301-508.829875143014
4227252437.61449401645287.385505983555
4324082163.01083964412244.989160355882
4421392240.54876701044-101.548767010440
4518982213.24299379638-315.242993796379
4625372320.30445896899216.695541031008
4720692005.2963166627663.7036833372424
4820632187.28515469447-124.285154694467
4925242282.83423077301241.165769226993
5024372319.83412911981117.165870880190
5121892608.49296364284-419.492963642839
5227932329.36548710150463.634512898496
5320742703.75440279794-629.75440279794
5426222595.6001228952226.39987710478
5522782216.3650064600961.6349935399085
5621442140.462436743903.53756325610357
5724272089.09653730266337.903462697335
5821392595.01466406412-456.014664064122
5918282007.89160094113-179.891600941129
6020722046.6086938547225.3913061452845
6118002276.25230583301-476.252305833008
6217582031.79577134451-273.795771344512
6322462006.10271408423239.897285915774
6419872156.21535900778-169.215359007781
6518682017.54965846487-149.549658464873
6625142189.25953005690324.740469943095
6721211959.88673775854161.113262241463


Extrapolation Forecasts of Exponential Smoothing
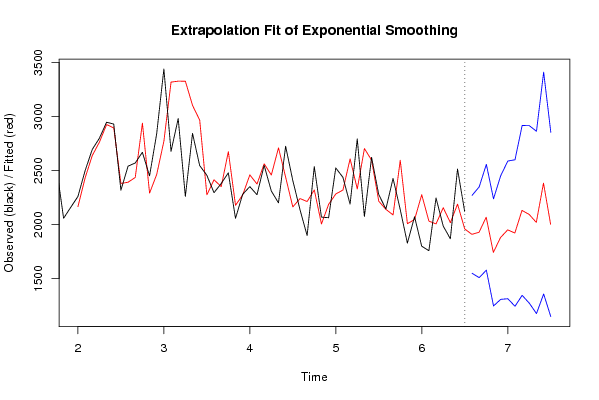
tForecast95% Lower Bound95% Upper Bound
681909.365703954081549.431024529772269.3003833784
691928.653912851781508.700713834472348.60711186910
702067.646427352901577.970324617352557.32253008844
711742.125080082751246.459524309262237.79063585623
721879.590654444891307.609769464572451.57153942521
731950.788381449311313.699865872772587.87689702584
741921.701915366721243.718994275832599.68483645761
752131.05238560251344.973578052352917.13119315265
762093.661645780831272.098146970242915.22514459141
772019.888471554941176.426741107912863.35020200197
782384.095975787821357.620914467663410.57103710799
792000.903229255561147.678233461312854.12822504982

\begin{tabular}{lllllllll}
\hline
Extrapolation Forecasts of Exponential Smoothing \tabularnewline
t & Forecast & 95% Lower Bound & 95% Upper Bound \tabularnewline
68 & 1909.36570395408 & 1549.43102452977 & 2269.3003833784 \tabularnewline
69 & 1928.65391285178 & 1508.70071383447 & 2348.60711186910 \tabularnewline
70 & 2067.64642735290 & 1577.97032461735 & 2557.32253008844 \tabularnewline
71 & 1742.12508008275 & 1246.45952430926 & 2237.79063585623 \tabularnewline
72 & 1879.59065444489 & 1307.60976946457 & 2451.57153942521 \tabularnewline
73 & 1950.78838144931 & 1313.69986587277 & 2587.87689702584 \tabularnewline
74 & 1921.70191536672 & 1243.71899427583 & 2599.68483645761 \tabularnewline
75 & 2131.0523856025 & 1344.97357805235 & 2917.13119315265 \tabularnewline
76 & 2093.66164578083 & 1272.09814697024 & 2915.22514459141 \tabularnewline
77 & 2019.88847155494 & 1176.42674110791 & 2863.35020200197 \tabularnewline
78 & 2384.09597578782 & 1357.62091446766 & 3410.57103710799 \tabularnewline
79 & 2000.90322925556 & 1147.67823346131 & 2854.12822504982 \tabularnewline
\hline
\end{tabular}
%Source: https://freestatistics.org/blog/index.php?pk=65147&T=3

[TABLE]
[ROW][C]Extrapolation Forecasts of Exponential Smoothing[/C][/ROW]
[ROW][C]t[/C][C]Forecast[/C][C]95% Lower Bound[/C][C]95% Upper Bound[/C][/ROW]
[ROW][C]68[/C][C]1909.36570395408[/C][C]1549.43102452977[/C][C]2269.3003833784[/C][/ROW]
[ROW][C]69[/C][C]1928.65391285178[/C][C]1508.70071383447[/C][C]2348.60711186910[/C][/ROW]
[ROW][C]70[/C][C]2067.64642735290[/C][C]1577.97032461735[/C][C]2557.32253008844[/C][/ROW]
[ROW][C]71[/C][C]1742.12508008275[/C][C]1246.45952430926[/C][C]2237.79063585623[/C][/ROW]
[ROW][C]72[/C][C]1879.59065444489[/C][C]1307.60976946457[/C][C]2451.57153942521[/C][/ROW]
[ROW][C]73[/C][C]1950.78838144931[/C][C]1313.69986587277[/C][C]2587.87689702584[/C][/ROW]
[ROW][C]74[/C][C]1921.70191536672[/C][C]1243.71899427583[/C][C]2599.68483645761[/C][/ROW]
[ROW][C]75[/C][C]2131.0523856025[/C][C]1344.97357805235[/C][C]2917.13119315265[/C][/ROW]
[ROW][C]76[/C][C]2093.66164578083[/C][C]1272.09814697024[/C][C]2915.22514459141[/C][/ROW]
[ROW][C]77[/C][C]2019.88847155494[/C][C]1176.42674110791[/C][C]2863.35020200197[/C][/ROW]
[ROW][C]78[/C][C]2384.09597578782[/C][C]1357.62091446766[/C][C]3410.57103710799[/C][/ROW]
[ROW][C]79[/C][C]2000.90322925556[/C][C]1147.67823346131[/C][C]2854.12822504982[/C][/ROW]
[/TABLE]
Source: https://freestatistics.org/blog/index.php?pk=65147&T=3

Globally Unique Identifier (entire table): ba.freestatistics.org/blog/index.php?pk=65147&T=3

As an alternative you can also use a QR Code:  

The GUIDs for individual cells are displayed in the table below:

Extrapolation Forecasts of Exponential Smoothing
tForecast95% Lower Bound95% Upper Bound
681909.365703954081549.431024529772269.3003833784
691928.653912851781508.700713834472348.60711186910
702067.646427352901577.970324617352557.32253008844
711742.125080082751246.459524309262237.79063585623
721879.590654444891307.609769464572451.57153942521
731950.788381449311313.699865872772587.87689702584
741921.701915366721243.718994275832599.68483645761
752131.05238560251344.973578052352917.13119315265
762093.661645780831272.098146970242915.22514459141
772019.888471554941176.426741107912863.35020200197
782384.095975787821357.620914467663410.57103710799
792000.903229255561147.678233461312854.12822504982


Parameters (Session):
par1 = 12 ; par2 = Triple ; par3 = multiplicative ;
Parameters (R input):
par1 = 12 ; par2 = Triple ; par3 = multiplicative ;
R code (references can be found in the software module):
par1 <- as.numeric(par1)
if (par2 == 'Single') K <- 1
if (par2 == 'Double') K <- 2
if (par2 == 'Triple') K <- par1
nx <- length(x)
nxmK <- nx - K
x <- ts(x, frequency = par1)
if (par2 == 'Single') fit <- HoltWinters(x, gamma=0, beta=0)
if (par2 == 'Double') fit <- HoltWinters(x, gamma=0)
if (par2 == 'Triple') fit <- HoltWinters(x, seasonal=par3)
fit
myresid <- x - fit$fitted[,'xhat']
bitmap(file='test1.png')
op <- par(mfrow=c(2,1))
plot(fit,ylab='Observed (black) / Fitted (red)',main='Interpolation Fit of Exponential Smoothing')
plot(myresid,ylab='Residuals',main='Interpolation Prediction Errors')
par(op)
dev.off()
bitmap(file='test2.png')
p <- predict(fit, par1, prediction.interval=TRUE)
np <- length(p[,1])
plot(fit,p,ylab='Observed (black) / Fitted (red)',main='Extrapolation Fit of Exponential Smoothing')
dev.off()
bitmap(file='test3.png')
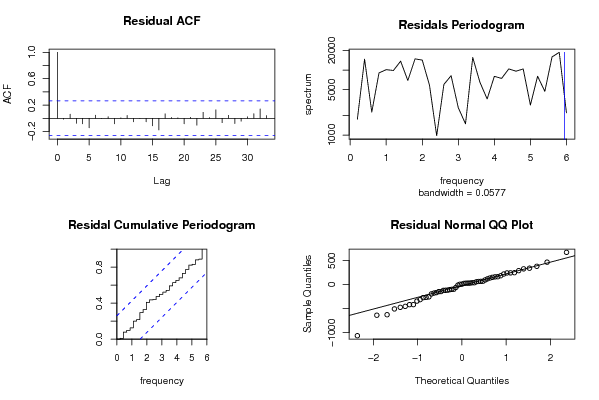
op <- par(mfrow = c(2,2))
acf(as.numeric(myresid),lag.max = nx/2,main='Residual ACF')
spectrum(myresid,main='Residals Periodogram')
cpgram(myresid,main='Residal Cumulative Periodogram')
qqnorm(myresid,main='Residual Normal QQ Plot')
qqline(myresid)
par(op)
dev.off()
load(file='createtable')
a<-table.start()
a<-table.row.start(a)
a<-table.element(a,'Estimated Parameters of Exponential Smoothing',2,TRUE)
a<-table.row.end(a)
a<-table.row.start(a)
a<-table.element(a,'Parameter',header=TRUE)
a<-table.element(a,'Value',header=TRUE)
a<-table.row.end(a)
a<-table.row.start(a)
a<-table.element(a,'alpha',header=TRUE)
a<-table.element(a,fit$alpha)
a<-table.row.end(a)
a<-table.row.start(a)
a<-table.element(a,'beta',header=TRUE)
a<-table.element(a,fit$beta)
a<-table.row.end(a)
a<-table.row.start(a)
a<-table.element(a,'gamma',header=TRUE)
a<-table.element(a,fit$gamma)
a<-table.row.end(a)
a<-table.end(a)
table.save(a,file='mytable.tab')
a<-table.start()
a<-table.row.start(a)
a<-table.element(a,'Interpolation Forecasts of Exponential Smoothing',4,TRUE)
a<-table.row.end(a)
a<-table.row.start(a)
a<-table.element(a,'t',header=TRUE)
a<-table.element(a,'Observed',header=TRUE)
a<-table.element(a,'Fitted',header=TRUE)
a<-table.element(a,'Residuals',header=TRUE)
a<-table.row.end(a)
for (i in 1:nxmK) {
a<-table.row.start(a)
a<-table.element(a,i+K,header=TRUE)
a<-table.element(a,x[i+K])
a<-table.element(a,fit$fitted[i,'xhat'])
a<-table.element(a,myresid[i])
a<-table.row.end(a)
}
a<-table.end(a)
table.save(a,file='mytable1.tab')
a<-table.start()
a<-table.row.start(a)
a<-table.element(a,'Extrapolation Forecasts of Exponential Smoothing',4,TRUE)
a<-table.row.end(a)
a<-table.row.start(a)
a<-table.element(a,'t',header=TRUE)
a<-table.element(a,'Forecast',header=TRUE)
a<-table.element(a,'95% Lower Bound',header=TRUE)
a<-table.element(a,'95% Upper Bound',header=TRUE)
a<-table.row.end(a)
for (i in 1:np) {
a<-table.row.start(a)
a<-table.element(a,nx+i,header=TRUE)
a<-table.element(a,p[i,'fit'])
a<-table.element(a,p[i,'lwr'])
a<-table.element(a,p[i,'upr'])
a<-table.row.end(a)
}
a<-table.end(a)
table.save(a,file='mytable2.tab')