Free Statistics

of Irreproducible Research!

Author's title

Author*The author of this computation has been verified*
R Software Modulerwasp_autocorrelation.wasp
Title produced by software(Partial) Autocorrelation Function
Date of computationWed, 09 Dec 2009 15:06:03 -0700
Cite this page as followsStatistical Computations at FreeStatistics.org, Office for Research Development and Education, URL https://freestatistics.org/blog/index.php?v=date/2009/Dec/09/t1260396486rgwzd7flnf0dt16.htm/, Retrieved Mon, 29 Apr 2024 11:41:56 +0000
Statistical Computations at FreeStatistics.org, Office for Research Development and Education, URL https://freestatistics.org/blog/index.php?pk=65215, Retrieved Mon, 29 Apr 2024 11:41:56 +0000
QR Codes:

Original text written by user:
IsPrivate?No (this computation is public)
User-defined keywordsShwWs9 aanvulling
Estimated Impact120
Family? (F = Feedback message, R = changed R code, M = changed R Module, P = changed Parameters, D = changed Data)
-     [Univariate Data Series] [data set] [2008-12-01 19:54:57] [b98453cac15ba1066b407e146608df68]
- RMP   [(Partial) Autocorrelation Function] [] [2009-11-27 14:46:03] [b98453cac15ba1066b407e146608df68]
-   PD    [(Partial) Autocorrelation Function] [WS 9 (P)ACF 1] [2009-12-04 10:00:10] [83058a88a37d754675a5cd22dab372fc]
-           [(Partial) Autocorrelation Function] [WS 9 (P)ACF 2] [2009-12-04 10:02:05] [83058a88a37d754675a5cd22dab372fc]
-   P           [(Partial) Autocorrelation Function] [WS9 aanvulling] [2009-12-09 22:06:03] [51108381f3361ca8af49c4f74052c840] [Current]
Feedback Forum

Post a new message
Dataseries X:
98.8
100.5
110.4
96.4
101.9
106.2
81
94.7
101
109.4
102.3
90.7
96.2
96.1
106
103.1
102
104.7
86
92.1
106.9
112.6
101.7
92
97.4
97
105.4
102.7
98.1
104.5
87.4
89.9
109.8
111.7
98.6
96.9
95.1
97
112.7
102.9
97.4
111.4
87.4
96.8
114.1
110.3
103.9
101.6
94.6
95.9
104.7
102.8
98.1
113.9
80.9
95.7
113.2
105.9
108.8
102.3
99
100.7
115.5
100.7
109.9
114.6
85.4
100.5
114.8
116.5
112.9
102
106
105.3
118.8
106.1
109.3
117.2
92.5
104.2
112.5
122.4
113.3
100
110.7
112.8
109.8
117.3
109.1
115.9
96
99.8
116.8
115.7
99.4
94.3


Summary of computational transaction
Raw Inputview raw input (R code)
Raw Outputview raw output of R engine
Computing time1 seconds
R Server'Gwilym Jenkins' @ 72.249.127.135

\begin{tabular}{lllllllll}
\hline
Summary of computational transaction \tabularnewline
Raw Input & view raw input (R code)  \tabularnewline
Raw Output & view raw output of R engine  \tabularnewline
Computing time & 1 seconds \tabularnewline
R Server & 'Gwilym Jenkins' @ 72.249.127.135 \tabularnewline
\hline
\end{tabular}
%Source: https://freestatistics.org/blog/index.php?pk=65215&T=0

[TABLE]
[ROW][C]Summary of computational transaction[/C][/ROW]
[ROW][C]Raw Input[/C][C]view raw input (R code) [/C][/ROW]
[ROW][C]Raw Output[/C][C]view raw output of R engine [/C][/ROW]
[ROW][C]Computing time[/C][C]1 seconds[/C][/ROW]
[ROW][C]R Server[/C][C]'Gwilym Jenkins' @ 72.249.127.135[/C][/ROW]
[/TABLE]
Source: https://freestatistics.org/blog/index.php?pk=65215&T=0

Globally Unique Identifier (entire table): ba.freestatistics.org/blog/index.php?pk=65215&T=0

As an alternative you can also use a QR Code:  

The GUIDs for individual cells are displayed in the table below:

Summary of computational transaction
Raw Inputview raw input (R code)
Raw Outputview raw output of R engine
Computing time1 seconds
R Server'Gwilym Jenkins' @ 72.249.127.135


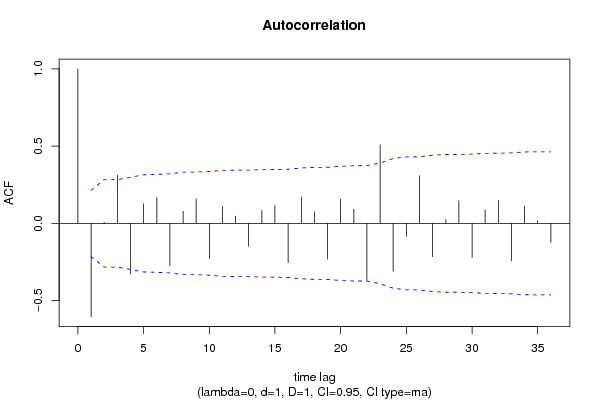
Autocorrelation Function
Time lag kACF(k)T-STATP-value
1-0.60406-5.50320
20.006740.06140.475593
30.3119772.84220.002818
4-0.327508-2.98370.001869
50.1273861.16050.124578
60.1666281.51810.0664
7-0.272967-2.48690.007446
80.0785590.71570.238092
90.1582051.44130.076629
10-0.227656-2.0740.020587
110.1096540.9990.16035
120.0463010.42180.337124
13-0.149033-1.35780.08911
140.0830680.75680.22566
150.1155671.05290.14773
16-0.253958-2.31370.01158
170.1698761.54760.062757
180.0744780.67850.249663
19-0.230068-2.0960.019563
200.1574081.43410.077657
210.0913920.83260.203724
22-0.369943-3.37030.000571
230.509084.63796e-06
24-0.310802-2.83150.002905
25-0.084709-0.77170.221232
260.3079662.80570.003127
27-0.2157-1.96510.026373
280.0240270.21890.413634
290.1464271.3340.092924
30-0.220649-2.01020.023828
310.0870460.7930.215013
320.1477991.34650.090901
33-0.242635-2.21050.014911
340.1132661.03190.152559
350.0177470.16170.435974
36-0.123165-1.12210.132531

\begin{tabular}{lllllllll}
\hline
Autocorrelation Function \tabularnewline
Time lag k & ACF(k) & T-STAT & P-value \tabularnewline
1 & -0.60406 & -5.5032 & 0 \tabularnewline
2 & 0.00674 & 0.0614 & 0.475593 \tabularnewline
3 & 0.311977 & 2.8422 & 0.002818 \tabularnewline
4 & -0.327508 & -2.9837 & 0.001869 \tabularnewline
5 & 0.127386 & 1.1605 & 0.124578 \tabularnewline
6 & 0.166628 & 1.5181 & 0.0664 \tabularnewline
7 & -0.272967 & -2.4869 & 0.007446 \tabularnewline
8 & 0.078559 & 0.7157 & 0.238092 \tabularnewline
9 & 0.158205 & 1.4413 & 0.076629 \tabularnewline
10 & -0.227656 & -2.074 & 0.020587 \tabularnewline
11 & 0.109654 & 0.999 & 0.16035 \tabularnewline
12 & 0.046301 & 0.4218 & 0.337124 \tabularnewline
13 & -0.149033 & -1.3578 & 0.08911 \tabularnewline
14 & 0.083068 & 0.7568 & 0.22566 \tabularnewline
15 & 0.115567 & 1.0529 & 0.14773 \tabularnewline
16 & -0.253958 & -2.3137 & 0.01158 \tabularnewline
17 & 0.169876 & 1.5476 & 0.062757 \tabularnewline
18 & 0.074478 & 0.6785 & 0.249663 \tabularnewline
19 & -0.230068 & -2.096 & 0.019563 \tabularnewline
20 & 0.157408 & 1.4341 & 0.077657 \tabularnewline
21 & 0.091392 & 0.8326 & 0.203724 \tabularnewline
22 & -0.369943 & -3.3703 & 0.000571 \tabularnewline
23 & 0.50908 & 4.6379 & 6e-06 \tabularnewline
24 & -0.310802 & -2.8315 & 0.002905 \tabularnewline
25 & -0.084709 & -0.7717 & 0.221232 \tabularnewline
26 & 0.307966 & 2.8057 & 0.003127 \tabularnewline
27 & -0.2157 & -1.9651 & 0.026373 \tabularnewline
28 & 0.024027 & 0.2189 & 0.413634 \tabularnewline
29 & 0.146427 & 1.334 & 0.092924 \tabularnewline
30 & -0.220649 & -2.0102 & 0.023828 \tabularnewline
31 & 0.087046 & 0.793 & 0.215013 \tabularnewline
32 & 0.147799 & 1.3465 & 0.090901 \tabularnewline
33 & -0.242635 & -2.2105 & 0.014911 \tabularnewline
34 & 0.113266 & 1.0319 & 0.152559 \tabularnewline
35 & 0.017747 & 0.1617 & 0.435974 \tabularnewline
36 & -0.123165 & -1.1221 & 0.132531 \tabularnewline
\hline
\end{tabular}
%Source: https://freestatistics.org/blog/index.php?pk=65215&T=1

[TABLE]
[ROW][C]Autocorrelation Function[/C][/ROW]
[ROW][C]Time lag k[/C][C]ACF(k)[/C][C]T-STAT[/C][C]P-value[/C][/ROW]
[ROW][C]1[/C][C]-0.60406[/C][C]-5.5032[/C][C]0[/C][/ROW]
[ROW][C]2[/C][C]0.00674[/C][C]0.0614[/C][C]0.475593[/C][/ROW]
[ROW][C]3[/C][C]0.311977[/C][C]2.8422[/C][C]0.002818[/C][/ROW]
[ROW][C]4[/C][C]-0.327508[/C][C]-2.9837[/C][C]0.001869[/C][/ROW]
[ROW][C]5[/C][C]0.127386[/C][C]1.1605[/C][C]0.124578[/C][/ROW]
[ROW][C]6[/C][C]0.166628[/C][C]1.5181[/C][C]0.0664[/C][/ROW]
[ROW][C]7[/C][C]-0.272967[/C][C]-2.4869[/C][C]0.007446[/C][/ROW]
[ROW][C]8[/C][C]0.078559[/C][C]0.7157[/C][C]0.238092[/C][/ROW]
[ROW][C]9[/C][C]0.158205[/C][C]1.4413[/C][C]0.076629[/C][/ROW]
[ROW][C]10[/C][C]-0.227656[/C][C]-2.074[/C][C]0.020587[/C][/ROW]
[ROW][C]11[/C][C]0.109654[/C][C]0.999[/C][C]0.16035[/C][/ROW]
[ROW][C]12[/C][C]0.046301[/C][C]0.4218[/C][C]0.337124[/C][/ROW]
[ROW][C]13[/C][C]-0.149033[/C][C]-1.3578[/C][C]0.08911[/C][/ROW]
[ROW][C]14[/C][C]0.083068[/C][C]0.7568[/C][C]0.22566[/C][/ROW]
[ROW][C]15[/C][C]0.115567[/C][C]1.0529[/C][C]0.14773[/C][/ROW]
[ROW][C]16[/C][C]-0.253958[/C][C]-2.3137[/C][C]0.01158[/C][/ROW]
[ROW][C]17[/C][C]0.169876[/C][C]1.5476[/C][C]0.062757[/C][/ROW]
[ROW][C]18[/C][C]0.074478[/C][C]0.6785[/C][C]0.249663[/C][/ROW]
[ROW][C]19[/C][C]-0.230068[/C][C]-2.096[/C][C]0.019563[/C][/ROW]
[ROW][C]20[/C][C]0.157408[/C][C]1.4341[/C][C]0.077657[/C][/ROW]
[ROW][C]21[/C][C]0.091392[/C][C]0.8326[/C][C]0.203724[/C][/ROW]
[ROW][C]22[/C][C]-0.369943[/C][C]-3.3703[/C][C]0.000571[/C][/ROW]
[ROW][C]23[/C][C]0.50908[/C][C]4.6379[/C][C]6e-06[/C][/ROW]
[ROW][C]24[/C][C]-0.310802[/C][C]-2.8315[/C][C]0.002905[/C][/ROW]
[ROW][C]25[/C][C]-0.084709[/C][C]-0.7717[/C][C]0.221232[/C][/ROW]
[ROW][C]26[/C][C]0.307966[/C][C]2.8057[/C][C]0.003127[/C][/ROW]
[ROW][C]27[/C][C]-0.2157[/C][C]-1.9651[/C][C]0.026373[/C][/ROW]
[ROW][C]28[/C][C]0.024027[/C][C]0.2189[/C][C]0.413634[/C][/ROW]
[ROW][C]29[/C][C]0.146427[/C][C]1.334[/C][C]0.092924[/C][/ROW]
[ROW][C]30[/C][C]-0.220649[/C][C]-2.0102[/C][C]0.023828[/C][/ROW]
[ROW][C]31[/C][C]0.087046[/C][C]0.793[/C][C]0.215013[/C][/ROW]
[ROW][C]32[/C][C]0.147799[/C][C]1.3465[/C][C]0.090901[/C][/ROW]
[ROW][C]33[/C][C]-0.242635[/C][C]-2.2105[/C][C]0.014911[/C][/ROW]
[ROW][C]34[/C][C]0.113266[/C][C]1.0319[/C][C]0.152559[/C][/ROW]
[ROW][C]35[/C][C]0.017747[/C][C]0.1617[/C][C]0.435974[/C][/ROW]
[ROW][C]36[/C][C]-0.123165[/C][C]-1.1221[/C][C]0.132531[/C][/ROW]
[/TABLE]
Source: https://freestatistics.org/blog/index.php?pk=65215&T=1

Globally Unique Identifier (entire table): ba.freestatistics.org/blog/index.php?pk=65215&T=1

As an alternative you can also use a QR Code:  

The GUIDs for individual cells are displayed in the table below:

Autocorrelation Function
Time lag kACF(k)T-STATP-value
1-0.60406-5.50320
20.006740.06140.475593
30.3119772.84220.002818
4-0.327508-2.98370.001869
50.1273861.16050.124578
60.1666281.51810.0664
7-0.272967-2.48690.007446
80.0785590.71570.238092
90.1582051.44130.076629
10-0.227656-2.0740.020587
110.1096540.9990.16035
120.0463010.42180.337124
13-0.149033-1.35780.08911
140.0830680.75680.22566
150.1155671.05290.14773
16-0.253958-2.31370.01158
170.1698761.54760.062757
180.0744780.67850.249663
19-0.230068-2.0960.019563
200.1574081.43410.077657
210.0913920.83260.203724
22-0.369943-3.37030.000571
230.509084.63796e-06
24-0.310802-2.83150.002905
25-0.084709-0.77170.221232
260.3079662.80570.003127
27-0.2157-1.96510.026373
280.0240270.21890.413634
290.1464271.3340.092924
30-0.220649-2.01020.023828
310.0870460.7930.215013
320.1477991.34650.090901
33-0.242635-2.21050.014911
340.1132661.03190.152559
350.0177470.16170.435974
36-0.123165-1.12210.132531


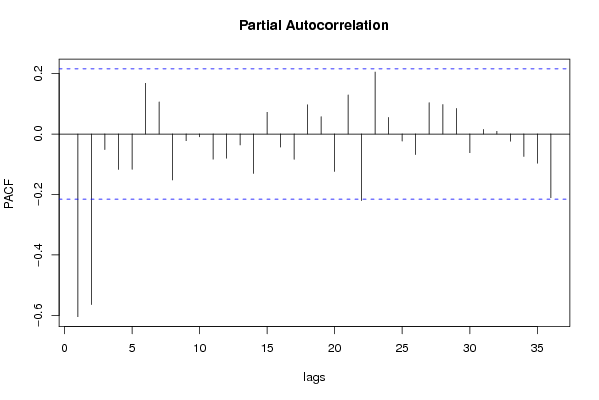
Partial Autocorrelation Function
Time lag kPACF(k)T-STATP-value
1-0.60406-5.50320
2-0.563915-5.13751e-06
3-0.051469-0.46890.320182
4-0.11734-1.0690.144079
5-0.116738-1.06350.145311
60.1674451.52550.065469
70.1062170.96770.168008
8-0.15182-1.38310.085165
9-0.022061-0.2010.420602
10-0.00915-0.08340.466882
11-0.083099-0.75710.225578
12-0.080177-0.73040.233587
13-0.036323-0.33090.370771
14-0.130506-1.1890.118922
150.0717280.65350.25763
16-0.043147-0.39310.347632
17-0.083541-0.76110.224378
180.09670.8810.190437
190.0573390.52240.301397
20-0.12381-1.1280.131293
210.1291771.17690.121308
22-0.219969-2.0040.024165
230.2049181.86690.032724
240.0549160.50030.309092
25-0.023467-0.21380.415617
26-0.067997-0.61950.268648
270.1036030.94390.173989
280.09720.88550.189213
290.0845810.77060.221575
30-0.061902-0.5640.287153
310.0149030.13580.446164
320.0088070.08020.468121
33-0.023696-0.21590.414805
34-0.074231-0.67630.250373
35-0.096408-0.87830.191152
36-0.210549-1.91820.029262

\begin{tabular}{lllllllll}
\hline
Partial Autocorrelation Function \tabularnewline
Time lag k & PACF(k) & T-STAT & P-value \tabularnewline
1 & -0.60406 & -5.5032 & 0 \tabularnewline
2 & -0.563915 & -5.1375 & 1e-06 \tabularnewline
3 & -0.051469 & -0.4689 & 0.320182 \tabularnewline
4 & -0.11734 & -1.069 & 0.144079 \tabularnewline
5 & -0.116738 & -1.0635 & 0.145311 \tabularnewline
6 & 0.167445 & 1.5255 & 0.065469 \tabularnewline
7 & 0.106217 & 0.9677 & 0.168008 \tabularnewline
8 & -0.15182 & -1.3831 & 0.085165 \tabularnewline
9 & -0.022061 & -0.201 & 0.420602 \tabularnewline
10 & -0.00915 & -0.0834 & 0.466882 \tabularnewline
11 & -0.083099 & -0.7571 & 0.225578 \tabularnewline
12 & -0.080177 & -0.7304 & 0.233587 \tabularnewline
13 & -0.036323 & -0.3309 & 0.370771 \tabularnewline
14 & -0.130506 & -1.189 & 0.118922 \tabularnewline
15 & 0.071728 & 0.6535 & 0.25763 \tabularnewline
16 & -0.043147 & -0.3931 & 0.347632 \tabularnewline
17 & -0.083541 & -0.7611 & 0.224378 \tabularnewline
18 & 0.0967 & 0.881 & 0.190437 \tabularnewline
19 & 0.057339 & 0.5224 & 0.301397 \tabularnewline
20 & -0.12381 & -1.128 & 0.131293 \tabularnewline
21 & 0.129177 & 1.1769 & 0.121308 \tabularnewline
22 & -0.219969 & -2.004 & 0.024165 \tabularnewline
23 & 0.204918 & 1.8669 & 0.032724 \tabularnewline
24 & 0.054916 & 0.5003 & 0.309092 \tabularnewline
25 & -0.023467 & -0.2138 & 0.415617 \tabularnewline
26 & -0.067997 & -0.6195 & 0.268648 \tabularnewline
27 & 0.103603 & 0.9439 & 0.173989 \tabularnewline
28 & 0.0972 & 0.8855 & 0.189213 \tabularnewline
29 & 0.084581 & 0.7706 & 0.221575 \tabularnewline
30 & -0.061902 & -0.564 & 0.287153 \tabularnewline
31 & 0.014903 & 0.1358 & 0.446164 \tabularnewline
32 & 0.008807 & 0.0802 & 0.468121 \tabularnewline
33 & -0.023696 & -0.2159 & 0.414805 \tabularnewline
34 & -0.074231 & -0.6763 & 0.250373 \tabularnewline
35 & -0.096408 & -0.8783 & 0.191152 \tabularnewline
36 & -0.210549 & -1.9182 & 0.029262 \tabularnewline
\hline
\end{tabular}
%Source: https://freestatistics.org/blog/index.php?pk=65215&T=2

[TABLE]
[ROW][C]Partial Autocorrelation Function[/C][/ROW]
[ROW][C]Time lag k[/C][C]PACF(k)[/C][C]T-STAT[/C][C]P-value[/C][/ROW]
[ROW][C]1[/C][C]-0.60406[/C][C]-5.5032[/C][C]0[/C][/ROW]
[ROW][C]2[/C][C]-0.563915[/C][C]-5.1375[/C][C]1e-06[/C][/ROW]
[ROW][C]3[/C][C]-0.051469[/C][C]-0.4689[/C][C]0.320182[/C][/ROW]
[ROW][C]4[/C][C]-0.11734[/C][C]-1.069[/C][C]0.144079[/C][/ROW]
[ROW][C]5[/C][C]-0.116738[/C][C]-1.0635[/C][C]0.145311[/C][/ROW]
[ROW][C]6[/C][C]0.167445[/C][C]1.5255[/C][C]0.065469[/C][/ROW]
[ROW][C]7[/C][C]0.106217[/C][C]0.9677[/C][C]0.168008[/C][/ROW]
[ROW][C]8[/C][C]-0.15182[/C][C]-1.3831[/C][C]0.085165[/C][/ROW]
[ROW][C]9[/C][C]-0.022061[/C][C]-0.201[/C][C]0.420602[/C][/ROW]
[ROW][C]10[/C][C]-0.00915[/C][C]-0.0834[/C][C]0.466882[/C][/ROW]
[ROW][C]11[/C][C]-0.083099[/C][C]-0.7571[/C][C]0.225578[/C][/ROW]
[ROW][C]12[/C][C]-0.080177[/C][C]-0.7304[/C][C]0.233587[/C][/ROW]
[ROW][C]13[/C][C]-0.036323[/C][C]-0.3309[/C][C]0.370771[/C][/ROW]
[ROW][C]14[/C][C]-0.130506[/C][C]-1.189[/C][C]0.118922[/C][/ROW]
[ROW][C]15[/C][C]0.071728[/C][C]0.6535[/C][C]0.25763[/C][/ROW]
[ROW][C]16[/C][C]-0.043147[/C][C]-0.3931[/C][C]0.347632[/C][/ROW]
[ROW][C]17[/C][C]-0.083541[/C][C]-0.7611[/C][C]0.224378[/C][/ROW]
[ROW][C]18[/C][C]0.0967[/C][C]0.881[/C][C]0.190437[/C][/ROW]
[ROW][C]19[/C][C]0.057339[/C][C]0.5224[/C][C]0.301397[/C][/ROW]
[ROW][C]20[/C][C]-0.12381[/C][C]-1.128[/C][C]0.131293[/C][/ROW]
[ROW][C]21[/C][C]0.129177[/C][C]1.1769[/C][C]0.121308[/C][/ROW]
[ROW][C]22[/C][C]-0.219969[/C][C]-2.004[/C][C]0.024165[/C][/ROW]
[ROW][C]23[/C][C]0.204918[/C][C]1.8669[/C][C]0.032724[/C][/ROW]
[ROW][C]24[/C][C]0.054916[/C][C]0.5003[/C][C]0.309092[/C][/ROW]
[ROW][C]25[/C][C]-0.023467[/C][C]-0.2138[/C][C]0.415617[/C][/ROW]
[ROW][C]26[/C][C]-0.067997[/C][C]-0.6195[/C][C]0.268648[/C][/ROW]
[ROW][C]27[/C][C]0.103603[/C][C]0.9439[/C][C]0.173989[/C][/ROW]
[ROW][C]28[/C][C]0.0972[/C][C]0.8855[/C][C]0.189213[/C][/ROW]
[ROW][C]29[/C][C]0.084581[/C][C]0.7706[/C][C]0.221575[/C][/ROW]
[ROW][C]30[/C][C]-0.061902[/C][C]-0.564[/C][C]0.287153[/C][/ROW]
[ROW][C]31[/C][C]0.014903[/C][C]0.1358[/C][C]0.446164[/C][/ROW]
[ROW][C]32[/C][C]0.008807[/C][C]0.0802[/C][C]0.468121[/C][/ROW]
[ROW][C]33[/C][C]-0.023696[/C][C]-0.2159[/C][C]0.414805[/C][/ROW]
[ROW][C]34[/C][C]-0.074231[/C][C]-0.6763[/C][C]0.250373[/C][/ROW]
[ROW][C]35[/C][C]-0.096408[/C][C]-0.8783[/C][C]0.191152[/C][/ROW]
[ROW][C]36[/C][C]-0.210549[/C][C]-1.9182[/C][C]0.029262[/C][/ROW]
[/TABLE]
Source: https://freestatistics.org/blog/index.php?pk=65215&T=2

Globally Unique Identifier (entire table): ba.freestatistics.org/blog/index.php?pk=65215&T=2

As an alternative you can also use a QR Code:  

The GUIDs for individual cells are displayed in the table below:

Partial Autocorrelation Function
Time lag kPACF(k)T-STATP-value
1-0.60406-5.50320
2-0.563915-5.13751e-06
3-0.051469-0.46890.320182
4-0.11734-1.0690.144079
5-0.116738-1.06350.145311
60.1674451.52550.065469
70.1062170.96770.168008
8-0.15182-1.38310.085165
9-0.022061-0.2010.420602
10-0.00915-0.08340.466882
11-0.083099-0.75710.225578
12-0.080177-0.73040.233587
13-0.036323-0.33090.370771
14-0.130506-1.1890.118922
150.0717280.65350.25763
16-0.043147-0.39310.347632
17-0.083541-0.76110.224378
180.09670.8810.190437
190.0573390.52240.301397
20-0.12381-1.1280.131293
210.1291771.17690.121308
22-0.219969-2.0040.024165
230.2049181.86690.032724
240.0549160.50030.309092
25-0.023467-0.21380.415617
26-0.067997-0.61950.268648
270.1036030.94390.173989
280.09720.88550.189213
290.0845810.77060.221575
30-0.061902-0.5640.287153
310.0149030.13580.446164
320.0088070.08020.468121
33-0.023696-0.21590.414805
34-0.074231-0.67630.250373
35-0.096408-0.87830.191152
36-0.210549-1.91820.029262


Parameters (Session):
par1 = 36 ; par2 = 0.0 ; par3 = 1 ; par4 = 1 ; par5 = 12 ; par6 = MA ; par7 = 0.95 ;
Parameters (R input):
par1 = 36 ; par2 = 0.0 ; par3 = 1 ; par4 = 1 ; par5 = 12 ; par6 = MA ; par7 = 0.95 ;
R code (references can be found in the software module):
if (par1 == 'Default') {
par1 = 10*log10(length(x))
} else {
par1 <- as.numeric(par1)
}
par2 <- as.numeric(par2)
par3 <- as.numeric(par3)
par4 <- as.numeric(par4)
par5 <- as.numeric(par5)
if (par6 == 'White Noise') par6 <- 'white' else par6 <- 'ma'
par7 <- as.numeric(par7)
if (par2 == 0) {
x <- log(x)
} else {
x <- (x ^ par2 - 1) / par2
}
if (par3 > 0) x <- diff(x,lag=1,difference=par3)
if (par4 > 0) x <- diff(x,lag=par5,difference=par4)
bitmap(file='pic1.png')
racf <- acf(x, par1, main='Autocorrelation', xlab='time lag', ylab='ACF', ci.type=par6, ci=par7, sub=paste('(lambda=',par2,', d=',par3,', D=',par4,', CI=', par7, ', CI type=',par6,')',sep=''))
dev.off()
bitmap(file='pic2.png')
rpacf <- pacf(x,par1,main='Partial Autocorrelation',xlab='lags',ylab='PACF')
dev.off()
(myacf <- c(racf$acf))
(mypacf <- c(rpacf$acf))
lengthx <- length(x)
sqrtn <- sqrt(lengthx)
load(file='createtable')
a<-table.start()
a<-table.row.start(a)
a<-table.element(a,'Autocorrelation Function',4,TRUE)
a<-table.row.end(a)
a<-table.row.start(a)
a<-table.element(a,'Time lag k',header=TRUE)
a<-table.element(a,hyperlink('basics.htm','ACF(k)','click here for more information about the Autocorrelation Function'),header=TRUE)
a<-table.element(a,'T-STAT',header=TRUE)
a<-table.element(a,'P-value',header=TRUE)
a<-table.row.end(a)
for (i in 2:(par1+1)) {
a<-table.row.start(a)
a<-table.element(a,i-1,header=TRUE)
a<-table.element(a,round(myacf[i],6))
mytstat <- myacf[i]*sqrtn
a<-table.element(a,round(mytstat,4))
a<-table.element(a,round(1-pt(abs(mytstat),lengthx),6))
a<-table.row.end(a)
}
a<-table.end(a)
table.save(a,file='mytable.tab')
a<-table.start()
a<-table.row.start(a)
a<-table.element(a,'Partial Autocorrelation Function',4,TRUE)
a<-table.row.end(a)
a<-table.row.start(a)
a<-table.element(a,'Time lag k',header=TRUE)
a<-table.element(a,hyperlink('basics.htm','PACF(k)','click here for more information about the Partial Autocorrelation Function'),header=TRUE)
a<-table.element(a,'T-STAT',header=TRUE)
a<-table.element(a,'P-value',header=TRUE)
a<-table.row.end(a)
for (i in 1:par1) {
a<-table.row.start(a)
a<-table.element(a,i,header=TRUE)
a<-table.element(a,round(mypacf[i],6))
mytstat <- mypacf[i]*sqrtn
a<-table.element(a,round(mytstat,4))
a<-table.element(a,round(1-pt(abs(mytstat),lengthx),6))
a<-table.row.end(a)
}
a<-table.end(a)
table.save(a,file='mytable1.tab')