Free Statistics

of Irreproducible Research!

Author's title

Author*The author of this computation has been verified*
R Software Modulerwasp_multipleregression.wasp
Title produced by softwareMultiple Regression
Date of computationSat, 12 Dec 2009 06:13:05 -0700
Cite this page as followsStatistical Computations at FreeStatistics.org, Office for Research Development and Education, URL https://freestatistics.org/blog/index.php?v=date/2009/Dec/12/t12606236469ljkkidb8d6js8u.htm/, Retrieved Mon, 06 May 2024 02:37:26 +0000
Statistical Computations at FreeStatistics.org, Office for Research Development and Education, URL https://freestatistics.org/blog/index.php?pk=66933, Retrieved Mon, 06 May 2024 02:37:26 +0000
QR Codes:

Original text written by user:
IsPrivate?No (this computation is public)
User-defined keywords
Estimated Impact97
Family? (F = Feedback message, R = changed R code, M = changed R Module, P = changed Parameters, D = changed Data)
-     [Multiple Regression] [Q1 The Seatbeltlaw] [2007-11-14 19:27:43] [8cd6641b921d30ebe00b648d1481bba0]
- RMPD  [Multiple Regression] [Seatbelt] [2009-11-12 13:54:52] [b98453cac15ba1066b407e146608df68]
-   PD    [Multiple Regression] [] [2009-11-17 19:35:42] [5edbdb7a459c4059b6c3b063ba86821c]
-    D        [Multiple Regression] [] [2009-12-12 13:13:05] [24029b2c7217429de6ff94b5379eb52c] [Current]
Feedback Forum

Post a new message
Dataseries X:
30.3	122.5	19	80.2
29	122.4	18	74.8
30.3	121.9	19	77.8
32	122.2	19	73
30.3	123.7	22	72
28	122.6	23	75.8
27.7	115.7	20	72.6
27	116.1	14	71.9
28.7	120.5	14	74.8
29.7	122.6	14	72.9
23	119.9	15	72.9
28	120.7	11	79.9
32	120.2	17	74
27	122.1	16	76
27.7	119.3	20	69.6
30.7	121.7	24	77.3
33	113.5	23	75.2
34.3	123.7	20	75.8
26	123.4	21	77.6
30.3	126.4	19	76.7
37.7	124.1	23	77
36.3	125.6	23	77.9
36.3	124.8	23	76.7
36.7	123	23	71.9
33.7	126.9	27	73.4
33.7	127.3	26	72.5
32.7	129	17	73.7
37.3	126.2	24	69.5
37	125.4	26	74.7
37.3	126.3	24	72.5
41.7	126.3	27	72.1
40.7	128.4	27	70.7
38.7	127.2	26	71.4
38.3	128.5	24	69.5
38.3	129	23	73.5
36.7	128.9	23	72.4
37.3	128.3	24	74.5
36.7	124.6	17	72.2
36	126.2	21	73
33.3	129.1	19	73.3
28.7	127.3	22	71.3
33.7	129.2	22	73.6
31	130.4	18	71.3
29.3	125.9	16	71.2
27.3	135.8	14	81.4
30.3	126.4	12	76.1
16.7	129.5	14	71.1
14.7	128.4	16	75.7
13.3	125.6	8	70
12.3	127.7	3	68.5
10	126.4	0	56.7
1.7	124.2	5	57.9
2.3	126.4	1	58.8
2.7	123.7	1	59.3
0.4	121.8	3	61.3
6.1	124	6	62.9
7.1	122.7	7	61.4
11.4	122.9	8	64.5
11.4	121	14	63.8
8.2	122.8	14	61.6
11.9	122.9	13	64.7


Summary of computational transaction
Raw Inputview raw input (R code)
Raw Outputview raw output of R engine
Computing time4 seconds
R Server'Gwilym Jenkins' @ 72.249.127.135
R Framework error message
The field 'Names of X columns' contains a hard return which cannot be interpreted.
Please, resubmit your request without hard returns in the 'Names of X columns'.

\begin{tabular}{lllllllll}
\hline
Summary of computational transaction \tabularnewline
Raw Input & view raw input (R code)  \tabularnewline
Raw Output & view raw output of R engine  \tabularnewline
Computing time & 4 seconds \tabularnewline
R Server & 'Gwilym Jenkins' @ 72.249.127.135 \tabularnewline
R Framework error message & 
The field 'Names of X columns' contains a hard return which cannot be interpreted.
Please, resubmit your request without hard returns in the 'Names of X columns'.
\tabularnewline \hline \end{tabular} %Source: https://freestatistics.org/blog/index.php?pk=66933&T=0

[TABLE]
[ROW][C]Summary of computational transaction[/C][/ROW]
[ROW][C]Raw Input[/C][C]view raw input (R code) [/C][/ROW]
[ROW][C]Raw Output[/C][C]view raw output of R engine [/C][/ROW]
[ROW][C]Computing time[/C][C]4 seconds[/C][/ROW]
[ROW][C]R Server[/C][C]'Gwilym Jenkins' @ 72.249.127.135[/C][/ROW]
[ROW][C]R Framework error message[/C][C]
The field 'Names of X columns' contains a hard return which cannot be interpreted.
Please, resubmit your request without hard returns in the 'Names of X columns'.
[/C][/ROW] [/TABLE] Source: https://freestatistics.org/blog/index.php?pk=66933&T=0

Globally Unique Identifier (entire table): ba.freestatistics.org/blog/index.php?pk=66933&T=0

As an alternative you can also use a QR Code:  

The GUIDs for individual cells are displayed in the table below:

Summary of computational transaction
Raw Inputview raw input (R code)
Raw Outputview raw output of R engine
Computing time4 seconds
R Server'Gwilym Jenkins' @ 72.249.127.135
R Framework error message
The field 'Names of X columns' contains a hard return which cannot be interpreted.
Please, resubmit your request without hard returns in the 'Names of X columns'.


Multiple Linear Regression - Estimated Regression Equation
indcvtr[t] = + 13.4250498085512 + 0.578408538017413handel[t] -0.0691616293850647ntdzcg[t] -0.0423978091817987`dzcg `[t] + e[t]

\begin{tabular}{lllllllll}
\hline
Multiple Linear Regression - Estimated Regression Equation \tabularnewline
indcvtr[t] =  +  13.4250498085512 +  0.578408538017413handel[t] -0.0691616293850647ntdzcg[t] -0.0423978091817987`dzcg
`[t]  + e[t] \tabularnewline
\hline
\end{tabular}
%Source: https://freestatistics.org/blog/index.php?pk=66933&T=1

[TABLE]
[ROW][C]Multiple Linear Regression - Estimated Regression Equation[/C][/ROW]
[ROW][C]indcvtr[t] =  +  13.4250498085512 +  0.578408538017413handel[t] -0.0691616293850647ntdzcg[t] -0.0423978091817987`dzcg
`[t]  + e[t][/C][/ROW]
[/TABLE]
Source: https://freestatistics.org/blog/index.php?pk=66933&T=1

Globally Unique Identifier (entire table): ba.freestatistics.org/blog/index.php?pk=66933&T=1

As an alternative you can also use a QR Code:  

The GUIDs for individual cells are displayed in the table below:

Multiple Linear Regression - Estimated Regression Equation
indcvtr[t] = + 13.4250498085512 + 0.578408538017413handel[t] -0.0691616293850647ntdzcg[t] -0.0423978091817987`dzcg `[t] + e[t]


Multiple Linear Regression - Ordinary Least Squares
VariableParameterS.D.T-STATH0: parameter = 02-tail p-value1-tail p-value
(Intercept)13.425049808551217.0439530.78770.4341520.217076
handel0.5784085380174130.0598859.658700
ntdzcg-0.06916162938506470.11903-0.5810.5635010.28175
`dzcg `-0.04239780918179870.118185-0.35870.7211150.360557

\begin{tabular}{lllllllll}
\hline
Multiple Linear Regression - Ordinary Least Squares \tabularnewline
Variable & Parameter & S.D. & T-STATH0: parameter = 0 & 2-tail p-value & 1-tail p-value \tabularnewline
(Intercept) & 13.4250498085512 & 17.043953 & 0.7877 & 0.434152 & 0.217076 \tabularnewline
handel & 0.578408538017413 & 0.059885 & 9.6587 & 0 & 0 \tabularnewline
ntdzcg & -0.0691616293850647 & 0.11903 & -0.581 & 0.563501 & 0.28175 \tabularnewline
`dzcg
` & -0.0423978091817987 & 0.118185 & -0.3587 & 0.721115 & 0.360557 \tabularnewline
\hline
\end{tabular}
%Source: https://freestatistics.org/blog/index.php?pk=66933&T=2

[TABLE]
[ROW][C]Multiple Linear Regression - Ordinary Least Squares[/C][/ROW]
[ROW][C]Variable[/C][C]Parameter[/C][C]S.D.[/C][C]T-STATH0: parameter = 0[/C][C]2-tail p-value[/C][C]1-tail p-value[/C][/ROW]
[ROW][C](Intercept)[/C][C]13.4250498085512[/C][C]17.043953[/C][C]0.7877[/C][C]0.434152[/C][C]0.217076[/C][/ROW]
[ROW][C]handel[/C][C]0.578408538017413[/C][C]0.059885[/C][C]9.6587[/C][C]0[/C][C]0[/C][/ROW]
[ROW][C]ntdzcg[/C][C]-0.0691616293850647[/C][C]0.11903[/C][C]-0.581[/C][C]0.563501[/C][C]0.28175[/C][/ROW]
[ROW][C]`dzcg
`[/C][C]-0.0423978091817987[/C][C]0.118185[/C][C]-0.3587[/C][C]0.721115[/C][C]0.360557[/C][/ROW]
[/TABLE]
Source: https://freestatistics.org/blog/index.php?pk=66933&T=2

Globally Unique Identifier (entire table): ba.freestatistics.org/blog/index.php?pk=66933&T=2

As an alternative you can also use a QR Code:  

The GUIDs for individual cells are displayed in the table below:

Multiple Linear Regression - Ordinary Least Squares
VariableParameterS.D.T-STATH0: parameter = 02-tail p-value1-tail p-value
(Intercept)13.425049808551217.0439530.78770.4341520.217076
handel0.5784085380174130.0598859.658700
ntdzcg-0.06916162938506470.11903-0.5810.5635010.28175
`dzcg `-0.04239780918179870.118185-0.35870.7211150.360557


Multiple Linear Regression - Regression Statistics
Multiple R0.884289513225906
R-squared0.78196794320131
Adjusted R-squared0.770492571790852
F-TEST (value)68.1431489431977
F-TEST (DF numerator)3
F-TEST (DF denominator)57
p-value0
Multiple Linear Regression - Residual Statistics
Residual Standard Deviation3.44092278375916
Sum Squared Residuals674.877127416195

\begin{tabular}{lllllllll}
\hline
Multiple Linear Regression - Regression Statistics \tabularnewline
Multiple R & 0.884289513225906 \tabularnewline
R-squared & 0.78196794320131 \tabularnewline
Adjusted R-squared & 0.770492571790852 \tabularnewline
F-TEST (value) & 68.1431489431977 \tabularnewline
F-TEST (DF numerator) & 3 \tabularnewline
F-TEST (DF denominator) & 57 \tabularnewline
p-value & 0 \tabularnewline
Multiple Linear Regression - Residual Statistics \tabularnewline
Residual Standard Deviation & 3.44092278375916 \tabularnewline
Sum Squared Residuals & 674.877127416195 \tabularnewline
\hline
\end{tabular}
%Source: https://freestatistics.org/blog/index.php?pk=66933&T=3

[TABLE]
[ROW][C]Multiple Linear Regression - Regression Statistics[/C][/ROW]
[ROW][C]Multiple R[/C][C]0.884289513225906[/C][/ROW]
[ROW][C]R-squared[/C][C]0.78196794320131[/C][/ROW]
[ROW][C]Adjusted R-squared[/C][C]0.770492571790852[/C][/ROW]
[ROW][C]F-TEST (value)[/C][C]68.1431489431977[/C][/ROW]
[ROW][C]F-TEST (DF numerator)[/C][C]3[/C][/ROW]
[ROW][C]F-TEST (DF denominator)[/C][C]57[/C][/ROW]
[ROW][C]p-value[/C][C]0[/C][/ROW]
[ROW][C]Multiple Linear Regression - Residual Statistics[/C][/ROW]
[ROW][C]Residual Standard Deviation[/C][C]3.44092278375916[/C][/ROW]
[ROW][C]Sum Squared Residuals[/C][C]674.877127416195[/C][/ROW]
[/TABLE]
Source: https://freestatistics.org/blog/index.php?pk=66933&T=3

Globally Unique Identifier (entire table): ba.freestatistics.org/blog/index.php?pk=66933&T=3

As an alternative you can also use a QR Code:  

The GUIDs for individual cells are displayed in the table below:

Multiple Linear Regression - Regression Statistics
Multiple R0.884289513225906
R-squared0.78196794320131
Adjusted R-squared0.770492571790852
F-TEST (value)68.1431489431977
F-TEST (DF numerator)3
F-TEST (DF denominator)57
p-value0
Multiple Linear Regression - Residual Statistics
Residual Standard Deviation3.44092278375916
Sum Squared Residuals674.877127416195


Multiple Linear Regression - Actuals, Interpolation, and Residuals
Time or IndexActualsInterpolationForecastResidualsPrediction Error
11919.0782246144281-0.0782246144281225
21818.5621578475258-0.562157847525757
31919.2214763340955-0.221476334095520
41920.3875318439822-1.38753184398224
52219.34289269445682.65710730554316
62317.92751917444955.07248082555048
72018.3668848451831.633115154817
81417.9640126832440-3.96401268324405
91418.5200423819521-4.52004238195215
101419.0337673357063-5.03376733570634
111515.3451665303293-0.345166530329350
121117.8850952526358-6.88509525263577
131720.4834572935706-3.48345729357057
141617.3752118892883-1.37521188928828
152018.24509640694221.75490359305784
162419.48787097977044.5121290202296
172321.47437137744981.52562862255025
182021.4954151716356-1.49541517163565
192116.63905673837944.36094326162059
201918.95688659196270.0431134080372923
212323.3834621781227-0.383462178122674
222322.43178975255710.568210247442923
232322.53799642708330.462003572916713
242323.097360259256-0.0973602592560044
252721.02880757682935.97119242317068
262621.03930095333894.96069904666109
271720.2924402743487-3.29244027434873
282423.32484291007060.675157089929441
292622.98618104442803.01381895557197
302423.19073331958670.809266680413343
312725.7526900105361.24730998946400
322725.08839898366451.91160101633553
332623.98489739646452.01510260353554
342423.74417970050230.255820299497676
352323.5400076490826-0.540007649082596
362322.66810774129320.331892258706777
372422.96761444245291.03238555754707
381722.9739823094854-5.97398230948536
392122.4245194785116-1.42451947851163
401920.6495283578934-1.64952835789339
412218.198135634273.80186436573
422220.86125626740731.13874373259269
431819.3140742206164-1.31407422061635
441618.6462468191377-2.64624681913772
451416.3722719585364-2.37227195853641
461218.9823252774718-6.98232527747179
471411.11355715525032.88644284474973
48169.837787949302746.16221205069726
4989.4633360706928-1.46333607069279
5038.80328482473944-5.80328482473944
5108.0631494538452-8.0631494538452
5253.363636801929661.63636319807034
5313.52036831182935-2.52036831182935
5413.91726922178509-2.91726922178509
5532.633541061813060.366458938186937
5665.71047764917430.289522350825702
5776.442393019164990.557606980835009
5888.78428419829928-0.784284198299278
59148.945369760558165.05463023944184
60147.063246686209286.93675331379072
61139.065008905471623.93499109452838

\begin{tabular}{lllllllll}
\hline
Multiple Linear Regression - Actuals, Interpolation, and Residuals \tabularnewline
Time or Index & Actuals & InterpolationForecast & ResidualsPrediction Error \tabularnewline
1 & 19 & 19.0782246144281 & -0.0782246144281225 \tabularnewline
2 & 18 & 18.5621578475258 & -0.562157847525757 \tabularnewline
3 & 19 & 19.2214763340955 & -0.221476334095520 \tabularnewline
4 & 19 & 20.3875318439822 & -1.38753184398224 \tabularnewline
5 & 22 & 19.3428926944568 & 2.65710730554316 \tabularnewline
6 & 23 & 17.9275191744495 & 5.07248082555048 \tabularnewline
7 & 20 & 18.366884845183 & 1.633115154817 \tabularnewline
8 & 14 & 17.9640126832440 & -3.96401268324405 \tabularnewline
9 & 14 & 18.5200423819521 & -4.52004238195215 \tabularnewline
10 & 14 & 19.0337673357063 & -5.03376733570634 \tabularnewline
11 & 15 & 15.3451665303293 & -0.345166530329350 \tabularnewline
12 & 11 & 17.8850952526358 & -6.88509525263577 \tabularnewline
13 & 17 & 20.4834572935706 & -3.48345729357057 \tabularnewline
14 & 16 & 17.3752118892883 & -1.37521188928828 \tabularnewline
15 & 20 & 18.2450964069422 & 1.75490359305784 \tabularnewline
16 & 24 & 19.4878709797704 & 4.5121290202296 \tabularnewline
17 & 23 & 21.4743713774498 & 1.52562862255025 \tabularnewline
18 & 20 & 21.4954151716356 & -1.49541517163565 \tabularnewline
19 & 21 & 16.6390567383794 & 4.36094326162059 \tabularnewline
20 & 19 & 18.9568865919627 & 0.0431134080372923 \tabularnewline
21 & 23 & 23.3834621781227 & -0.383462178122674 \tabularnewline
22 & 23 & 22.4317897525571 & 0.568210247442923 \tabularnewline
23 & 23 & 22.5379964270833 & 0.462003572916713 \tabularnewline
24 & 23 & 23.097360259256 & -0.0973602592560044 \tabularnewline
25 & 27 & 21.0288075768293 & 5.97119242317068 \tabularnewline
26 & 26 & 21.0393009533389 & 4.96069904666109 \tabularnewline
27 & 17 & 20.2924402743487 & -3.29244027434873 \tabularnewline
28 & 24 & 23.3248429100706 & 0.675157089929441 \tabularnewline
29 & 26 & 22.9861810444280 & 3.01381895557197 \tabularnewline
30 & 24 & 23.1907333195867 & 0.809266680413343 \tabularnewline
31 & 27 & 25.752690010536 & 1.24730998946400 \tabularnewline
32 & 27 & 25.0883989836645 & 1.91160101633553 \tabularnewline
33 & 26 & 23.9848973964645 & 2.01510260353554 \tabularnewline
34 & 24 & 23.7441797005023 & 0.255820299497676 \tabularnewline
35 & 23 & 23.5400076490826 & -0.540007649082596 \tabularnewline
36 & 23 & 22.6681077412932 & 0.331892258706777 \tabularnewline
37 & 24 & 22.9676144424529 & 1.03238555754707 \tabularnewline
38 & 17 & 22.9739823094854 & -5.97398230948536 \tabularnewline
39 & 21 & 22.4245194785116 & -1.42451947851163 \tabularnewline
40 & 19 & 20.6495283578934 & -1.64952835789339 \tabularnewline
41 & 22 & 18.19813563427 & 3.80186436573 \tabularnewline
42 & 22 & 20.8612562674073 & 1.13874373259269 \tabularnewline
43 & 18 & 19.3140742206164 & -1.31407422061635 \tabularnewline
44 & 16 & 18.6462468191377 & -2.64624681913772 \tabularnewline
45 & 14 & 16.3722719585364 & -2.37227195853641 \tabularnewline
46 & 12 & 18.9823252774718 & -6.98232527747179 \tabularnewline
47 & 14 & 11.1135571552503 & 2.88644284474973 \tabularnewline
48 & 16 & 9.83778794930274 & 6.16221205069726 \tabularnewline
49 & 8 & 9.4633360706928 & -1.46333607069279 \tabularnewline
50 & 3 & 8.80328482473944 & -5.80328482473944 \tabularnewline
51 & 0 & 8.0631494538452 & -8.0631494538452 \tabularnewline
52 & 5 & 3.36363680192966 & 1.63636319807034 \tabularnewline
53 & 1 & 3.52036831182935 & -2.52036831182935 \tabularnewline
54 & 1 & 3.91726922178509 & -2.91726922178509 \tabularnewline
55 & 3 & 2.63354106181306 & 0.366458938186937 \tabularnewline
56 & 6 & 5.7104776491743 & 0.289522350825702 \tabularnewline
57 & 7 & 6.44239301916499 & 0.557606980835009 \tabularnewline
58 & 8 & 8.78428419829928 & -0.784284198299278 \tabularnewline
59 & 14 & 8.94536976055816 & 5.05463023944184 \tabularnewline
60 & 14 & 7.06324668620928 & 6.93675331379072 \tabularnewline
61 & 13 & 9.06500890547162 & 3.93499109452838 \tabularnewline
\hline
\end{tabular}
%Source: https://freestatistics.org/blog/index.php?pk=66933&T=4

[TABLE]
[ROW][C]Multiple Linear Regression - Actuals, Interpolation, and Residuals[/C][/ROW]
[ROW][C]Time or Index[/C][C]Actuals[/C][C]InterpolationForecast[/C][C]ResidualsPrediction Error[/C][/ROW]
[ROW][C]1[/C][C]19[/C][C]19.0782246144281[/C][C]-0.0782246144281225[/C][/ROW]
[ROW][C]2[/C][C]18[/C][C]18.5621578475258[/C][C]-0.562157847525757[/C][/ROW]
[ROW][C]3[/C][C]19[/C][C]19.2214763340955[/C][C]-0.221476334095520[/C][/ROW]
[ROW][C]4[/C][C]19[/C][C]20.3875318439822[/C][C]-1.38753184398224[/C][/ROW]
[ROW][C]5[/C][C]22[/C][C]19.3428926944568[/C][C]2.65710730554316[/C][/ROW]
[ROW][C]6[/C][C]23[/C][C]17.9275191744495[/C][C]5.07248082555048[/C][/ROW]
[ROW][C]7[/C][C]20[/C][C]18.366884845183[/C][C]1.633115154817[/C][/ROW]
[ROW][C]8[/C][C]14[/C][C]17.9640126832440[/C][C]-3.96401268324405[/C][/ROW]
[ROW][C]9[/C][C]14[/C][C]18.5200423819521[/C][C]-4.52004238195215[/C][/ROW]
[ROW][C]10[/C][C]14[/C][C]19.0337673357063[/C][C]-5.03376733570634[/C][/ROW]
[ROW][C]11[/C][C]15[/C][C]15.3451665303293[/C][C]-0.345166530329350[/C][/ROW]
[ROW][C]12[/C][C]11[/C][C]17.8850952526358[/C][C]-6.88509525263577[/C][/ROW]
[ROW][C]13[/C][C]17[/C][C]20.4834572935706[/C][C]-3.48345729357057[/C][/ROW]
[ROW][C]14[/C][C]16[/C][C]17.3752118892883[/C][C]-1.37521188928828[/C][/ROW]
[ROW][C]15[/C][C]20[/C][C]18.2450964069422[/C][C]1.75490359305784[/C][/ROW]
[ROW][C]16[/C][C]24[/C][C]19.4878709797704[/C][C]4.5121290202296[/C][/ROW]
[ROW][C]17[/C][C]23[/C][C]21.4743713774498[/C][C]1.52562862255025[/C][/ROW]
[ROW][C]18[/C][C]20[/C][C]21.4954151716356[/C][C]-1.49541517163565[/C][/ROW]
[ROW][C]19[/C][C]21[/C][C]16.6390567383794[/C][C]4.36094326162059[/C][/ROW]
[ROW][C]20[/C][C]19[/C][C]18.9568865919627[/C][C]0.0431134080372923[/C][/ROW]
[ROW][C]21[/C][C]23[/C][C]23.3834621781227[/C][C]-0.383462178122674[/C][/ROW]
[ROW][C]22[/C][C]23[/C][C]22.4317897525571[/C][C]0.568210247442923[/C][/ROW]
[ROW][C]23[/C][C]23[/C][C]22.5379964270833[/C][C]0.462003572916713[/C][/ROW]
[ROW][C]24[/C][C]23[/C][C]23.097360259256[/C][C]-0.0973602592560044[/C][/ROW]
[ROW][C]25[/C][C]27[/C][C]21.0288075768293[/C][C]5.97119242317068[/C][/ROW]
[ROW][C]26[/C][C]26[/C][C]21.0393009533389[/C][C]4.96069904666109[/C][/ROW]
[ROW][C]27[/C][C]17[/C][C]20.2924402743487[/C][C]-3.29244027434873[/C][/ROW]
[ROW][C]28[/C][C]24[/C][C]23.3248429100706[/C][C]0.675157089929441[/C][/ROW]
[ROW][C]29[/C][C]26[/C][C]22.9861810444280[/C][C]3.01381895557197[/C][/ROW]
[ROW][C]30[/C][C]24[/C][C]23.1907333195867[/C][C]0.809266680413343[/C][/ROW]
[ROW][C]31[/C][C]27[/C][C]25.752690010536[/C][C]1.24730998946400[/C][/ROW]
[ROW][C]32[/C][C]27[/C][C]25.0883989836645[/C][C]1.91160101633553[/C][/ROW]
[ROW][C]33[/C][C]26[/C][C]23.9848973964645[/C][C]2.01510260353554[/C][/ROW]
[ROW][C]34[/C][C]24[/C][C]23.7441797005023[/C][C]0.255820299497676[/C][/ROW]
[ROW][C]35[/C][C]23[/C][C]23.5400076490826[/C][C]-0.540007649082596[/C][/ROW]
[ROW][C]36[/C][C]23[/C][C]22.6681077412932[/C][C]0.331892258706777[/C][/ROW]
[ROW][C]37[/C][C]24[/C][C]22.9676144424529[/C][C]1.03238555754707[/C][/ROW]
[ROW][C]38[/C][C]17[/C][C]22.9739823094854[/C][C]-5.97398230948536[/C][/ROW]
[ROW][C]39[/C][C]21[/C][C]22.4245194785116[/C][C]-1.42451947851163[/C][/ROW]
[ROW][C]40[/C][C]19[/C][C]20.6495283578934[/C][C]-1.64952835789339[/C][/ROW]
[ROW][C]41[/C][C]22[/C][C]18.19813563427[/C][C]3.80186436573[/C][/ROW]
[ROW][C]42[/C][C]22[/C][C]20.8612562674073[/C][C]1.13874373259269[/C][/ROW]
[ROW][C]43[/C][C]18[/C][C]19.3140742206164[/C][C]-1.31407422061635[/C][/ROW]
[ROW][C]44[/C][C]16[/C][C]18.6462468191377[/C][C]-2.64624681913772[/C][/ROW]
[ROW][C]45[/C][C]14[/C][C]16.3722719585364[/C][C]-2.37227195853641[/C][/ROW]
[ROW][C]46[/C][C]12[/C][C]18.9823252774718[/C][C]-6.98232527747179[/C][/ROW]
[ROW][C]47[/C][C]14[/C][C]11.1135571552503[/C][C]2.88644284474973[/C][/ROW]
[ROW][C]48[/C][C]16[/C][C]9.83778794930274[/C][C]6.16221205069726[/C][/ROW]
[ROW][C]49[/C][C]8[/C][C]9.4633360706928[/C][C]-1.46333607069279[/C][/ROW]
[ROW][C]50[/C][C]3[/C][C]8.80328482473944[/C][C]-5.80328482473944[/C][/ROW]
[ROW][C]51[/C][C]0[/C][C]8.0631494538452[/C][C]-8.0631494538452[/C][/ROW]
[ROW][C]52[/C][C]5[/C][C]3.36363680192966[/C][C]1.63636319807034[/C][/ROW]
[ROW][C]53[/C][C]1[/C][C]3.52036831182935[/C][C]-2.52036831182935[/C][/ROW]
[ROW][C]54[/C][C]1[/C][C]3.91726922178509[/C][C]-2.91726922178509[/C][/ROW]
[ROW][C]55[/C][C]3[/C][C]2.63354106181306[/C][C]0.366458938186937[/C][/ROW]
[ROW][C]56[/C][C]6[/C][C]5.7104776491743[/C][C]0.289522350825702[/C][/ROW]
[ROW][C]57[/C][C]7[/C][C]6.44239301916499[/C][C]0.557606980835009[/C][/ROW]
[ROW][C]58[/C][C]8[/C][C]8.78428419829928[/C][C]-0.784284198299278[/C][/ROW]
[ROW][C]59[/C][C]14[/C][C]8.94536976055816[/C][C]5.05463023944184[/C][/ROW]
[ROW][C]60[/C][C]14[/C][C]7.06324668620928[/C][C]6.93675331379072[/C][/ROW]
[ROW][C]61[/C][C]13[/C][C]9.06500890547162[/C][C]3.93499109452838[/C][/ROW]
[/TABLE]
Source: https://freestatistics.org/blog/index.php?pk=66933&T=4

Globally Unique Identifier (entire table): ba.freestatistics.org/blog/index.php?pk=66933&T=4

As an alternative you can also use a QR Code:  

The GUIDs for individual cells are displayed in the table below:

Multiple Linear Regression - Actuals, Interpolation, and Residuals
Time or IndexActualsInterpolationForecastResidualsPrediction Error
11919.0782246144281-0.0782246144281225
21818.5621578475258-0.562157847525757
31919.2214763340955-0.221476334095520
41920.3875318439822-1.38753184398224
52219.34289269445682.65710730554316
62317.92751917444955.07248082555048
72018.3668848451831.633115154817
81417.9640126832440-3.96401268324405
91418.5200423819521-4.52004238195215
101419.0337673357063-5.03376733570634
111515.3451665303293-0.345166530329350
121117.8850952526358-6.88509525263577
131720.4834572935706-3.48345729357057
141617.3752118892883-1.37521188928828
152018.24509640694221.75490359305784
162419.48787097977044.5121290202296
172321.47437137744981.52562862255025
182021.4954151716356-1.49541517163565
192116.63905673837944.36094326162059
201918.95688659196270.0431134080372923
212323.3834621781227-0.383462178122674
222322.43178975255710.568210247442923
232322.53799642708330.462003572916713
242323.097360259256-0.0973602592560044
252721.02880757682935.97119242317068
262621.03930095333894.96069904666109
271720.2924402743487-3.29244027434873
282423.32484291007060.675157089929441
292622.98618104442803.01381895557197
302423.19073331958670.809266680413343
312725.7526900105361.24730998946400
322725.08839898366451.91160101633553
332623.98489739646452.01510260353554
342423.74417970050230.255820299497676
352323.5400076490826-0.540007649082596
362322.66810774129320.331892258706777
372422.96761444245291.03238555754707
381722.9739823094854-5.97398230948536
392122.4245194785116-1.42451947851163
401920.6495283578934-1.64952835789339
412218.198135634273.80186436573
422220.86125626740731.13874373259269
431819.3140742206164-1.31407422061635
441618.6462468191377-2.64624681913772
451416.3722719585364-2.37227195853641
461218.9823252774718-6.98232527747179
471411.11355715525032.88644284474973
48169.837787949302746.16221205069726
4989.4633360706928-1.46333607069279
5038.80328482473944-5.80328482473944
5108.0631494538452-8.0631494538452
5253.363636801929661.63636319807034
5313.52036831182935-2.52036831182935
5413.91726922178509-2.91726922178509
5532.633541061813060.366458938186937
5665.71047764917430.289522350825702
5776.442393019164990.557606980835009
5888.78428419829928-0.784284198299278
59148.945369760558165.05463023944184
60147.063246686209286.93675331379072
61139.065008905471623.93499109452838


Goldfeld-Quandt test for Heteroskedasticity
p-valuesAlternative Hypothesis
breakpoint indexgreater2-sidedless
70.1788410083719310.3576820167438620.82115899162807
80.3787962487579720.7575924975159430.621203751242028
90.5242591549581330.9514816900837330.475740845041867
100.6570240583254990.6859518833490020.342975941674501
110.5577393047840420.8845213904319150.442260695215958
120.746725717765330.506548564469340.25327428223467
130.7046109526421550.590778094715690.295389047357845
140.631398079236570.737203841526860.36860192076343
150.5580456353417930.8839087293164130.441954364658207
160.6897145247443690.6205709505112630.310285475255631
170.6733021735523150.653395652895370.326697826447685
180.6197499884824960.7605000230350090.380250011517504
190.6563266211475780.6873467577048450.343673378852422
200.5759170300231660.8481659399536690.424082969976834
210.503005590933090.993988818133820.49699440906691
220.4258068486397890.8516136972795770.574193151360211
230.35321867242940.70643734485880.6467813275706
240.2893725900974190.5787451801948380.710627409902581
250.3755112723259380.7510225446518760.624488727674062
260.3884672943801370.7769345887602730.611532705619863
270.4474451104382140.8948902208764280.552554889561786
280.3749551381177420.7499102762354840.625044861882258
290.3282141873025670.6564283746051340.671785812697433
300.2619578775274230.5239157550548460.738042122472577
310.2062473866707420.4124947733414830.793752613329258
320.1764790244239480.3529580488478970.823520975576052
330.1488725458144220.2977450916288430.851127454185578
340.1276750446917010.2553500893834010.872324955308299
350.1007103232221280.2014206464442560.899289676777872
360.08177017101746760.1635403420349350.918229828982532
370.06601410869238850.1320282173847770.933985891307612
380.1291625213001270.2583250426002530.870837478699873
390.09733587258146780.1946717451629360.902664127418532
400.07294267359284280.1458853471856860.927057326407157
410.08787834599385310.1757566919877060.912121654006147
420.08796200018717050.1759240003743410.91203799981283
430.1102111567801900.2204223135603790.88978884321981
440.08973376043468150.1794675208693630.910266239565318
450.07007956750535480.1401591350107100.929920432494645
460.2000840260728570.4001680521457150.799915973927143
470.2402120701489470.4804241402978950.759787929851053
480.5608998834067960.8782002331864070.439100116593204
490.4669880388261940.9339760776523880.533011961173806
500.4283212205735370.8566424411470730.571678779426463
510.6581924321740160.6836151356519690.341807567825984
520.5801469772104360.8397060455791280.419853022789564
530.4439605877800660.8879211755601320.556039412219934
540.4467451118957360.8934902237914710.553254888104264

\begin{tabular}{lllllllll}
\hline
Goldfeld-Quandt test for Heteroskedasticity \tabularnewline
p-values & Alternative Hypothesis \tabularnewline
breakpoint index & greater & 2-sided & less \tabularnewline
7 & 0.178841008371931 & 0.357682016743862 & 0.82115899162807 \tabularnewline
8 & 0.378796248757972 & 0.757592497515943 & 0.621203751242028 \tabularnewline
9 & 0.524259154958133 & 0.951481690083733 & 0.475740845041867 \tabularnewline
10 & 0.657024058325499 & 0.685951883349002 & 0.342975941674501 \tabularnewline
11 & 0.557739304784042 & 0.884521390431915 & 0.442260695215958 \tabularnewline
12 & 0.74672571776533 & 0.50654856446934 & 0.25327428223467 \tabularnewline
13 & 0.704610952642155 & 0.59077809471569 & 0.295389047357845 \tabularnewline
14 & 0.63139807923657 & 0.73720384152686 & 0.36860192076343 \tabularnewline
15 & 0.558045635341793 & 0.883908729316413 & 0.441954364658207 \tabularnewline
16 & 0.689714524744369 & 0.620570950511263 & 0.310285475255631 \tabularnewline
17 & 0.673302173552315 & 0.65339565289537 & 0.326697826447685 \tabularnewline
18 & 0.619749988482496 & 0.760500023035009 & 0.380250011517504 \tabularnewline
19 & 0.656326621147578 & 0.687346757704845 & 0.343673378852422 \tabularnewline
20 & 0.575917030023166 & 0.848165939953669 & 0.424082969976834 \tabularnewline
21 & 0.50300559093309 & 0.99398881813382 & 0.49699440906691 \tabularnewline
22 & 0.425806848639789 & 0.851613697279577 & 0.574193151360211 \tabularnewline
23 & 0.3532186724294 & 0.7064373448588 & 0.6467813275706 \tabularnewline
24 & 0.289372590097419 & 0.578745180194838 & 0.710627409902581 \tabularnewline
25 & 0.375511272325938 & 0.751022544651876 & 0.624488727674062 \tabularnewline
26 & 0.388467294380137 & 0.776934588760273 & 0.611532705619863 \tabularnewline
27 & 0.447445110438214 & 0.894890220876428 & 0.552554889561786 \tabularnewline
28 & 0.374955138117742 & 0.749910276235484 & 0.625044861882258 \tabularnewline
29 & 0.328214187302567 & 0.656428374605134 & 0.671785812697433 \tabularnewline
30 & 0.261957877527423 & 0.523915755054846 & 0.738042122472577 \tabularnewline
31 & 0.206247386670742 & 0.412494773341483 & 0.793752613329258 \tabularnewline
32 & 0.176479024423948 & 0.352958048847897 & 0.823520975576052 \tabularnewline
33 & 0.148872545814422 & 0.297745091628843 & 0.851127454185578 \tabularnewline
34 & 0.127675044691701 & 0.255350089383401 & 0.872324955308299 \tabularnewline
35 & 0.100710323222128 & 0.201420646444256 & 0.899289676777872 \tabularnewline
36 & 0.0817701710174676 & 0.163540342034935 & 0.918229828982532 \tabularnewline
37 & 0.0660141086923885 & 0.132028217384777 & 0.933985891307612 \tabularnewline
38 & 0.129162521300127 & 0.258325042600253 & 0.870837478699873 \tabularnewline
39 & 0.0973358725814678 & 0.194671745162936 & 0.902664127418532 \tabularnewline
40 & 0.0729426735928428 & 0.145885347185686 & 0.927057326407157 \tabularnewline
41 & 0.0878783459938531 & 0.175756691987706 & 0.912121654006147 \tabularnewline
42 & 0.0879620001871705 & 0.175924000374341 & 0.91203799981283 \tabularnewline
43 & 0.110211156780190 & 0.220422313560379 & 0.88978884321981 \tabularnewline
44 & 0.0897337604346815 & 0.179467520869363 & 0.910266239565318 \tabularnewline
45 & 0.0700795675053548 & 0.140159135010710 & 0.929920432494645 \tabularnewline
46 & 0.200084026072857 & 0.400168052145715 & 0.799915973927143 \tabularnewline
47 & 0.240212070148947 & 0.480424140297895 & 0.759787929851053 \tabularnewline
48 & 0.560899883406796 & 0.878200233186407 & 0.439100116593204 \tabularnewline
49 & 0.466988038826194 & 0.933976077652388 & 0.533011961173806 \tabularnewline
50 & 0.428321220573537 & 0.856642441147073 & 0.571678779426463 \tabularnewline
51 & 0.658192432174016 & 0.683615135651969 & 0.341807567825984 \tabularnewline
52 & 0.580146977210436 & 0.839706045579128 & 0.419853022789564 \tabularnewline
53 & 0.443960587780066 & 0.887921175560132 & 0.556039412219934 \tabularnewline
54 & 0.446745111895736 & 0.893490223791471 & 0.553254888104264 \tabularnewline
\hline
\end{tabular}
%Source: https://freestatistics.org/blog/index.php?pk=66933&T=5

[TABLE]
[ROW][C]Goldfeld-Quandt test for Heteroskedasticity[/C][/ROW]
[ROW][C]p-values[/C][C]Alternative Hypothesis[/C][/ROW]
[ROW][C]breakpoint index[/C][C]greater[/C][C]2-sided[/C][C]less[/C][/ROW]
[ROW][C]7[/C][C]0.178841008371931[/C][C]0.357682016743862[/C][C]0.82115899162807[/C][/ROW]
[ROW][C]8[/C][C]0.378796248757972[/C][C]0.757592497515943[/C][C]0.621203751242028[/C][/ROW]
[ROW][C]9[/C][C]0.524259154958133[/C][C]0.951481690083733[/C][C]0.475740845041867[/C][/ROW]
[ROW][C]10[/C][C]0.657024058325499[/C][C]0.685951883349002[/C][C]0.342975941674501[/C][/ROW]
[ROW][C]11[/C][C]0.557739304784042[/C][C]0.884521390431915[/C][C]0.442260695215958[/C][/ROW]
[ROW][C]12[/C][C]0.74672571776533[/C][C]0.50654856446934[/C][C]0.25327428223467[/C][/ROW]
[ROW][C]13[/C][C]0.704610952642155[/C][C]0.59077809471569[/C][C]0.295389047357845[/C][/ROW]
[ROW][C]14[/C][C]0.63139807923657[/C][C]0.73720384152686[/C][C]0.36860192076343[/C][/ROW]
[ROW][C]15[/C][C]0.558045635341793[/C][C]0.883908729316413[/C][C]0.441954364658207[/C][/ROW]
[ROW][C]16[/C][C]0.689714524744369[/C][C]0.620570950511263[/C][C]0.310285475255631[/C][/ROW]
[ROW][C]17[/C][C]0.673302173552315[/C][C]0.65339565289537[/C][C]0.326697826447685[/C][/ROW]
[ROW][C]18[/C][C]0.619749988482496[/C][C]0.760500023035009[/C][C]0.380250011517504[/C][/ROW]
[ROW][C]19[/C][C]0.656326621147578[/C][C]0.687346757704845[/C][C]0.343673378852422[/C][/ROW]
[ROW][C]20[/C][C]0.575917030023166[/C][C]0.848165939953669[/C][C]0.424082969976834[/C][/ROW]
[ROW][C]21[/C][C]0.50300559093309[/C][C]0.99398881813382[/C][C]0.49699440906691[/C][/ROW]
[ROW][C]22[/C][C]0.425806848639789[/C][C]0.851613697279577[/C][C]0.574193151360211[/C][/ROW]
[ROW][C]23[/C][C]0.3532186724294[/C][C]0.7064373448588[/C][C]0.6467813275706[/C][/ROW]
[ROW][C]24[/C][C]0.289372590097419[/C][C]0.578745180194838[/C][C]0.710627409902581[/C][/ROW]
[ROW][C]25[/C][C]0.375511272325938[/C][C]0.751022544651876[/C][C]0.624488727674062[/C][/ROW]
[ROW][C]26[/C][C]0.388467294380137[/C][C]0.776934588760273[/C][C]0.611532705619863[/C][/ROW]
[ROW][C]27[/C][C]0.447445110438214[/C][C]0.894890220876428[/C][C]0.552554889561786[/C][/ROW]
[ROW][C]28[/C][C]0.374955138117742[/C][C]0.749910276235484[/C][C]0.625044861882258[/C][/ROW]
[ROW][C]29[/C][C]0.328214187302567[/C][C]0.656428374605134[/C][C]0.671785812697433[/C][/ROW]
[ROW][C]30[/C][C]0.261957877527423[/C][C]0.523915755054846[/C][C]0.738042122472577[/C][/ROW]
[ROW][C]31[/C][C]0.206247386670742[/C][C]0.412494773341483[/C][C]0.793752613329258[/C][/ROW]
[ROW][C]32[/C][C]0.176479024423948[/C][C]0.352958048847897[/C][C]0.823520975576052[/C][/ROW]
[ROW][C]33[/C][C]0.148872545814422[/C][C]0.297745091628843[/C][C]0.851127454185578[/C][/ROW]
[ROW][C]34[/C][C]0.127675044691701[/C][C]0.255350089383401[/C][C]0.872324955308299[/C][/ROW]
[ROW][C]35[/C][C]0.100710323222128[/C][C]0.201420646444256[/C][C]0.899289676777872[/C][/ROW]
[ROW][C]36[/C][C]0.0817701710174676[/C][C]0.163540342034935[/C][C]0.918229828982532[/C][/ROW]
[ROW][C]37[/C][C]0.0660141086923885[/C][C]0.132028217384777[/C][C]0.933985891307612[/C][/ROW]
[ROW][C]38[/C][C]0.129162521300127[/C][C]0.258325042600253[/C][C]0.870837478699873[/C][/ROW]
[ROW][C]39[/C][C]0.0973358725814678[/C][C]0.194671745162936[/C][C]0.902664127418532[/C][/ROW]
[ROW][C]40[/C][C]0.0729426735928428[/C][C]0.145885347185686[/C][C]0.927057326407157[/C][/ROW]
[ROW][C]41[/C][C]0.0878783459938531[/C][C]0.175756691987706[/C][C]0.912121654006147[/C][/ROW]
[ROW][C]42[/C][C]0.0879620001871705[/C][C]0.175924000374341[/C][C]0.91203799981283[/C][/ROW]
[ROW][C]43[/C][C]0.110211156780190[/C][C]0.220422313560379[/C][C]0.88978884321981[/C][/ROW]
[ROW][C]44[/C][C]0.0897337604346815[/C][C]0.179467520869363[/C][C]0.910266239565318[/C][/ROW]
[ROW][C]45[/C][C]0.0700795675053548[/C][C]0.140159135010710[/C][C]0.929920432494645[/C][/ROW]
[ROW][C]46[/C][C]0.200084026072857[/C][C]0.400168052145715[/C][C]0.799915973927143[/C][/ROW]
[ROW][C]47[/C][C]0.240212070148947[/C][C]0.480424140297895[/C][C]0.759787929851053[/C][/ROW]
[ROW][C]48[/C][C]0.560899883406796[/C][C]0.878200233186407[/C][C]0.439100116593204[/C][/ROW]
[ROW][C]49[/C][C]0.466988038826194[/C][C]0.933976077652388[/C][C]0.533011961173806[/C][/ROW]
[ROW][C]50[/C][C]0.428321220573537[/C][C]0.856642441147073[/C][C]0.571678779426463[/C][/ROW]
[ROW][C]51[/C][C]0.658192432174016[/C][C]0.683615135651969[/C][C]0.341807567825984[/C][/ROW]
[ROW][C]52[/C][C]0.580146977210436[/C][C]0.839706045579128[/C][C]0.419853022789564[/C][/ROW]
[ROW][C]53[/C][C]0.443960587780066[/C][C]0.887921175560132[/C][C]0.556039412219934[/C][/ROW]
[ROW][C]54[/C][C]0.446745111895736[/C][C]0.893490223791471[/C][C]0.553254888104264[/C][/ROW]
[/TABLE]
Source: https://freestatistics.org/blog/index.php?pk=66933&T=5

Globally Unique Identifier (entire table): ba.freestatistics.org/blog/index.php?pk=66933&T=5

As an alternative you can also use a QR Code:  

The GUIDs for individual cells are displayed in the table below:

Goldfeld-Quandt test for Heteroskedasticity
p-valuesAlternative Hypothesis
breakpoint indexgreater2-sidedless
70.1788410083719310.3576820167438620.82115899162807
80.3787962487579720.7575924975159430.621203751242028
90.5242591549581330.9514816900837330.475740845041867
100.6570240583254990.6859518833490020.342975941674501
110.5577393047840420.8845213904319150.442260695215958
120.746725717765330.506548564469340.25327428223467
130.7046109526421550.590778094715690.295389047357845
140.631398079236570.737203841526860.36860192076343
150.5580456353417930.8839087293164130.441954364658207
160.6897145247443690.6205709505112630.310285475255631
170.6733021735523150.653395652895370.326697826447685
180.6197499884824960.7605000230350090.380250011517504
190.6563266211475780.6873467577048450.343673378852422
200.5759170300231660.8481659399536690.424082969976834
210.503005590933090.993988818133820.49699440906691
220.4258068486397890.8516136972795770.574193151360211
230.35321867242940.70643734485880.6467813275706
240.2893725900974190.5787451801948380.710627409902581
250.3755112723259380.7510225446518760.624488727674062
260.3884672943801370.7769345887602730.611532705619863
270.4474451104382140.8948902208764280.552554889561786
280.3749551381177420.7499102762354840.625044861882258
290.3282141873025670.6564283746051340.671785812697433
300.2619578775274230.5239157550548460.738042122472577
310.2062473866707420.4124947733414830.793752613329258
320.1764790244239480.3529580488478970.823520975576052
330.1488725458144220.2977450916288430.851127454185578
340.1276750446917010.2553500893834010.872324955308299
350.1007103232221280.2014206464442560.899289676777872
360.08177017101746760.1635403420349350.918229828982532
370.06601410869238850.1320282173847770.933985891307612
380.1291625213001270.2583250426002530.870837478699873
390.09733587258146780.1946717451629360.902664127418532
400.07294267359284280.1458853471856860.927057326407157
410.08787834599385310.1757566919877060.912121654006147
420.08796200018717050.1759240003743410.91203799981283
430.1102111567801900.2204223135603790.88978884321981
440.08973376043468150.1794675208693630.910266239565318
450.07007956750535480.1401591350107100.929920432494645
460.2000840260728570.4001680521457150.799915973927143
470.2402120701489470.4804241402978950.759787929851053
480.5608998834067960.8782002331864070.439100116593204
490.4669880388261940.9339760776523880.533011961173806
500.4283212205735370.8566424411470730.571678779426463
510.6581924321740160.6836151356519690.341807567825984
520.5801469772104360.8397060455791280.419853022789564
530.4439605877800660.8879211755601320.556039412219934
540.4467451118957360.8934902237914710.553254888104264


Meta Analysis of Goldfeld-Quandt test for Heteroskedasticity
Description# significant tests% significant testsOK/NOK
1% type I error level00OK
5% type I error level00OK
10% type I error level00OK

\begin{tabular}{lllllllll}
\hline
Meta Analysis of Goldfeld-Quandt test for Heteroskedasticity \tabularnewline
Description & # significant tests & % significant tests & OK/NOK \tabularnewline
1% type I error level & 0 & 0 & OK \tabularnewline
5% type I error level & 0 & 0 & OK \tabularnewline
10% type I error level & 0 & 0 & OK \tabularnewline
\hline
\end{tabular}
%Source: https://freestatistics.org/blog/index.php?pk=66933&T=6

[TABLE]
[ROW][C]Meta Analysis of Goldfeld-Quandt test for Heteroskedasticity[/C][/ROW]
[ROW][C]Description[/C][C]# significant tests[/C][C]% significant tests[/C][C]OK/NOK[/C][/ROW]
[ROW][C]1% type I error level[/C][C]0[/C][C]0[/C][C]OK[/C][/ROW]
[ROW][C]5% type I error level[/C][C]0[/C][C]0[/C][C]OK[/C][/ROW]
[ROW][C]10% type I error level[/C][C]0[/C][C]0[/C][C]OK[/C][/ROW]
[/TABLE]
Source: https://freestatistics.org/blog/index.php?pk=66933&T=6

Globally Unique Identifier (entire table): ba.freestatistics.org/blog/index.php?pk=66933&T=6

As an alternative you can also use a QR Code:  

The GUIDs for individual cells are displayed in the table below:

Meta Analysis of Goldfeld-Quandt test for Heteroskedasticity
Description# significant tests% significant testsOK/NOK
1% type I error level00OK
5% type I error level00OK
10% type I error level00OK


Parameters (Session):
par1 = 3 ; par2 = Do not include Seasonal Dummies ; par3 = No Linear Trend ;
Parameters (R input):
par1 = 3 ; par2 = Do not include Seasonal Dummies ; par3 = No Linear Trend ;
R code (references can be found in the software module):
library(lattice)
library(lmtest)
n25 <- 25 #minimum number of obs. for Goldfeld-Quandt test
par1 <- as.numeric(par1)
x <- t(y)
k <- length(x[1,])
n <- length(x[,1])
x1 <- cbind(x[,par1], x[,1:k!=par1])
mycolnames <- c(colnames(x)[par1], colnames(x)[1:k!=par1])
colnames(x1) <- mycolnames #colnames(x)[par1]
x <- x1
if (par3 == 'First Differences'){
x2 <- array(0, dim=c(n-1,k), dimnames=list(1:(n-1), paste('(1-B)',colnames(x),sep='')))
for (i in 1:n-1) {
for (j in 1:k) {
x2[i,j] <- x[i+1,j] - x[i,j]
}
}
x <- x2
}
if (par2 == 'Include Monthly Dummies'){
x2 <- array(0, dim=c(n,11), dimnames=list(1:n, paste('M', seq(1:11), sep ='')))
for (i in 1:11){
x2[seq(i,n,12),i] <- 1
}
x <- cbind(x, x2)
}
if (par2 == 'Include Quarterly Dummies'){
x2 <- array(0, dim=c(n,3), dimnames=list(1:n, paste('Q', seq(1:3), sep ='')))
for (i in 1:3){
x2[seq(i,n,4),i] <- 1
}
x <- cbind(x, x2)
}
k <- length(x[1,])
if (par3 == 'Linear Trend'){
x <- cbind(x, c(1:n))
colnames(x)[k+1] <- 't'
}
x
k <- length(x[1,])
df <- as.data.frame(x)
(mylm <- lm(df))
(mysum <- summary(mylm))
if (n > n25) {
kp3 <- k + 3
nmkm3 <- n - k - 3
gqarr <- array(NA, dim=c(nmkm3-kp3+1,3))
numgqtests <- 0
numsignificant1 <- 0
numsignificant5 <- 0
numsignificant10 <- 0
for (mypoint in kp3:nmkm3) {
j <- 0
numgqtests <- numgqtests + 1
for (myalt in c('greater', 'two.sided', 'less')) {
j <- j + 1
gqarr[mypoint-kp3+1,j] <- gqtest(mylm, point=mypoint, alternative=myalt)$p.value
}
if (gqarr[mypoint-kp3+1,2] < 0.01) numsignificant1 <- numsignificant1 + 1
if (gqarr[mypoint-kp3+1,2] < 0.05) numsignificant5 <- numsignificant5 + 1
if (gqarr[mypoint-kp3+1,2] < 0.10) numsignificant10 <- numsignificant10 + 1
}
gqarr
}
bitmap(file='test0.png')
plot(x[,1], type='l', main='Actuals and Interpolation', ylab='value of Actuals and Interpolation (dots)', xlab='time or index')
points(x[,1]-mysum$resid)
grid()
dev.off()
bitmap(file='test1.png')
plot(mysum$resid, type='b', pch=19, main='Residuals', ylab='value of Residuals', xlab='time or index')
grid()
dev.off()
bitmap(file='test2.png')
hist(mysum$resid, main='Residual Histogram', xlab='values of Residuals')
grid()
dev.off()
bitmap(file='test3.png')
densityplot(~mysum$resid,col='black',main='Residual Density Plot', xlab='values of Residuals')
dev.off()
bitmap(file='test4.png')
qqnorm(mysum$resid, main='Residual Normal Q-Q Plot')
qqline(mysum$resid)
grid()
dev.off()
(myerror <- as.ts(mysum$resid))
bitmap(file='test5.png')
dum <- cbind(lag(myerror,k=1),myerror)
dum
dum1 <- dum[2:length(myerror),]
dum1
z <- as.data.frame(dum1)
z
plot(z,main=paste('Residual Lag plot, lowess, and regression line'), ylab='values of Residuals', xlab='lagged values of Residuals')
lines(lowess(z))
abline(lm(z))
grid()
dev.off()
bitmap(file='test6.png')
acf(mysum$resid, lag.max=length(mysum$resid)/2, main='Residual Autocorrelation Function')
grid()
dev.off()
bitmap(file='test7.png')
pacf(mysum$resid, lag.max=length(mysum$resid)/2, main='Residual Partial Autocorrelation Function')
grid()
dev.off()
bitmap(file='test8.png')
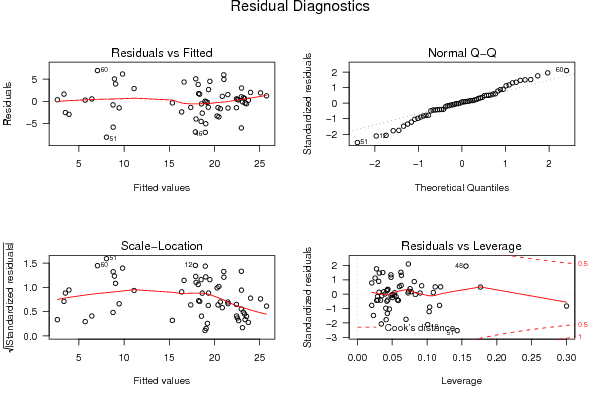
opar <- par(mfrow = c(2,2), oma = c(0, 0, 1.1, 0))
plot(mylm, las = 1, sub='Residual Diagnostics')
par(opar)
dev.off()
if (n > n25) {
bitmap(file='test9.png')
plot(kp3:nmkm3,gqarr[,2], main='Goldfeld-Quandt test',ylab='2-sided p-value',xlab='breakpoint')
grid()
dev.off()
}
load(file='createtable')
a<-table.start()
a<-table.row.start(a)
a<-table.element(a, 'Multiple Linear Regression - Estimated Regression Equation', 1, TRUE)
a<-table.row.end(a)
myeq <- colnames(x)[1]
myeq <- paste(myeq, '[t] = ', sep='')
for (i in 1:k){
if (mysum$coefficients[i,1] > 0) myeq <- paste(myeq, '+', '')
myeq <- paste(myeq, mysum$coefficients[i,1], sep=' ')
if (rownames(mysum$coefficients)[i] != '(Intercept)') {
myeq <- paste(myeq, rownames(mysum$coefficients)[i], sep='')
if (rownames(mysum$coefficients)[i] != 't') myeq <- paste(myeq, '[t]', sep='')
}
}
myeq <- paste(myeq, ' + e[t]')
a<-table.row.start(a)
a<-table.element(a, myeq)
a<-table.row.end(a)
a<-table.end(a)
table.save(a,file='mytable1.tab')
a<-table.start()
a<-table.row.start(a)
a<-table.element(a,hyperlink('ols1.htm','Multiple Linear Regression - Ordinary Least Squares',''), 6, TRUE)
a<-table.row.end(a)
a<-table.row.start(a)
a<-table.element(a,'Variable',header=TRUE)
a<-table.element(a,'Parameter',header=TRUE)
a<-table.element(a,'S.D.',header=TRUE)
a<-table.element(a,'T-STAT
H0: parameter = 0',header=TRUE)
a<-table.element(a,'2-tail p-value',header=TRUE)
a<-table.element(a,'1-tail p-value',header=TRUE)
a<-table.row.end(a)
for (i in 1:k){
a<-table.row.start(a)
a<-table.element(a,rownames(mysum$coefficients)[i],header=TRUE)
a<-table.element(a,mysum$coefficients[i,1])
a<-table.element(a, round(mysum$coefficients[i,2],6))
a<-table.element(a, round(mysum$coefficients[i,3],4))
a<-table.element(a, round(mysum$coefficients[i,4],6))
a<-table.element(a, round(mysum$coefficients[i,4]/2,6))
a<-table.row.end(a)
}
a<-table.end(a)
table.save(a,file='mytable2.tab')
a<-table.start()
a<-table.row.start(a)
a<-table.element(a, 'Multiple Linear Regression - Regression Statistics', 2, TRUE)
a<-table.row.end(a)
a<-table.row.start(a)
a<-table.element(a, 'Multiple R',1,TRUE)
a<-table.element(a, sqrt(mysum$r.squared))
a<-table.row.end(a)
a<-table.row.start(a)
a<-table.element(a, 'R-squared',1,TRUE)
a<-table.element(a, mysum$r.squared)
a<-table.row.end(a)
a<-table.row.start(a)
a<-table.element(a, 'Adjusted R-squared',1,TRUE)
a<-table.element(a, mysum$adj.r.squared)
a<-table.row.end(a)
a<-table.row.start(a)
a<-table.element(a, 'F-TEST (value)',1,TRUE)
a<-table.element(a, mysum$fstatistic[1])
a<-table.row.end(a)
a<-table.row.start(a)
a<-table.element(a, 'F-TEST (DF numerator)',1,TRUE)
a<-table.element(a, mysum$fstatistic[2])
a<-table.row.end(a)
a<-table.row.start(a)
a<-table.element(a, 'F-TEST (DF denominator)',1,TRUE)
a<-table.element(a, mysum$fstatistic[3])
a<-table.row.end(a)
a<-table.row.start(a)
a<-table.element(a, 'p-value',1,TRUE)
a<-table.element(a, 1-pf(mysum$fstatistic[1],mysum$fstatistic[2],mysum$fstatistic[3]))
a<-table.row.end(a)
a<-table.row.start(a)
a<-table.element(a, 'Multiple Linear Regression - Residual Statistics', 2, TRUE)
a<-table.row.end(a)
a<-table.row.start(a)
a<-table.element(a, 'Residual Standard Deviation',1,TRUE)
a<-table.element(a, mysum$sigma)
a<-table.row.end(a)
a<-table.row.start(a)
a<-table.element(a, 'Sum Squared Residuals',1,TRUE)
a<-table.element(a, sum(myerror*myerror))
a<-table.row.end(a)
a<-table.end(a)
table.save(a,file='mytable3.tab')
a<-table.start()
a<-table.row.start(a)
a<-table.element(a, 'Multiple Linear Regression - Actuals, Interpolation, and Residuals', 4, TRUE)
a<-table.row.end(a)
a<-table.row.start(a)
a<-table.element(a, 'Time or Index', 1, TRUE)
a<-table.element(a, 'Actuals', 1, TRUE)
a<-table.element(a, 'Interpolation
Forecast', 1, TRUE)
a<-table.element(a, 'Residuals
Prediction Error', 1, TRUE)
a<-table.row.end(a)
for (i in 1:n) {
a<-table.row.start(a)
a<-table.element(a,i, 1, TRUE)
a<-table.element(a,x[i])
a<-table.element(a,x[i]-mysum$resid[i])
a<-table.element(a,mysum$resid[i])
a<-table.row.end(a)
}
a<-table.end(a)
table.save(a,file='mytable4.tab')
if (n > n25) {
a<-table.start()
a<-table.row.start(a)
a<-table.element(a,'Goldfeld-Quandt test for Heteroskedasticity',4,TRUE)
a<-table.row.end(a)
a<-table.row.start(a)
a<-table.element(a,'p-values',header=TRUE)
a<-table.element(a,'Alternative Hypothesis',3,header=TRUE)
a<-table.row.end(a)
a<-table.row.start(a)
a<-table.element(a,'breakpoint index',header=TRUE)
a<-table.element(a,'greater',header=TRUE)
a<-table.element(a,'2-sided',header=TRUE)
a<-table.element(a,'less',header=TRUE)
a<-table.row.end(a)
for (mypoint in kp3:nmkm3) {
a<-table.row.start(a)
a<-table.element(a,mypoint,header=TRUE)
a<-table.element(a,gqarr[mypoint-kp3+1,1])
a<-table.element(a,gqarr[mypoint-kp3+1,2])
a<-table.element(a,gqarr[mypoint-kp3+1,3])
a<-table.row.end(a)
}
a<-table.end(a)
table.save(a,file='mytable5.tab')
a<-table.start()
a<-table.row.start(a)
a<-table.element(a,'Meta Analysis of Goldfeld-Quandt test for Heteroskedasticity',4,TRUE)
a<-table.row.end(a)
a<-table.row.start(a)
a<-table.element(a,'Description',header=TRUE)
a<-table.element(a,'# significant tests',header=TRUE)
a<-table.element(a,'% significant tests',header=TRUE)
a<-table.element(a,'OK/NOK',header=TRUE)
a<-table.row.end(a)
a<-table.row.start(a)
a<-table.element(a,'1% type I error level',header=TRUE)
a<-table.element(a,numsignificant1)
a<-table.element(a,numsignificant1/numgqtests)
if (numsignificant1/numgqtests < 0.01) dum <- 'OK' else dum <- 'NOK'
a<-table.element(a,dum)
a<-table.row.end(a)
a<-table.row.start(a)
a<-table.element(a,'5% type I error level',header=TRUE)
a<-table.element(a,numsignificant5)
a<-table.element(a,numsignificant5/numgqtests)
if (numsignificant5/numgqtests < 0.05) dum <- 'OK' else dum <- 'NOK'
a<-table.element(a,dum)
a<-table.row.end(a)
a<-table.row.start(a)
a<-table.element(a,'10% type I error level',header=TRUE)
a<-table.element(a,numsignificant10)
a<-table.element(a,numsignificant10/numgqtests)
if (numsignificant10/numgqtests < 0.1) dum <- 'OK' else dum <- 'NOK'
a<-table.element(a,dum)
a<-table.row.end(a)
a<-table.end(a)
table.save(a,file='mytable6.tab')
}